. 2015 Sep;26(5):673-80.
doi: 10.1097/EDE.0000000000000319.

Lies, Damned Lies, and Health Inequality Measurements: Understanding the Value Judgments

Affiliations

Lies, Damned Lies, and Health Inequality Measurements: Understanding the Value Judgments

Gustav Kjellsson et al. Epidemiology. 2015 Sep.

Abstract

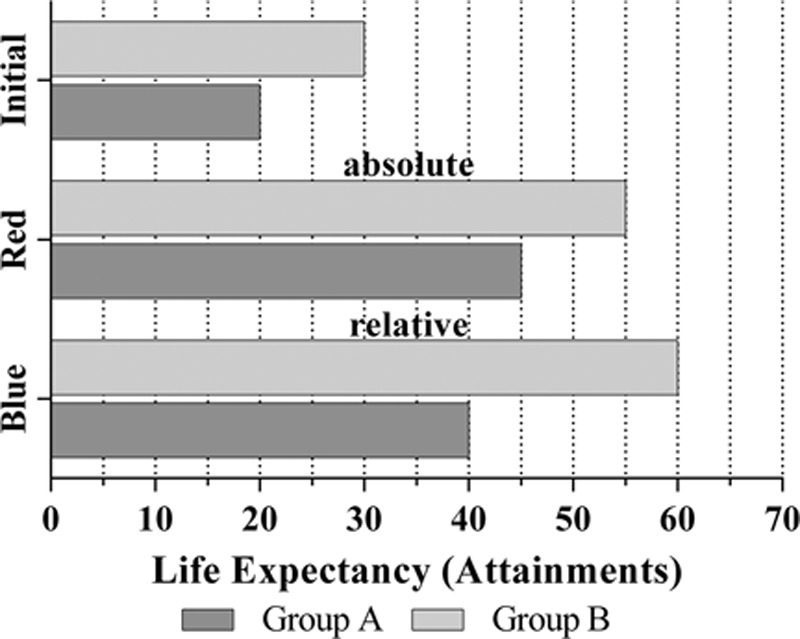
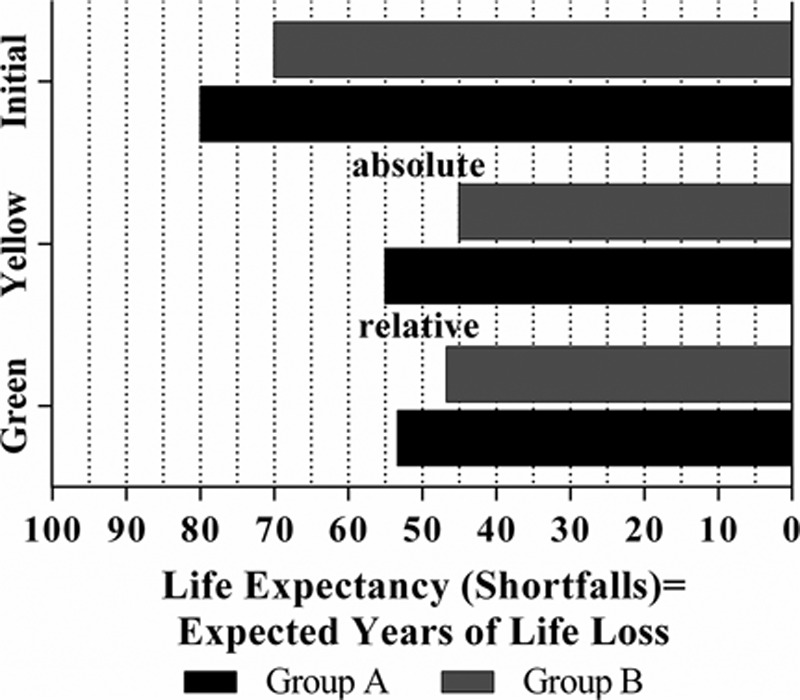
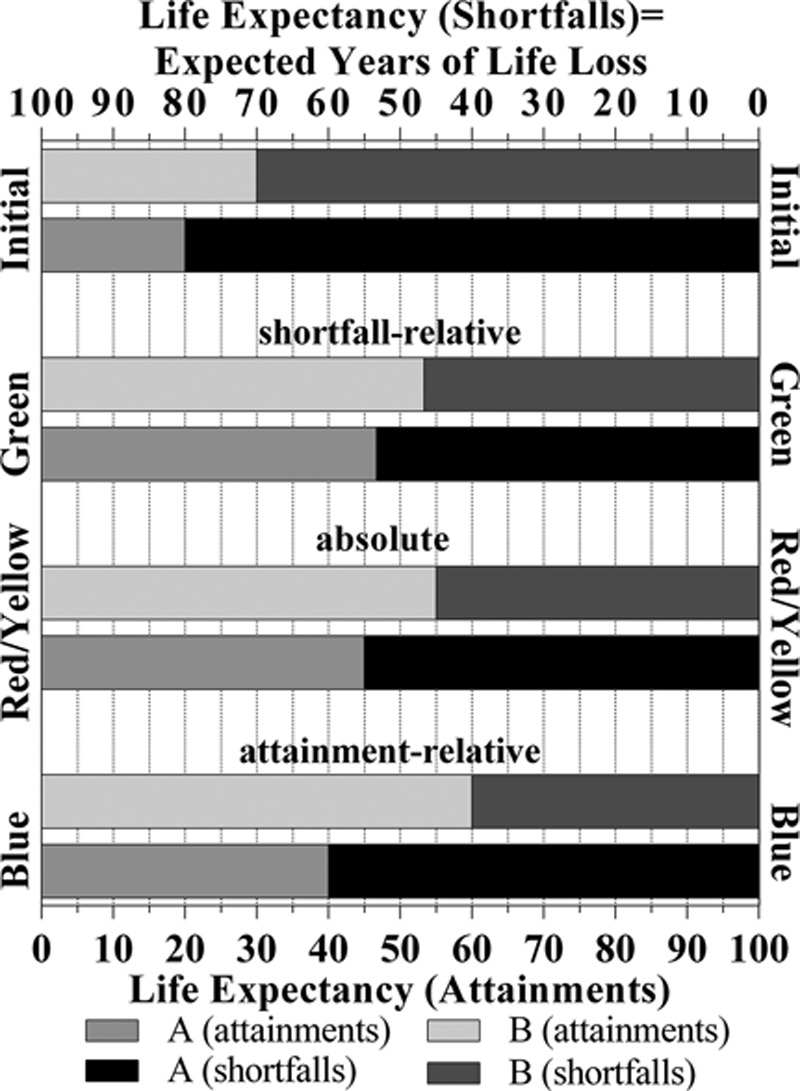
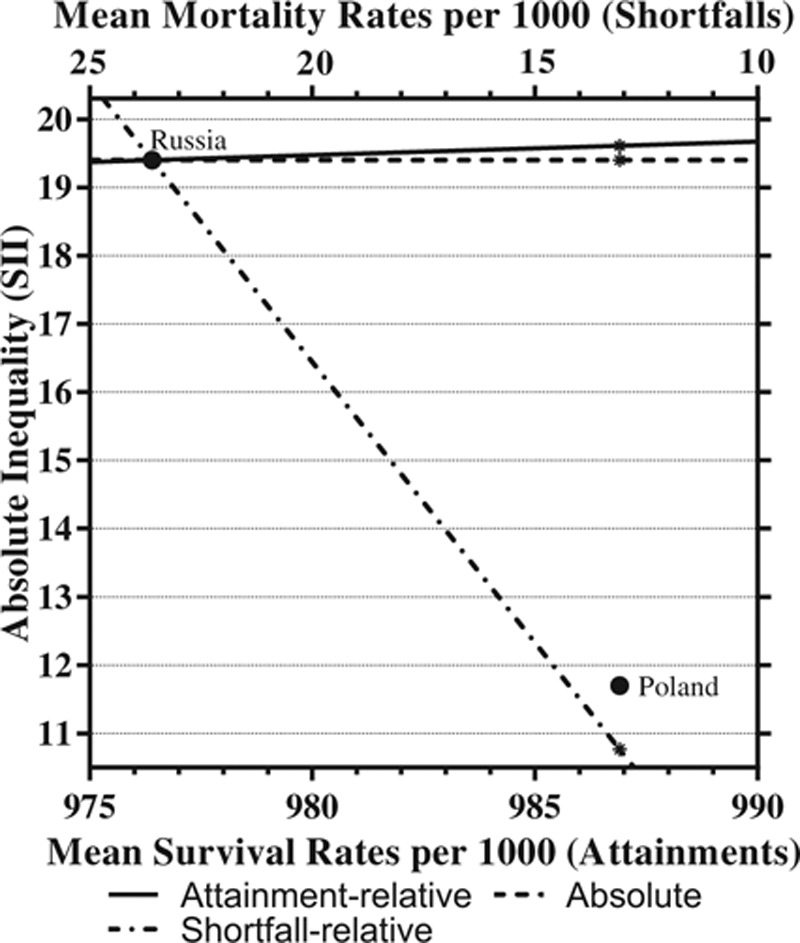
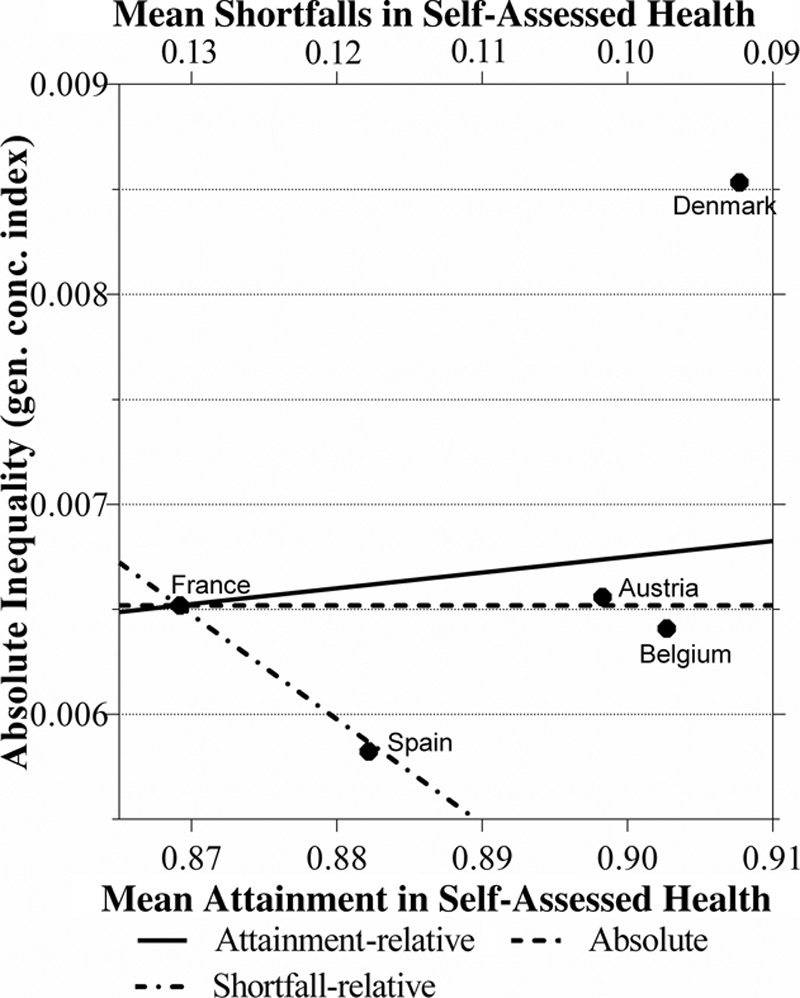
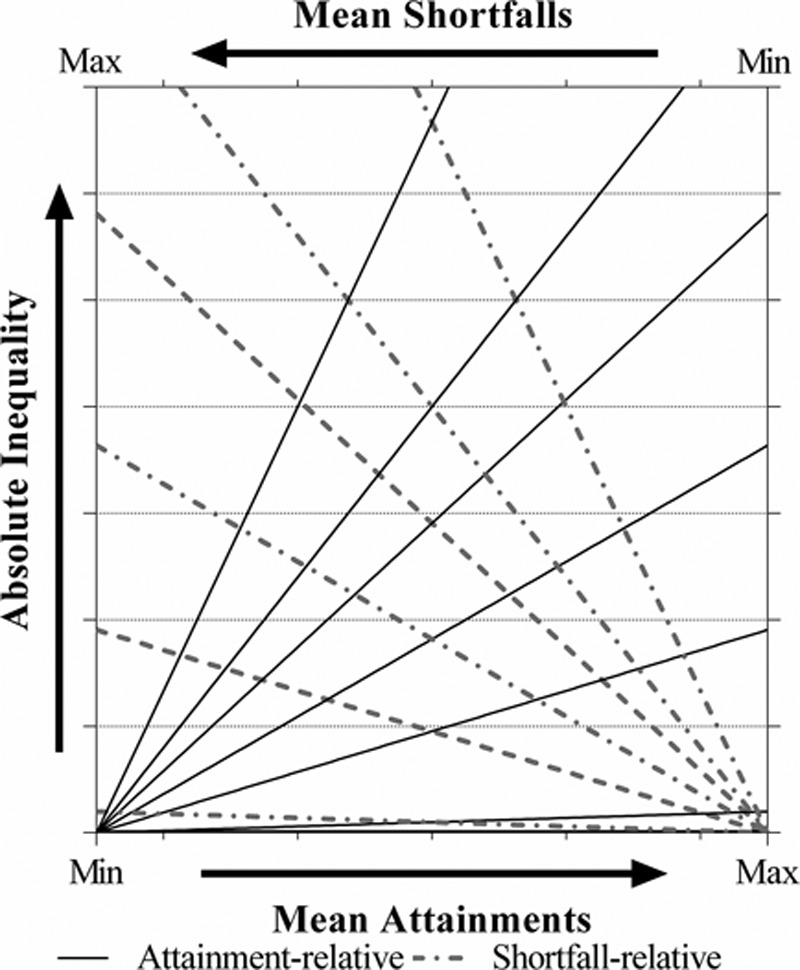
Measuring and monitoring socioeconomic health inequalities are critical for understanding the impact of policy decisions. However, the measurement of health inequality is far from value neutral, and one can easily present the measure that best supports one's chosen conclusion or selectively exclude measures. Improving people's understanding of the often implicit value judgments is therefore important to reduce the risk that researchers mislead or policymakers are misled. While the choice between relative and absolute inequality is already value laden, further complexities arise when, as is often the case, health variables have both a lower and upper bound, and thus can be expressed in terms of either attainments or shortfalls, such as for mortality/survival.We bring together the recent parallel discussions from epidemiology and health economics regarding health inequality measurement and provide a deeper understanding of the different value judgments within absolute and relative measures expressed both in attainments and shortfalls, by graphically illustrating both hypothetical and real examples. We show that relative measures in terms of attainments and shortfalls have distinct value judgments, highlighting that for health variables with two bounds the choice is no longer only between an absolute and a relative measure but between an absolute, an attainment- relative and a shortfall-relative one. We illustrate how these three value judgments can be combined onto a single graph which shows the rankings according to all three measures, and illustrates how the three measures provide ethical benchmarks against which to judge the difference in inequality between populations.


Conflict of interest statement

The authors report no conflicts of interest.

Figures

FIGURE 1.
FIGURE 1.
Asada’s hypothetical experiment. This figure illustrates Asada’s hypothetical experiment and pedagogical example. The bars represent the initial distribution and the distribution after each individual in the population has received a red or a blue pill. The red pill increases life expectancy by equal amounts in the two groups, whereas the blue pill increases life expectancy proportionally. For the red pill, the absolute difference between the two groups is constant at 10, while the ratio decreases from 1.5 to 1.22. For the blue pill, the absolute difference increases to 20, whereas the ratio is constant at 1.5.
FIGURE 2.
FIGURE 2.
A shortfall version of Asada’s hypothetical experiment. This figure illustrates an extension of Asada’s original experiments from Figure 1. The bars represent the initial distribution, and the outcomes of the yellow and green pills in terms of shortfalls of life expectancy (instead of attainments), assuming that life expectancy is bounded at 100. The yellow pill increases life expectancy uniformly, whereas the green pill increases life expectancy by proportionally decreasing the shortfall of life expectancy (or years of life lost). For the yellow pill, the absolute difference between the two groups is constant at 10, whereas the shortfall ratio increases from 1.14 to 1.22. For the green pill, the absolute difference decreases to 6.67, whereas the shortfall ratio is constant at 1.14.
FIGURE 3.
FIGURE 3.
The hypothetical experiments represented as shortfalls and attainments. This figure illustrates both Asada’s original experiments from Figure 1 and the extended experiment from Figure 2 in the same graph. The bars represent the initial distribution and the outcomes of each of the pills in attainments and matching shortfalls. Any pill induces the same increase in average life expectancy, but the increase is distributed differently in the population. The different ways to distribute the total increase may be interpreted as the inequality equivalence criteria of the different indices.
FIGURE 4.
FIGURE 4.
Socioeconomic inequality in mortality/survival in Russia and Poland. This figure plots the absolute inequality as measured by the SII against the (weighted) mean survival/mortality rates for Russia and Poland. The three lines represent populations with the same level of inequality as Russia according to each measure, but with different mean health. The three dots illustrate how Russia would compare with Poland (in terms of absolute inequality) if mortality rates were reduced by proportionally reducing the mortality rates (relative to shortfalls), uniformly reducing the mortality rates (absolute), or increasing the survival rates proportionally (relative to attainments) over the socioeconomic groups. The lines are plotted using the relation among SII, the mean, and ARII (or SRII). As relative index of inequality (RII) is presented as a (odds) ratio, the attainment-relative lines may be expressed as SII = 2 * mean_attainment * (ARII − 1)/(ARII + 1), and the shortfall-relative as SII = 2 *(1,000 − mean_shortfall) * (SRII − 1)/(SRII + 1), where ARII and SRII are constants representing the level of inequality in Russia according to each measure. ARII indicates attainment-relative index of inequality; SII, slope index of inequality; SRII, shortfall- relative index of inequality.
FIGURE 5.
FIGURE 5.
Socioeconomic inequality in self-assessed health in five European countries. This figure plots the absolute inequality (as measured by the generalized concentration index) against self-assessed health (in attainments and matching shortfalls) for a subsample of countries from a European comparison. eFigure 1 in the online material (http://links.lww.com/EDE/A925) presents a graph with all countries. The three lines represent populations with the same level of inequality as France according to each measure, but with different mean health. The lines are plotted using the relation among the generalized concentration index, the mean, and (shortfall-relative/attainment-relative) concentration index (see supplementary material; http://links.lww.com/EDE/A925). As it is of semantic importance for interpretation, we ignore that the sign of the generalized concentration index differs if data is represented as shortfall or attainments.
FIGURE 6.
FIGURE 6.
A generalized graph for simultaneously presenting shortfall-relative, absolute, and attainment-relative inequality. This figure is a generalized graph plotting the absolute inequality against the mean health, measured as shortfalls from the right to the left and as attainments from the left to the right. The straight lines starting at the left origin represent different level of attainment-relative inequality and the straight lines starting at the right origin represent different levels of shortfall-relative inequality: the steeper the ray, the higher the level of inequality. For applications using this structure see eFigures 1 and 2 in the online material (http://links.lww.com/EDE/A925).

Comment in

References

    1. Mackenbach JP, Stirbu I, Roskam AJ, et al. European Union Working Group on Socioeconomic Inequalities in Health. Socioeconomic inequalities in health in 22 European countries. N Engl J Med. 2008;358:2468–2481. - PubMed
    1. Vandenheede H, Vikhireva O, Pikhart H, et al. Socioeconomic inequalities in all-cause mortality in the Czech Republic, Russia, Poland and Lithuania in the 2000s: findings from the HAPIEE Study. J Epidemiol Community Health. 2014;68:297–303. - PMC - PubMed
    1. van Doorslaer E, Koolman X. Explaining the differences in income-related health inequalities across European countries. Health Econ. 2004;13:609–628. - PubMed
    1. Wagstaff A. Inequality aversion, health inequalities and health achievement. J Health Econ. 2002;21:627–641. - PubMed
    1. Harper S, Lynch J. Measuring health inequalities. Methods Soc Epidemiol. 2006;1:134.

Publication types