. 2015 Jul 1;7(7):1988-99.
doi: 10.1093/gbe/evv121.

Quest for Orthologs Entails Quest for Tree of Life: In Search of the Gene Stream

Affiliations

Quest for Orthologs Entails Quest for Tree of Life: In Search of the Gene Stream

Brigitte Boeckmann et al. Genome Biol Evol. .

Abstract

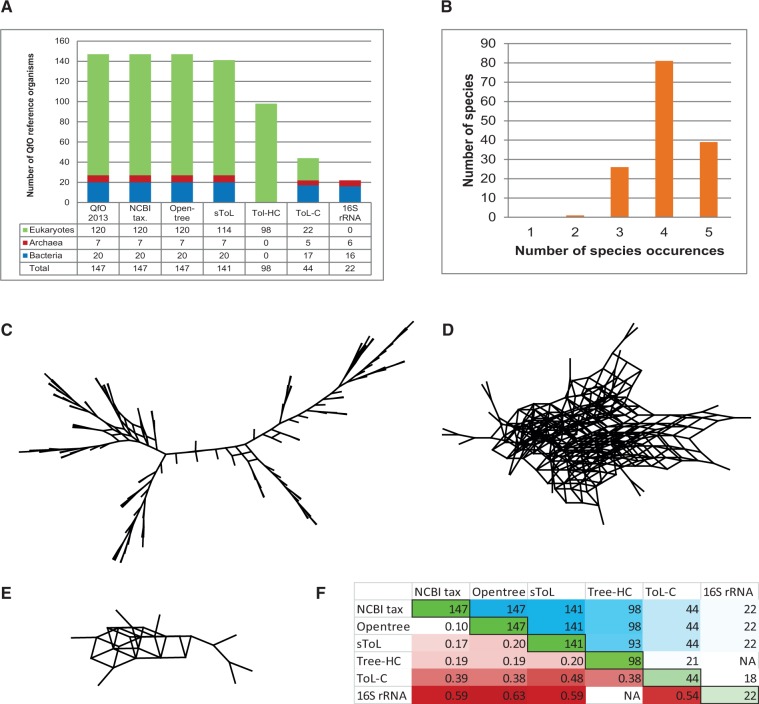
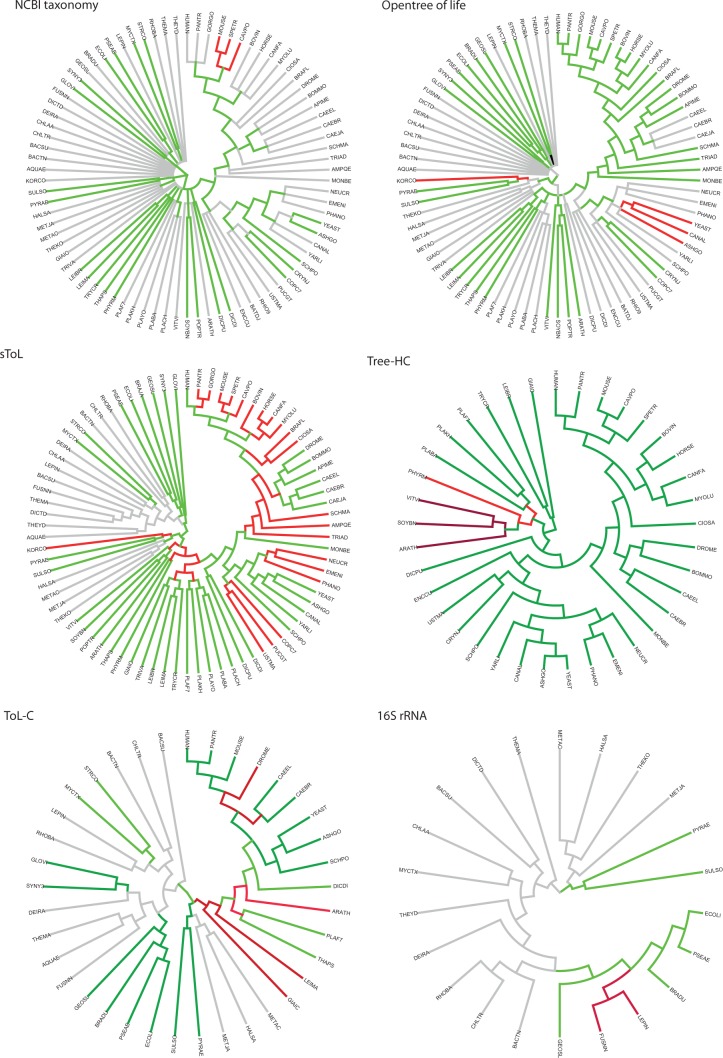
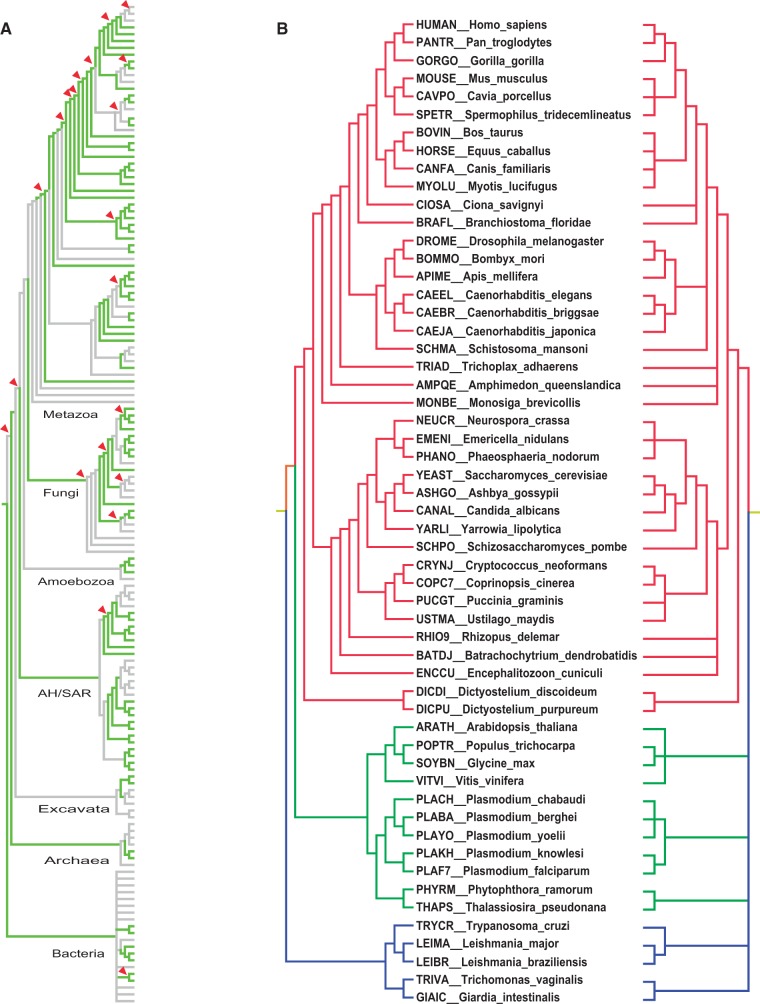
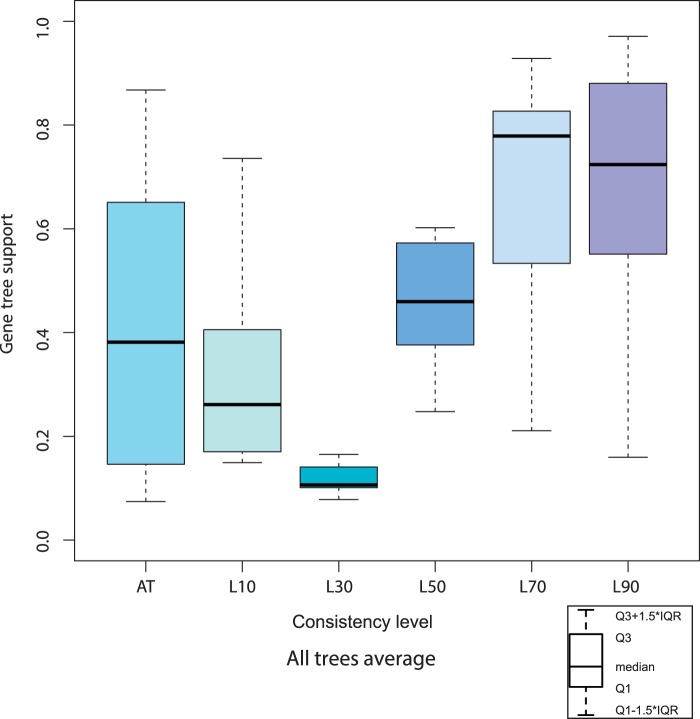
Quest for Orthologs (QfO) is a community effort with the goal to improve and benchmark orthology predictions. As quality assessment assumes prior knowledge on species phylogenies, we investigated the congruency between existing species trees by comparing the relationships of 147 QfO reference organisms from six Tree of Life (ToL)/species tree projects: The National Center for Biotechnology Information (NCBI) taxonomy, Opentree of Life, the sequenced species/species ToL, the 16S ribosomal RNA (rRNA) database, and trees published by Ciccarelli et al. (Ciccarelli FD, et al. 2006. Toward automatic reconstruction of a highly resolved tree of life. Science 311:1283-1287) and by Huerta-Cepas et al. (Huerta-Cepas J, Marcet-Houben M, Gabaldon T. 2014. A nested phylogenetic reconstruction approach provides scalable resolution in the eukaryotic Tree Of Life. PeerJ PrePrints 2:223) Our study reveals that each species tree suggests a different phylogeny: 87 of the 146 (60%) possible splits of a dichotomous and rooted tree are congruent, while all other splits are incongruent in at least one of the species trees. Topological differences are observed not only at deep speciation events, but also within younger clades, such as Hominidae, Rodentia, Laurasiatheria, or rosids. The evolutionary relationships of 27 archaea and bacteria are highly inconsistent. By assessing 458,108 gene trees from 65 genomes, we show that consistent species topologies are more often supported by gene phylogenies than contradicting ones. The largest concordant species tree includes 77 of the QfO reference organisms at the most. Results are summarized in the form of a consensus ToL (http://swisstree.vital-it.ch/species_tree) that can serve different benchmarking purposes.

Keywords: Tree of Life; gene tree support; species tree.


Figures

F<sc>ig</sc>. 1.—
Fig. 1.—
Comparison of the six species trees. (A) Coverage of QfO species in the analyzed ToLs/species trees: Stacked bar chart of species from the Quest for Orthologs reference proteome set 2013 mapped to the species trees, color-coded by domains of life. The far left column presents the QfO reference organisms. (B) Frequency of QfO reference organisms in the analyzed ToLs/species trees. On average, each QfO reference organism occurred in the data set about 4.1 times; represented only twice are the amoeba Polysphondylium_pallidum (NCBI TaxId: 13642), the fungi Rhizopus delemar (TaxId: 246409) and Batrachochytrium_dendrobatidis (NCBI TaxId: 684364). Supernetwork of the eukaryote (C), bacterial (D), and archaeal (E) clade visualize topological congruence and incongruence between ToLs/species trees. (F) RF distances between ToLs/species trees: For each tree, the table shows the number of species in common with the species of the QfO reference data set (green cells), the number of QfO reference organisms shared by two trees (blue), and the average RF distances per node between trees (red).
F<sc>ig</sc>. 2.—
Fig. 2.—
Overview of critical spots in reconstructed species phylogenies. For lack of space, all species trees were pruned to include only species which illustrate yet unresolved phylogenies and contradicting topologies. Color codes: Light green = topologies supporting the consensus tree (fig. 3); dark green = topologies supporting the consensus tree with significant support; red = topologies differ from the consensus tree; dark red = topologies with significant support differ from the consensus tree; light gray = unresolved and/or unknown topologies.
F<sc>ig</sc>. 3.—
Fig. 3.—
Consensus tree. (A) Consensus phylogeny of the 147 QfO reference organisms. Green branches highlight congruent and bifurcating topologies, grey branches indicate topologies that are either multifurcating or incongruent in at least one of the species trees. Red triangles mark nodes that are supported by at least 75% of the gene trees (see also supplementary file S4, Supplementary Material online). (B) Eukaryotic clade of the consensus tree at highest (bifurcating, left handed) and lowest (L90, right handed) resolution, pruned to the species set as in figure 2. Bifurcation is not yet possible for most internal nodes in the archaeal and bacterial clades; the topologies are thus identical for both trees.
F<sc>ig</sc>. 4.—
Fig. 4.—
Box plot of gene tree fractions supporting species tree topologies at different consistency levels. Consistent species tree topologies with (L90) and without (L70) significant branch support are generally in compliance with the analyzed gene trees. The fraction of supporting gene trees drops considerably when species tree topologies are incongruent, once or more, between the species trees (L10, L30, L50). Consistency categories “L30” and AT were assigned for practical reasons. Level L30 is the default value for conflicting nodes prior to evaluation, and the two remaining nodes (Excavata, Proteobacteria) show on the one hand conflicting species topologies, on the other hand significant branch support in at least one of the species trees. Only a low fraction of our gene trees supports these speciation nodes. Category AT indicates alternative topologies suggested by the species trees, and results cover the range of conflicting levels (L10, L50); this makes sense because alternative topologies are incongruent with the consensus tree and between species trees. For each box plot, bottom of the box is the first quartile (Q1), top of the box is the third quartile (Q3), the middle bar is the median, whiskers represent the 1.5 interquartile range (IQR).

References

    1. Bapteste E, Boucher Y, Leigh J, Doolittle WF. 2004. Phylogenetic reconstruction and lateral gene transfer. Trends Microbiol. 12:406–411. - PubMed
    1. Burki F, Okamoto N, Pombert JF, Keeling PJ. 2012. The evolutionary history of haptophytes and cryptophytes: phylogenomic evidence for separate origins. Proc Biol Sci. 279:2246–2254. - PMC - PubMed
    1. Burleigh JG, et al. 2010. Genome-scale phylogenetics: inferring the plant tree of life from 18,896 gene trees. Syst Biol. 60:117–125. - PMC - PubMed
    1. Capella-Gutierrez S, Marcet-Houben M, Gabaldon T. 2012. Phylogenomics supports microsporidia as the earliest diverging clade of sequenced fungi. BMC Biol. 10:47. - PMC - PubMed
    1. Case RJ, et al. 2007. Use of 16S rRNA and rpoB genes as molecular markers for microbial ecology studies. Appl Environ Microbiol. 73:278–288. - PMC - PubMed

Publication types