. 2015 Jul 2:5:11663.
doi: 10.1038/srep11663.

Resistance of R-Ras knockout mice to skin tumour induction

Affiliations

Resistance of R-Ras knockout mice to skin tumour induction

Ulrike May et al. Sci Rep. .

Abstract

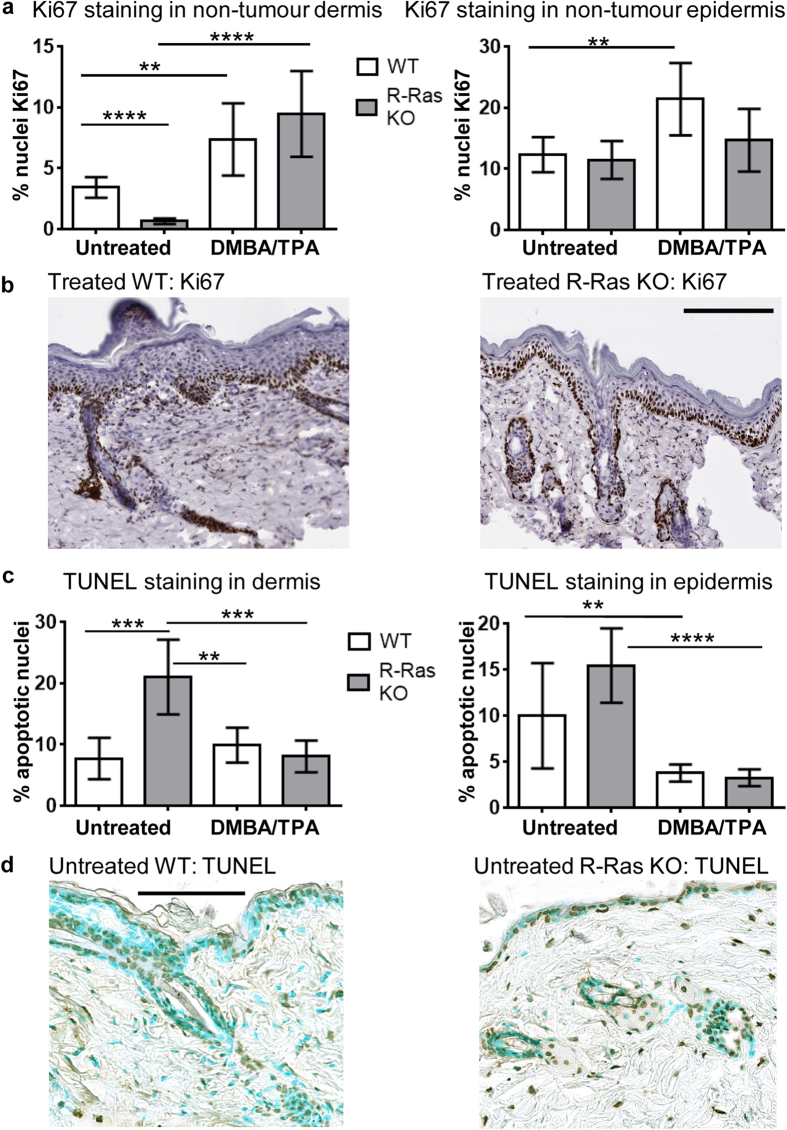
The R-ras gene encodes a small GTPase that is a member of the Ras family. Despite close sequence similarities, R-Ras is functionally distinct from the prototypic Ras proteins; no transformative activity and no activating mutations of R-Ras in human malignancies have been reported for it. R-Ras activity appears inhibitory towards tumour proliferation and invasion, and to promote cellular quiescence. Contrary to this, using mice with a deletion of the R-ras gene, we found that R-Ras facilitates DMBA/TPA-induced skin tumour induction. The tumours appeared in wild-type (WT) mice on average 6 weeks earlier than in R-Ras knockout (R-Ras KO) mice. WT mice developed almost 6 times more tumours than R-Ras KO mice. Despite strong R-Ras protein expression in the dermal blood vessels, no R-Ras could be detected in the epidermis from where the tumours arose. The DMBA/TPA skin tumourigenesis-model is highly dependent upon inflammation, and we found a greatly attenuated skin inflammatory response to DMBA/TPA-treatment in the R-Ras KO mice in the context of leukocyte infiltration and proinflammatory cytokine expression. Thus, these data suggest that despite its characterised role in promoting cellular quiescence, R-Ras is pro-tumourigenic in the DMBA/TPA tumour model and important for the inflammatory response to DMBA/TPA treatment.


Figures

Figure 1
Figure 1. R-Ras is crucial for skin tumour formation.
Wild-type (WT, solid line) and R-Ras knockout (R-Ras KO, dashed line) mice were subjected to DMBA/TPA-induced skin carcinogenesis as described in the methods section. Two individual trials were performed, both trials yielded a very similar outcome, and the data (WT: n = 13 and 15; R-Ras KO: n = 18 and 14) were combined. (a) The percentage of tumour-free animals at each time point is shown. Because the proportional hazards assumption appeared correct, a survival plot was generated and analysed via log-rank (Mantel-Cox) test, as described in methods. The data for the WT and R-Ras KO groups were highly significantly different (P < 0.0001). The median time to tumour onset in the WT mice was 11 weeks, whereas for the R-Ras KO mice it was 17 weeks. (b) The mean number of tumours per mouse at each time point is shown ± 95% confidence interval. The data were analysed using STATA 13.0 software as described in methods. Because the data was count data (not normally distributed), a non-linear regression model was used to compare the slopes of the data. Because the variances of tumour number in the R-Ras KO and WT mice were larger than the means of tumour number (i.e. over-dispersed), negative binomial regression was selected to analyse the data. The data from the two groups were highly significantly different (P < 0.001). The R-Ras KO mice had on average 3.2 × (95% CI 1.97, 5.21) fewer tumours than the WT mice. At the end of the trial, WT mice had on average 5.86 × more tumours than the R-Ras KO mice. (c) Representative photograph of a WT mouse at the end of the DMBA/TPA treatment trial, alongside a hematoxylin-eosin stained section of skin (the black bar represents 7 mm). The abundance of small and large tumours upon the skin can be clearly seen. (d) Representative photograph of an R-Ras KO mouse at the end of the DMBA/TPA treatment trial, alongside a hematoxylin-eosin stained section of skin (the black bar represents 6 mm). There are no visible tumours.
Figure 2
Figure 2. R-Ras is expressed exclusively in the blood vessels in the dermal part of the skin, but not in the epidermis.
Both untreated and DMBA/TPA-treated skins were collected and either fixed for immunohistochemistry (IHC), or homogenised and lysed in RIPA buffer for western blot analysis, and R-Ras expression detected as described in the methods section. (a) Detection of R-Ras protein in Western blot analysis of skin lysates. The blot was stripped and reprobed with β-actin as loading control. The images displayed are cropped (full-length blots/gels are presented in Supplementary Figure S1). The WT mice were confirmed to express R-Ras in their skin, while the KO mice did not express R-Ras. The relative mean R-Ras protein expression was analysed by densitometry: WT untreated: 0.91 with 95% CI −0.21, 2.034; WT DMBA/TPA treated: 0.52 with 95% CI 0.47, 0.57. Cropped pictures are shown. (b) DMBA/TPA-treated WT skin (including tumours) and R-Ras KO skin was fixed with 4% paraformaldehyde, embedded in paraffin, and stained for R-Ras protein expression by IHC. Representative photographs of the results are shown. The R-Ras KO mice were confirmed not to express R-Ras at all. In the WT mice strong R-Ras expression can be seen in the dermal blood vessels (red outlined arrows), while some very occasional dermal cells (or infiltrating migratory cells) may also weakly express R-Ras. Epidermis is devoid of any R-Ras expression. The black bar represents 100 μm.
Figure 3
Figure 3. Deficiency of R-Ras leads to increased angiogenic response in the dermis after DMBA/TPA treatment.
WT and R-Ras KO littermates were subjected to DMBA/TPA-induced skin carcinogenesis as described in methods. Skin samples were collected, fixed and processed for IHC. (a) The percentage area of dermis with microvasculature was determined by immunohistochemical staining for CD31 of 4% paraformaldehyde fixed, paraffin embedded sections of back skin (WT: n = 5; R-Ras KO: n = 4; 6 independent measurements per animal). Quantitative analysis of blood vessel density in dermis was performed by Spectrum digital pathology system/Image Scope analysis software as described in methods. The data were Log (10) transformed to fit a normal distribution and statistically analysed via GraphPad Prism 6. The values are shown as mean ± 95% confidence interval. Using a standard two-sided unpaired T-test, after DMBA/TPA treatment, the R-Ras KO mice have significantly more blood vessels in dermis than the WT mice (P < 0.0001, ****) despite showing almost no tumour formation. (b) The area of dermal staining for CD31 was analysed in DMBA/TPA-treated WT mice with tumours (n = 5). The dermis beneath large tumours (>2 mm) had significantly more blood vessels than the dermis beneath small tumours (<2 mm) (P = 0.0036, **) and the normal dermis (P < 0.0001, ****). There was not enough R-Ras KO tumour histology data for statistical analysis due to the lack of tumourigenesis in those animals. (c) Representative CD31 staining for blood vessels in DMBA/TPA-treated skin is shown for the WT and R-Ras KO animals. Despite having almost no detectable tumours, mice lacking R-Ras show an increased number of blood vessels in their skin after the DMBA/TPA-treatment. (d) The number of blood vessels is increased beneath skin tumours during DMBA/TPA-induced carcinogenesis in the WT animals. Representative images of CD31 staining are shown from a region of skin (I) with no visible tumour formation, (II) with a small tumour and (III) with a large tumour. (IV) The DMBA/TPA-treated skin sample from a WT mouse was stained with class-matched mouse IgG as a specificity control. Black bar in images represents 200 μm.
Figure 4
Figure 4. Cell proliferation is reduced and the number of apoptotic cells is increased in the normal dermis of R-Ras KO mice.
WT and R-Ras KO mice were subjected to DMBA/TPA-induced skin carcinogenesis as described in methods. Skin samples were collected, fixed and processed for IHC staining of proliferating and apoptotic nuclei as described in methods. Quantitative digital pathology analyses of scanned slides were performed. Statistical analyses were performed with GraphPad Prism 6 software. Results are shown as mean ± 95% confidence intervals. The data were analysed by standard unpaired two-tailed T-tests. (a) Proliferating nuclei were stained by IHC with rat anti-Ki67 antibody, and the % of proliferating nuclei determined (WT: n = 5; R-Ras KO: n = 5; 3 independent measurements/animal). The WT mice have significantly more proliferating cells in both the dermis and the epidermis following DMBA/TPA treatment (standard unpaired two-tailed T-tests). The same phenomenon did not take place in R-Ras KO mice epidermis after DMBA/TPA treatment. Interestingly, prior to treatment the R-Ras KO mice had significantly fewer proliferating nuclei in their normal dermis than the WT animals (P < 0.0001, ****). (b) Representative Ki67 staining for proliferating cells in DMBA/TPA-treated skin is shown for the WT and R-Ras KO animals. Black bar in images represents 200 μm. (c) Immunohistochemical TUNEL staining for apoptotic nuclei was performed. TUNEL morphometry measurements of % epidermal and dermal apoptosis were taken from the untreated and DMBA/TPA-treated groups (WT: n = 5; R-Ras KO: n = 5; 4 independent measurements/animal). A couple of single outlying data points were identified by Grubbs’ test and excluded. Both the WT and the R-Ras KO mice have significantly fewer apoptotic cells in their normal epidermis after 19 weeks of DMBA/TPA treatment (P = 0.0097, ** and P < 0.0001, **** respectively). Untreated R-Ras KO mice have significantly more apoptotic cells in their normal dermis prior to DMBA/TPA treatment (P = 0.0003, ***), and significantly more apoptotic dermal cells than the WT mice either before (P = 0.0007, ***) or after (P = 0.0014, **) treatment. (d) Representative photograph of TUNEL staining in untreated WT and untreated R-Ras KO skin. Nuclei are stained turquoise, and apoptotic nuclei brown/black. The black bar in images represents 100 μm.
Figure 5
Figure 5. The inflammatory response to DMBA/TPA treatment is attenuated in the skin of R-Ras KO mice.
WT and R-Ras KO mice were subjected to DMBA/TPA-induced skin carcinogenesis as described in methods. Skin samples were collected from untreated mice and from mice sacrificed at 3 h and 48 h after the second TPA application, and after 19 weeks of treatment (twice weekly). The skin samples were processed either for IHC or qPCR analysis as described in methods. Results are shown as mean ± 95% confidence intervals. Data were analysed by normality tests and unpaired two-tailed T-tests, if needed with Welch’s correction (GraphPad Prism 6). (a) qPCR analysis of relative gene expression of the cytokines IL-1α, IL-6 and IL-17A in untreated and treated WT and R-Ras KO skin. R-Ras KO mice show 3 h post 2nd TPA treatment significantly lower gene expression for IL-1α (P = 0.0176, *) and IL-6 (P = 0.0125, *) than WT mice. IL-17A gene expression is significantly reduced in R-Ras KO animals at 3 h post 2nd TPA treatment (P = 0.0322, *) and after 19 weeks of TPA treatment (P = 0.0189, *). These data are normally distributed. Animal numbers: untreated: n = 4 per strain, 3 h post 2nd TPA treatment: n = 8 per strain, 48 h post 2nd TPA treatment: n = 9 per strain, 19 weeks: n = 8 for WT and n = 6 for R-Ras KO. ND means not detected. (b) Skin sections were IHC stained for markers for dermal macrophages (F4/80), dermal neutrophils (neutrophil elastase), or epidermal and dermal T-cells (CD3), as described in methods (WT n = 6; R-Ras KO n = 6). Quantitative analysis of scanned slides were performed as described in methods (3 independent measurements per skin section, two skin sections per animal, excluding tumours). Data is expressed as % of total nuclei. Neutrophil and T-cell data are mostly normally distributed, but all becomes normally distributed if Log10 transformed. Macrophage data is normally distributed. T-tests confirmed highly significant differences between the WT and R-Ras KO mice as indicated (P < 0.0001, ****). (c) Representative photographs of leukocyte staining in WT and R-Ras KO skin. Nuclei are stained blue, and leukocytes brown. The black bar in images represents 300 μm.

Similar articles

Cited by

References

    1. Lowe D. G. et al. Structure of the human and murine R-ras genes, novel genes closely related to ras proto-oncogenes. Cell 48, 137–146 (1987). - PubMed
    1. Sawada J. & Komatsu M. Normalization of tumor vasculature by R-Ras. Cell. Cycle 11, 4285–4286 (2012). - PMC - PubMed
    1. Lowe D. G. & Goeddel D. V. Heterologous expression and characterization of the human R-ras gene product. Mol. Cell. Biol. 7, 2845–2856 (1987). - PMC - PubMed
    1. Pylayeva-Gupta Y., Grabocka E. & Bar-Sagi D. RAS oncogenes: weaving a tumorigenic web. Nat. Rev. Cancer. 11, 761–774 (2011). - PMC - PubMed
    1. Song J., Zheng B., Bu X., Fei Y. & Shi S. Negative association of R-Ras activation and breast cancer development. Oncol. Rep. 31, 2776–2784 (2014). - PubMed

Publication types