. 2015 Jul 2;47(1):55.
doi: 10.1186/s12711-015-0135-3.

Potential of promotion of alleles by genome editing to improve quantitative traits in livestock breeding programs

Affiliations

Potential of promotion of alleles by genome editing to improve quantitative traits in livestock breeding programs

Janez Jenko et al. Genet Sel Evol. .

Erratum in

Abstract

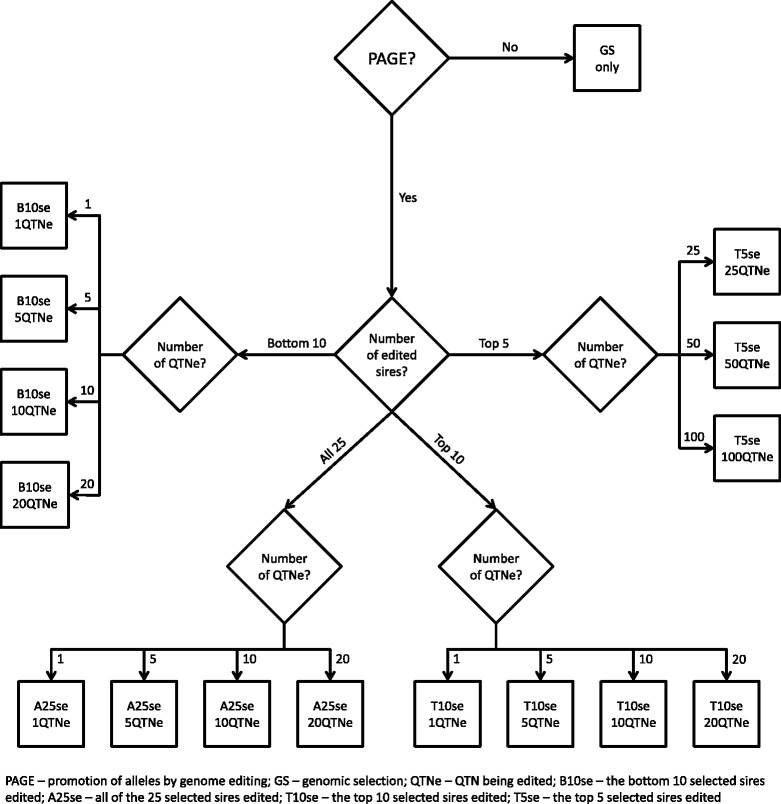
Background: Genome editing (GE) is a method that enables specific nucleotides in the genome of an individual to be changed. To date, use of GE in livestock has focussed on simple traits that are controlled by a few quantitative trait nucleotides (QTN) with large effects. The aim of this study was to evaluate the potential of GE to improve quantitative traits that are controlled by many QTN, referred to here as promotion of alleles by genome editing (PAGE).

Methods: Multiple scenarios were simulated to test alternative PAGE strategies for a quantitative trait. They differed in (i) the number of edits per sire (0 to 100), (ii) the number of edits per generation (0 to 500), and (iii) the extent of use of PAGE (i.e. editing all sires or only a proportion of them). The base line scenario involved selecting individuals on true breeding values (i.e., genomic selection only (GS only)-genomic selection with perfect accuracy) for several generations. Alternative scenarios complemented this base line scenario with PAGE (GS + PAGE). The effect of different PAGE strategies was quantified by comparing response to selection, changes in allele frequencies, the number of distinct QTN edited, the sum of absolute effects of the edited QTN per generation, and inbreeding.

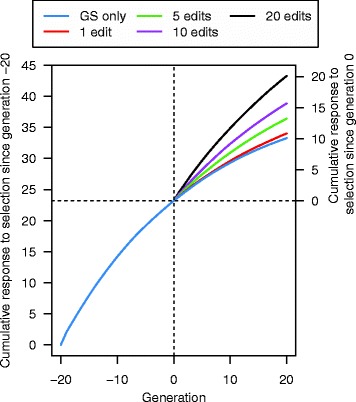
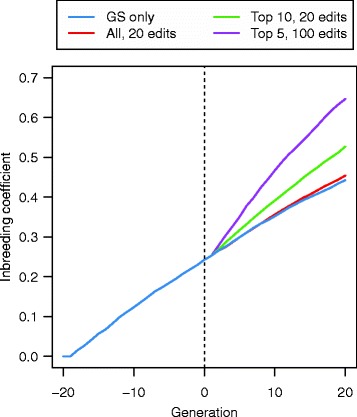
Results: Response to selection after 20 generations was between 1.08 and 4.12 times higher with GS + PAGE than with GS only. Increases in response to selection were larger with more edits per sire and more sires edited. When the total resources for PAGE were limited, editing a few sires for many QTN resulted in greater response to selection and inbreeding compared to editing many sires for a few QTN. Between the scenarios GS only and GS + PAGE, there was little difference in the average change in QTN allele frequencies, but there was a major difference for the QTN with the largest effects. The sum of the effects of the edited QTN decreased across generations.

Conclusions: This study showed that PAGE has great potential for application in livestock breeding programs, but inbreeding needs to be managed.


Figures

Fig. 1
Fig. 1
Overall design of the simulation
Fig. 2
Fig. 2
Simulated scenarios for promotion of alleles by genome editing
Fig. 3
Fig. 3
Cumulative response to selection across 21 generations of recent historical breeding based on genomic selection only (GS only) and 20 generations of future breeding based on GS only or genomic selection plus the promotion of alleles by genome editing (GS + PAGE) when different numbers of QTN (1, 5, 10, or 20) were edited for all 25 sires
Fig. 4
Fig. 4
Cumulative response to selection across 21 generations of recent historical breeding based on genomic selection only (GS only) and 20 generations of future breeding based on GS only or genomic selection plus the promotion of alleles by genome editing (GS + PAGE) when 20 QTN were edited for all 25 sires or top 10 sires
Fig. 5
Fig. 5
Response to selection between pairs of subsequent generations across 21 generations of recent historical breeding based on genomic selection only (GS only) and 20 generations of future breeding based on GS only or genomic selection plus the promotion of alleles by genome editing (GS + PAGE) when different numbers of QTN (1, 5, 10, or 20) were edited for all 25 sires
Fig. 6
Fig. 6
Cumulative response to selection across 21 generations of recent historical breeding based on genomic selection only (GS only) and 20 generations of future breeding based on GS only or genomic selection plus the promotion of alleles by genome editing (GS + PAGE) when a 125, b 250, or c 500 edits per generation were distributed across all of the 25 or the top 5 selected sires
Fig. 7
Fig. 7
Mean frequency of the favourable alleles at all QTN that segregated at generation 0 or at the 20 QTN with the largest effect that segregated at generation 0 across 21 generations of recent historical breeding based on genomic selection only (GS only) and 20 generations of future breeding based on GS only or genomic selection plus the promotion of alleles by genome editing (GS + PAGE) when 20 QTN were edited in all of the 25 selected sires
Fig. 8
Fig. 8
Genic variance due to (a) all the QTN that segregated at generation 0 or (b) the 20 QTN with the largest effect that segregated at generation 0 across 21 generations of recent historical breeding based on genomic selection only (GS only) and 20 generations of future breeding based on GS only or genomic selection plus the promotion of alleles by genome editing (GS + PAGE) when 20 edits were performed in all of the 25 selected sires
Fig. 9
Fig. 9
Number of distinct QTN being edited (diagonal) and the number of distinct QTN being edited that were in common between pairs of generations (off-diagonal) across the 20 future generations of breeding based on the genomic selection plus the promotion of alleles by genome editing (GS + PAGE) when a 1, b 5, c 10, or d 20 edits were performed in all of the 25 selected sires
Fig. 10
Fig. 10
The sum of the absolute effects of the edited QTN across the 20 future generations of breeding based on the genomic selection plus the promotion of alleles by genome editing (GS + PAGE) when 1, 5, 10, or 20 QTN were edited in all of the 25 selected sires
Fig. 11
Fig. 11
Inbreeding coefficient across 21 generations of recent historical breeding based on genomic selection only (GS only) and 20 generations of future breeding based on GS only or genomic selection plus the promotion of alleles by genome editing (GS + PAGE) when 20 edits were performed in all of 25 or the top 10 sires or 100 edits were performed on the top five sires

References

    1. Manolio TA, Collins FS, Cox NJ, Goldstein DB, Hindorff LA, Hunter DJ, et al. Finding the missing heritability of complex diseases. Nature. 2009;461:747–53. doi: 10.1038/nature08494. - DOI - PMC - PubMed
    1. Haley CS, Visscher PM. Strategies to utilize marker-quantitative trait loci associations. J Dairy Sci. 1998;81:85–97. doi: 10.3168/jds.S0022-0302(98)70157-2. - DOI - PubMed
    1. Meuwissen THE, Hayes BJ, Goddard ME. Prediction of total genetic value using genome-wide dense marker maps. Genetics. 2001;157:1819–29. - PMC - PubMed
    1. Cleveland MA, Hickey JM. Practical implementation of cost-effective genomic selection in commercial pig breeding using imputation. J Anim Sci. 2013;91:3583–92. doi: 10.2527/jas.2013-6270. - DOI - PubMed
    1. VanRaden PM, Van Tassell CP, Wiggans GR, Sonstegard TS, Schnabel RD, Taylor JF, et al. Invited review: reliability of genomic predictions for North American Holstein bulls. J Dairy Sci. 2009;92:16–24. doi: 10.3168/jds.2008-1514. - DOI - PubMed

Publication types