. 2015 Jul;42(7):4127-36.
doi: 10.1118/1.4922135.

Optical cone beam tomography of Cherenkov-mediated signals for fast 3D dosimetry of x-ray photon beams in water

Affiliations

Optical cone beam tomography of Cherenkov-mediated signals for fast 3D dosimetry of x-ray photon beams in water

Adam K Glaser et al. Med Phys. 2015 Jul.

Abstract

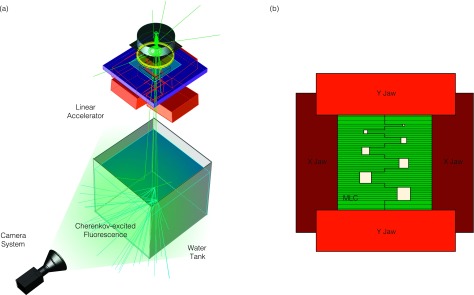
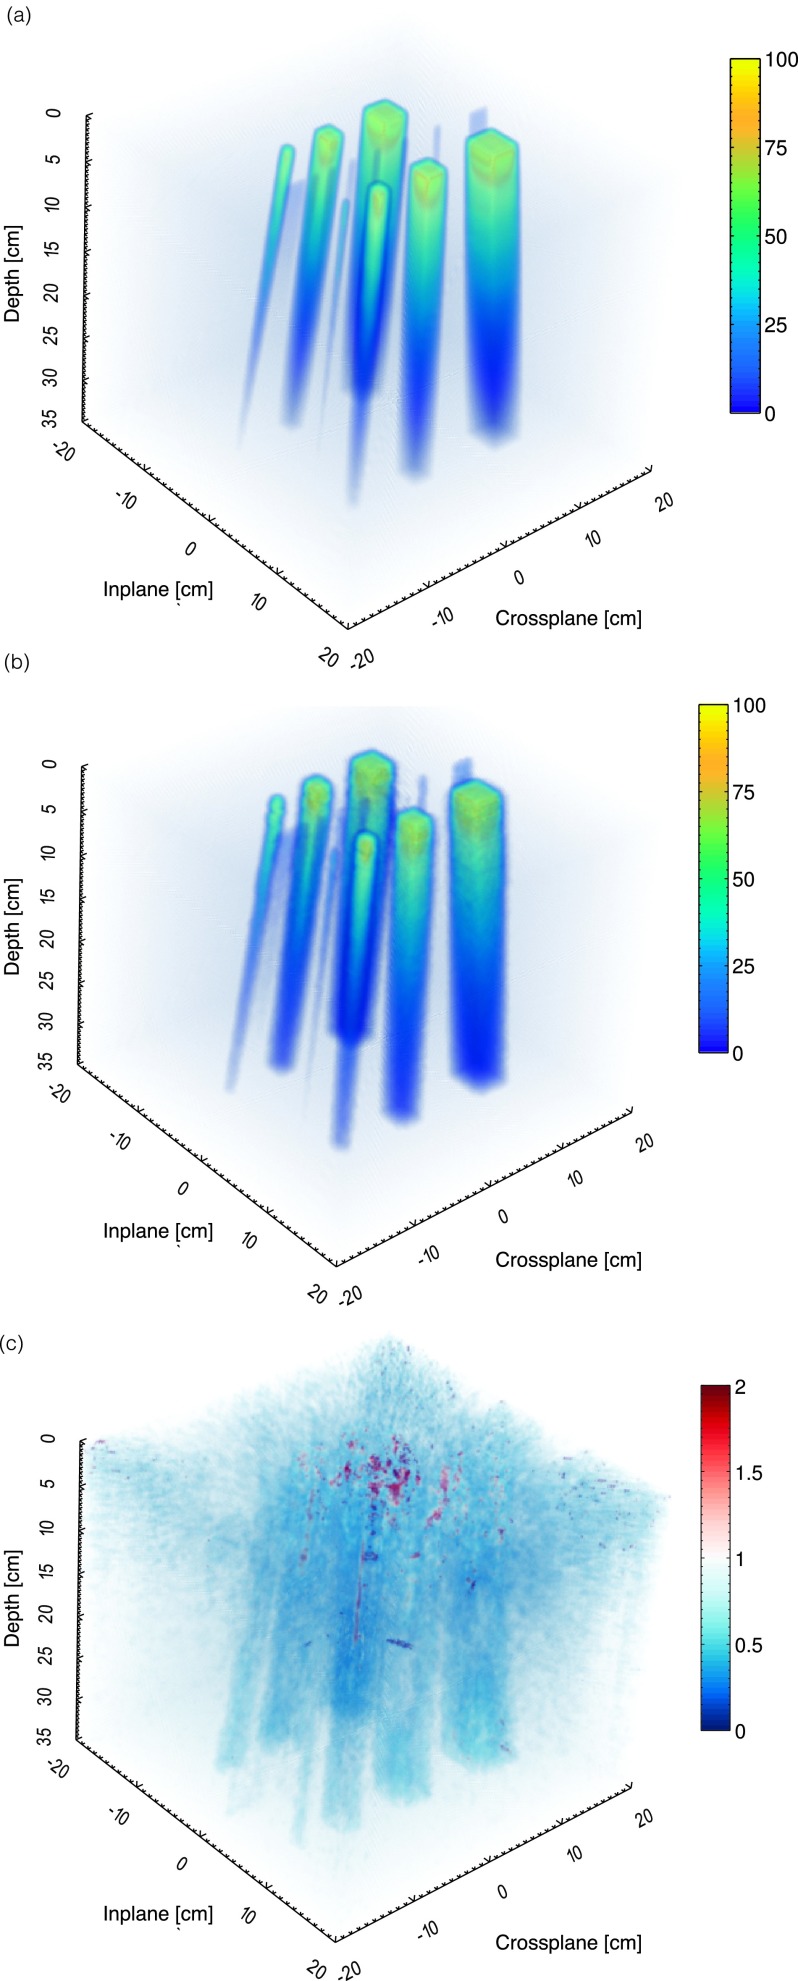
Purpose: To test the use of a three-dimensional (3D) optical cone beam computed tomography reconstruction algorithm, for estimation of the imparted 3D dose distribution from megavoltage photon beams in a water tank for quality assurance, by imaging the induced Cherenkov-excited fluorescence (CEF).

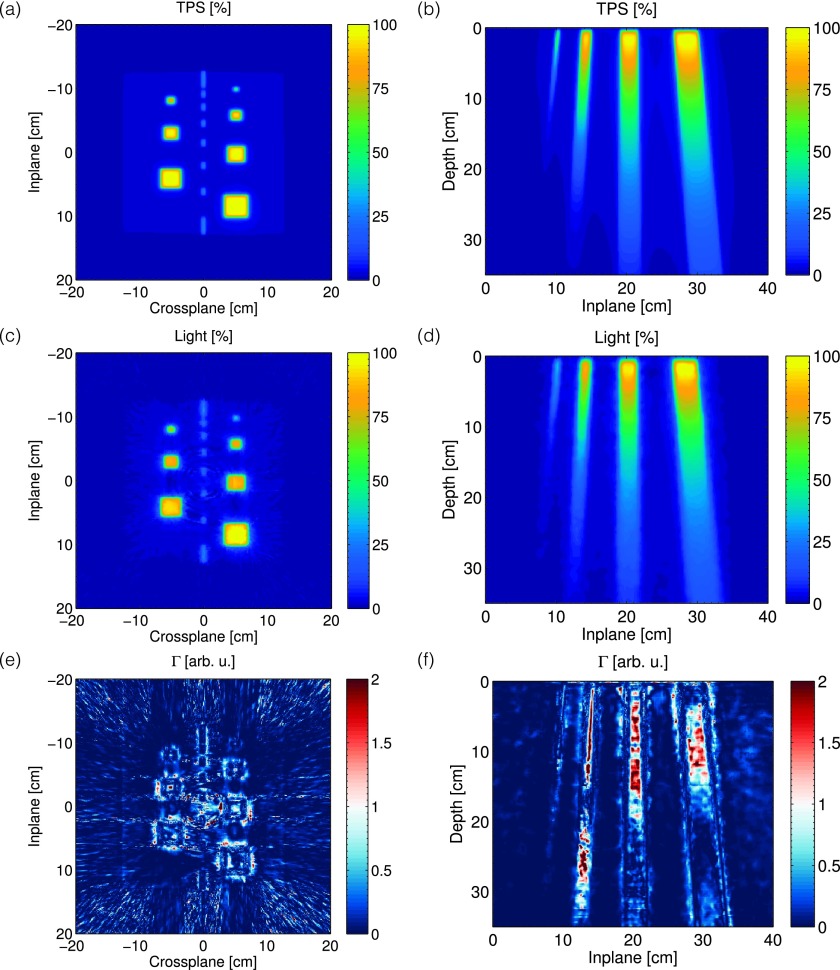
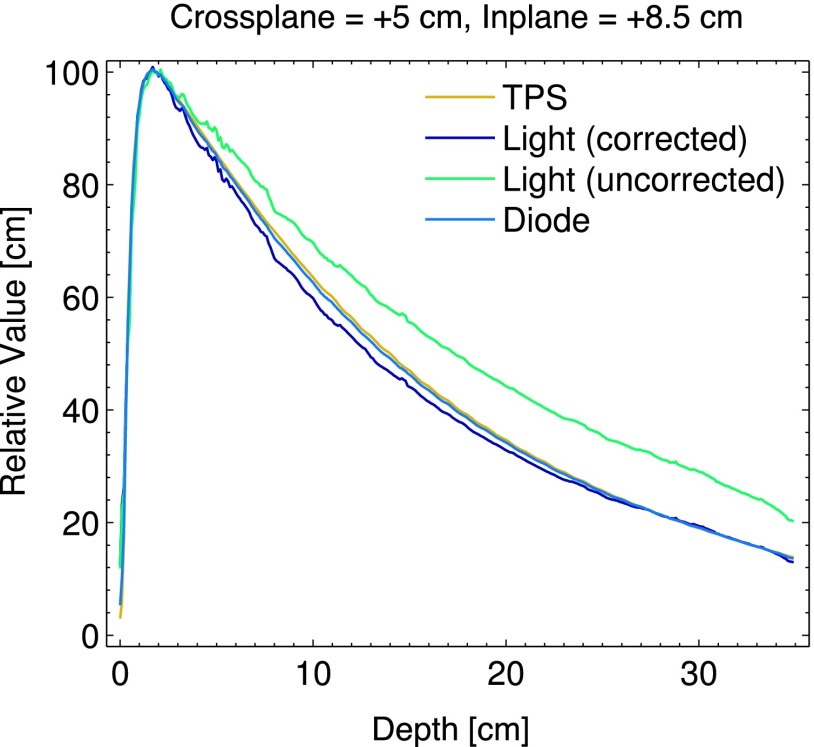
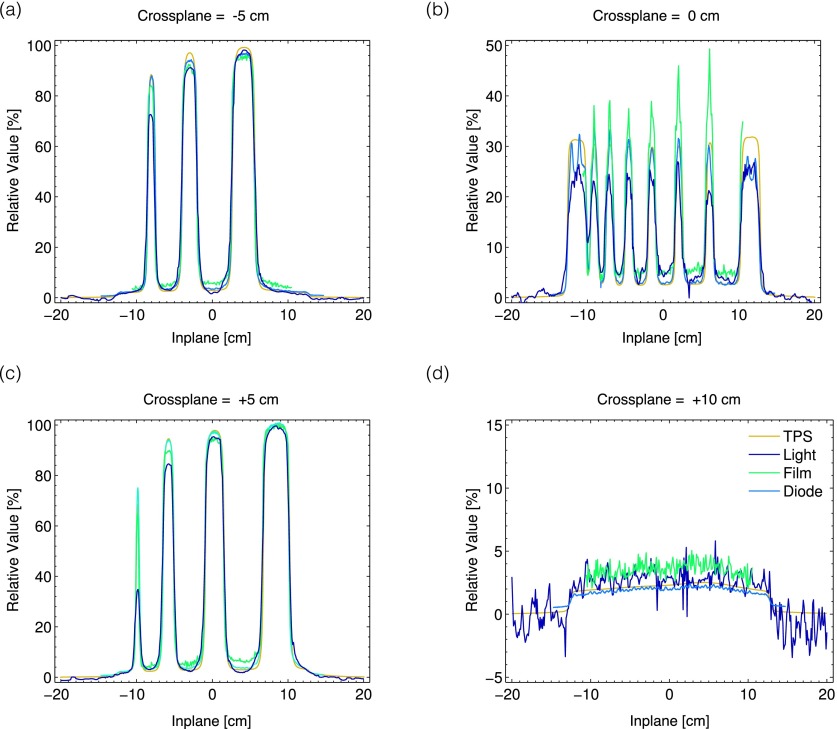
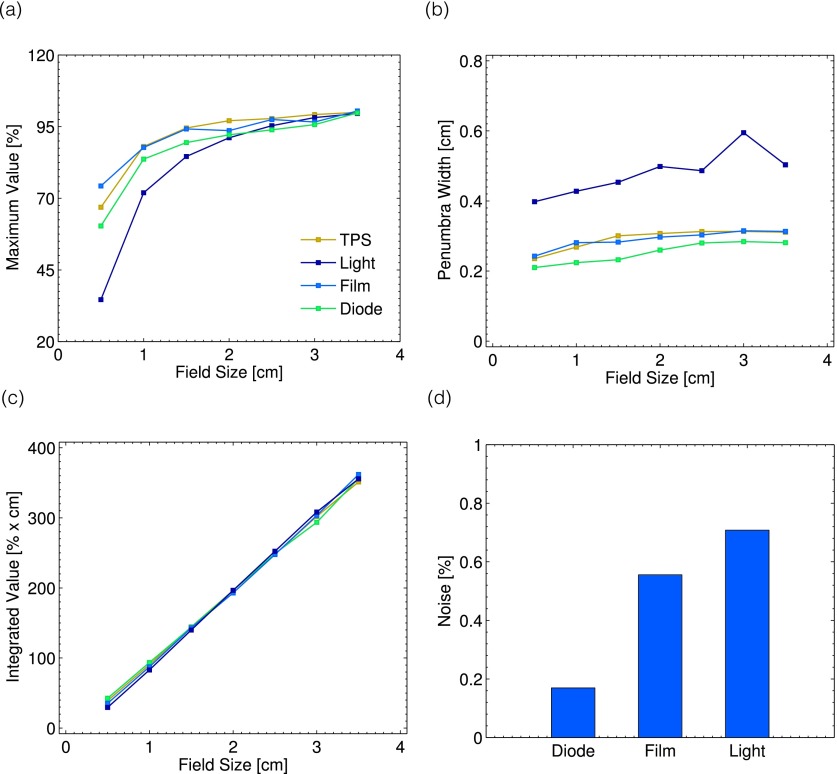
Methods: An intensified charge-coupled device coupled to a standard nontelecentric camera lens was used to tomographically acquire two-dimensional (2D) projection images of CEF from a complex multileaf collimator (MLC) shaped 6 MV linear accelerator x-ray photon beam operating at a dose rate of 600 MU/min. The resulting projections were used to reconstruct the 3D CEF light distribution, a potential surrogate of imparted dose, using a Feldkamp-Davis-Kress cone beam back reconstruction algorithm. Finally, the reconstructed light distributions were compared to the expected dose values from one-dimensional diode scans, 2D film measurements, and the 3D distribution generated from the clinical Varian ECLIPSE treatment planning system using a gamma index analysis. A Monte Carlo derived correction was applied to the Cherenkov reconstructions to account for beam hardening artifacts.

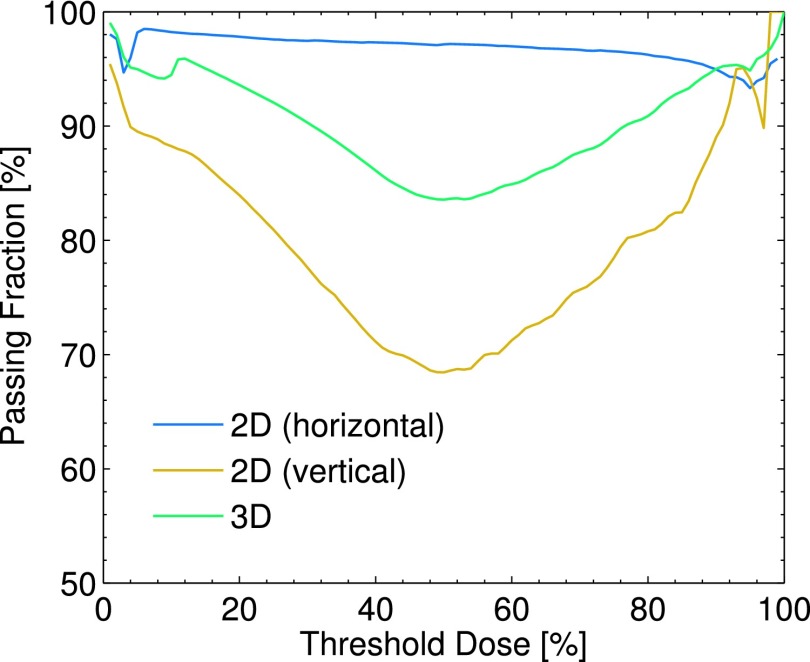
Results: 3D light volumes were successfully reconstructed over a 400 × 400 × 350 mm(3) volume at a resolution of 1 mm. The Cherenkov reconstructions showed agreement with all comparative methods and were also able to recover both inter- and intra-MLC leaf leakage. Based upon a 3%/3 mm criterion, the experimental Cherenkov light measurements showed an 83%-99% pass fraction depending on the chosen threshold dose.

Conclusions: The results from this study demonstrate the use of optical cone beam computed tomography using CEF for the profiling of the imparted dose distribution from large area megavoltage photon beams in water.


Figures

FIG. 1.
FIG. 1.
In (a), the experimental setup is shown. The camera is placed perpendicular to the radiation beam direction and images the Cherenkov-excited fluorescence through the sidewall of the water tank. In (b), the jaw and MLC configuration that create the field aperture are shown.
FIG. 2.
FIG. 2.
In (a), the cone beam geometry is shown. The camera captures a two-dimensional (2D) projection image of the induced 3D light volume. In the context of conventional x-ray cone beam tomography geometry, this is equivalent to a detector plate placed at the focal plane of the image system, in which the detector pixel size is the resolution of the imaging pixels at the focal plane. In addition, in this configuration, the source to axis distance (SAD) is equivalent to the source to detector distance (SDD). In (b) and (c), reference images are shown, where the center of the imaging chip (1024 × 1024 pixels) is aligned with the isocenter of the Linac, and a reference resolution checkerboard object is imaged to determine the spatial resolution.
FIG. 3.
FIG. 3.
In (a) and (b), the stray radiation background subtracted image, as well as the flat field calibration image for the imaging system used, is shown.
FIG. 4.
FIG. 4.
(a) The processed projection image of the Cherenkov-excited fluorescence at 90° is shown from the entire projection image stack. In (b), a horizontal line profile through the projection image is shown (enhanced online)
FIG. 5.
FIG. 5.
The beam hardening correction factor is displayed as a function of depth, z, and radial position, r, within the water tank.
FIG. 6.
FIG. 6.
In (a)–(c), the 3D dose volume from the TPS, Cherenkov light reconstruction, and gamma index map for a 3%/3 mm criterion is shown.
FIG. 7.
FIG. 7.
In [(a) and (b)] and [(c) and (d)], the 2D horizontal and vertical cross sections of the expected dose from the TPS, and the Cherenkov light reconstruction at a depth of z = 1.5 cm and off axis position of x = + 5 cm, are shown. The corresponding gamma index maps for a 3%/3 mm criterion are shown in (e) and (f).
FIG. 8.
FIG. 8.
The passing fraction as a function of threshold dose is plotted for the 2D horizontal and vertical gamma index maps shown in [Figs. 7(e) and 7(f)], as well as the entire 3D volume shown in Fig. 6(c).
FIG. 9.
FIG. 9.
The PDD for the largest field size at off axis positions of x = + 5 cm, y = + 8.5 cm is plotted for the TPS, beam hardening corrected and uncorrected Cherenkov light reconstructions, and diode.
FIG. 10.
FIG. 10.
In (a)–(d), the results of the 1D measurements from the TPS, Cherenkov light, film, and diode are plotted at off axis positions of x = − 5, 0, +5, and +10 cm. All measurements are for a depth of z = 1.5 cm in the water tank.
FIG. 11.
FIG. 11.
The metrics obtained from the 1D profiles are shown. In (a), the maximum value for each of the seven field sizes is plotted for all measurement techniques. The corresponding penumbra for each method as a function of field size is plotted in (b). In (c) and (d), the integrated area under the curve for each field size and measurement noise are shown.

References

    1. Guillot M., Gingras L., Archambault L., Beddar S., and Beaulieu L., “Toward 3D dosimetry of intensity modulated radiation therapy treatments with plastic scintillation detectors,” J. Phys.: Conf. Ser. 250, 012006 (2010).10.1088/1742-6596/250/1/012006 - DOI
    1. Kirov A. S., Piao J. Z., Mathur N., Miller T. R., Devic S., Trichter S., Zaider M., LoSasso T., and Soares C., “A test of the 3D scintillation dosimetry method for a Ru-106 eye plaque applicator,” Med. Phys. 32, 2002 (2005).10.1118/1.1997957 - DOI - PubMed
    1. Kirov A. S., Piao J. Z., Mathur N. K., Miller T. R., Devic S., Trichter S., Zaider M., Soares C. G., and LoSasso T., “The three-dimensional scintillation dosimetry method: Test for a 106Ru eye plaque applicator,” Phys. Med. Biol. 50, 3063–3081 (2005).10.1088/0031-9155/50/13/007 - DOI - PubMed
    1. Kirov A. S., Shrinivas S., Hurlbut C., Dempsey J. F., Binns W. R., and Poblete J. L., “New water equivalent liquid scintillation solutions for 3D dosimetry,” Med. Phys. 27, 1156–1164 (2000).10.1118/1.598993 - DOI - PubMed
    1. Kroll F., Pawelke J., and Karsch L., “Preliminary investigations on the determination of three-dimensional dose distributions using scintillator blocks and optical tomography,” Med. Phys. 40, 082104 (12pp.) (2013).10.1118/1.4813898 - DOI - PubMed

Publication types