

Experimental depth dose curves of a 67.5 MeV proton beam for benchmarking and validation of Monte Carlo simulation
- PMID: 26133619
- PMCID: PMC4474955
- DOI: 10.1118/1.4922501
Experimental depth dose curves of a 67.5 MeV proton beam for benchmarking and validation of Monte Carlo simulation
Abstract
Purpose: To measure depth dose curves for a 67.5 ± 0.1 MeV proton beam for benchmarking and validation of Monte Carlo simulation.
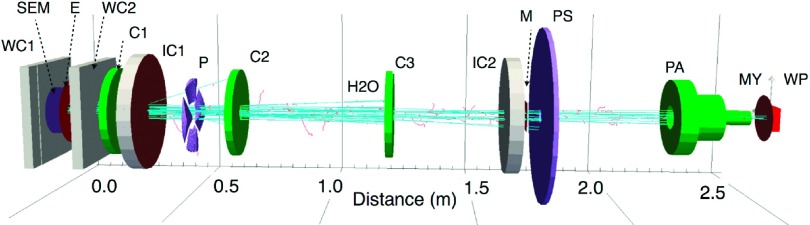
Methods: Depth dose curves were measured in 2 beam lines. Protons in the raw beam line traversed a Ta scattering foil, 0.1016 or 0.381 mm thick, a secondary emission monitor comprised of thin Al foils, and a thin Kapton exit window. The beam energy and peak width and the composition and density of material traversed by the beam were known with sufficient accuracy to permit benchmark quality measurements. Diodes for charged particle dosimetry from two different manufacturers were used to scan the depth dose curves with 0.003 mm depth reproducibility in a water tank placed 300 mm from the exit window. Depth in water was determined with an uncertainty of 0.15 mm, including the uncertainty in the water equivalent depth of the sensitive volume of the detector. Parallel-plate chambers were used to verify the accuracy of the shape of the Bragg peak and the peak-to-plateau ratio measured with the diodes. The uncertainty in the measured peak-to-plateau ratio was 4%. Depth dose curves were also measured with a diode for a Bragg curve and treatment beam spread out Bragg peak (SOBP) on the beam line used for eye treatment. The measurements were compared to Monte Carlo simulation done with geant4 using topas.
Results: The 80% dose at the distal side of the Bragg peak for the thinner foil was at 37.47 ± 0.11 mm (average of measurement with diodes from two different manufacturers), compared to the simulated value of 37.20 mm. The 80% dose for the thicker foil was at 35.08 ± 0.15 mm, compared to the simulated value of 34.90 mm. The measured peak-to-plateau ratio was within one standard deviation experimental uncertainty of the simulated result for the thinnest foil and two standard deviations for the thickest foil. It was necessary to include the collimation in the simulation, which had a more pronounced effect on the peak-to-plateau ratio for the thicker foil. The treatment beam, being unfocussed, had a broader Bragg peak than the raw beam. A 1.3 ± 0.1 MeV FWHM peak width in the energy distribution was used in the simulation to match the Bragg peak width. An additional 1.3-2.24 mm of water in the water column was required over the nominal values to match the measured depth penetration.
Conclusions: The proton Bragg curve measured for the 0.1016 mm thick Ta foil provided the most accurate benchmark, having a low contribution of proton scatter from upstream of the water tank. The accuracy was 0.15% in measured beam energy and 0.3% in measured depth penetration at the Bragg peak. The depth of the distal edge of the Bragg peak in the simulation fell short of measurement, suggesting that the mean ionization potential of water is 2-5 eV higher than the 78 eV used in the stopping power calculation for the simulation. The eye treatment beam line depth dose curves provide validation of Monte Carlo simulation of a Bragg curve and SOBP with 4%/2 mm accuracy.
Figures


Similar articles
-
The effect of voxelization in Monte Carlo simulation to validate Bragg peak characteristics for a pencil proton beam.Rep Pract Oncol Radiother. 2023 Apr 6;28(1):102-113. doi: 10.5603/RPOR.a2023.0007. eCollection 2023. Rep Pract Oncol Radiother. 2023. PMID: 37122904 Free PMC article. Review.
-
Spread-out Bragg peak proton FLASH irradiation using a clinical synchrocyclotron: Proof of concept and ion chamber characterization.Med Phys. 2021 Aug;48(8):4472-4484. doi: 10.1002/mp.15021. Epub 2021 Jul 11. Med Phys. 2021. PMID: 34077590
-
Benchmarking a GATE/Geant4 Monte Carlo model for proton beams in magnetic fields.Med Phys. 2020 Jan;47(1):223-233. doi: 10.1002/mp.13883. Epub 2019 Nov 13. Med Phys. 2020. PMID: 31661559 Free PMC article.
-
Experimental validation of the TOPAS Monte Carlo system for passive scattering proton therapy.Med Phys. 2013 Dec;40(12):121719. doi: 10.1118/1.4828781. Med Phys. 2013. PMID: 24320505 Free PMC article.
-
Beam characterisation studies of the 62 MeV proton therapy beamline at the Clatterbridge Cancer Centre.Phys Med. 2020 Sep;77:108-120. doi: 10.1016/j.ejmp.2020.08.002. Epub 2020 Aug 18. Phys Med. 2020. PMID: 32823210 Review.
Cited by
-
The effect of voxelization in Monte Carlo simulation to validate Bragg peak characteristics for a pencil proton beam.Rep Pract Oncol Radiother. 2023 Apr 6;28(1):102-113. doi: 10.5603/RPOR.a2023.0007. eCollection 2023. Rep Pract Oncol Radiother. 2023. PMID: 37122904 Free PMC article. Review.
-
A Millimeter-scale Single Charged Particle Dosimeter for Cancer Radiotherapy.IEEE J Solid-State Circuits. 2020 Nov;55(11):2947-2958. doi: 10.1109/jssc.2020.3024231. Epub 2020 Sep 23. IEEE J Solid-State Circuits. 2020. PMID: 33281206 Free PMC article.
-
Comparing Geant4 physics models for proton-induced dose deposition and radiolysis enhancement from a gold nanoparticle.Sci Rep. 2022 Feb 2;12(1):1779. doi: 10.1038/s41598-022-05748-0. Sci Rep. 2022. PMID: 35110613 Free PMC article.
-
Report on G4-Med, a Geant4 benchmarking system for medical physics applications developed by the Geant4 Medical Simulation Benchmarking Group.Med Phys. 2021 Jan;48(1):19-56. doi: 10.1002/mp.14226. Epub 2020 Dec 12. Med Phys. 2021. PMID: 32392626 Free PMC article.
-
The TOPAS tool for particle simulation, a Monte Carlo simulation tool for physics, biology and clinical research.Phys Med. 2020 Apr;72:114-121. doi: 10.1016/j.ejmp.2020.03.019. Epub 2020 Apr 3. Phys Med. 2020. PMID: 32247964 Free PMC article.
References
-
- See http://www.ptcog.ch for the Particle Therapy Co-Operative Group (PTCOG).
-
- Chetty I. J., Curran B., Cygler J. E., DeMarco J. J., Ezzell G., Faddegon B. A., Kawrakow I., Keall P. J., Liu H., Ma C., Rogers D. W. O., Seuntjens J., Sheikh-Bagheri D., and Siebers J. V., “Report of the AAPM Task Group No. 105: Issues associated with clinical implementation of Monte Carlo-based photon and electron external beam treatment planning,” Med. Phys. 34, 4818–4853 (2007).10.1118/1.2795842 - DOI - PubMed
Publication types
MeSH terms
Substances
Grants and funding
LinkOut - more resources
Full Text Sources
Other Literature Sources
