

Assessment of performance and reproducibility of applying a content-based image retrieval scheme for classification of breast lesions
- PMID: 26133622
- PMCID: PMC4474953
- DOI: 10.1118/1.4922681
Assessment of performance and reproducibility of applying a content-based image retrieval scheme for classification of breast lesions
Abstract
Purpose: To develop a new computer-aided diagnosis (CAD) scheme using a content-based image retrieval (CBIR) approach for classification between the malignant and benign breast lesions depicted on the digital mammograms and assess CAD performance and reproducibility.
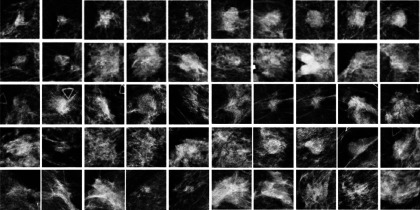
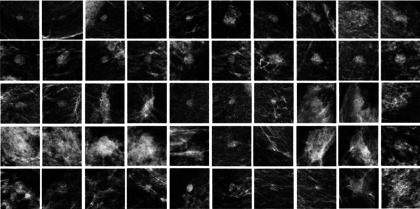
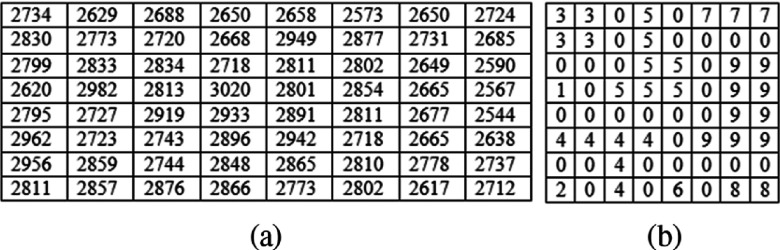
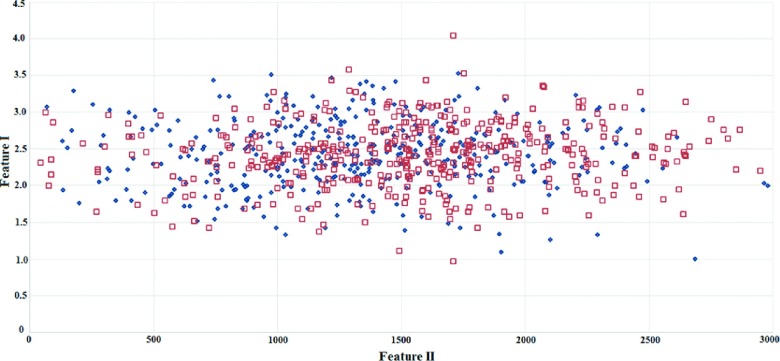
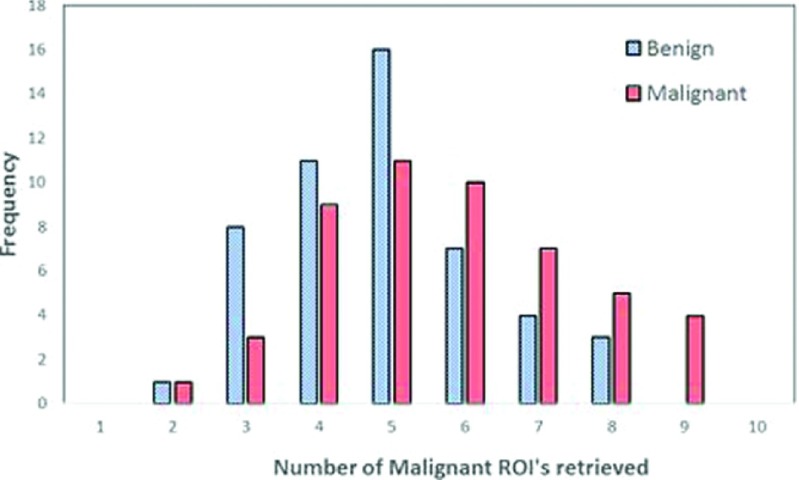
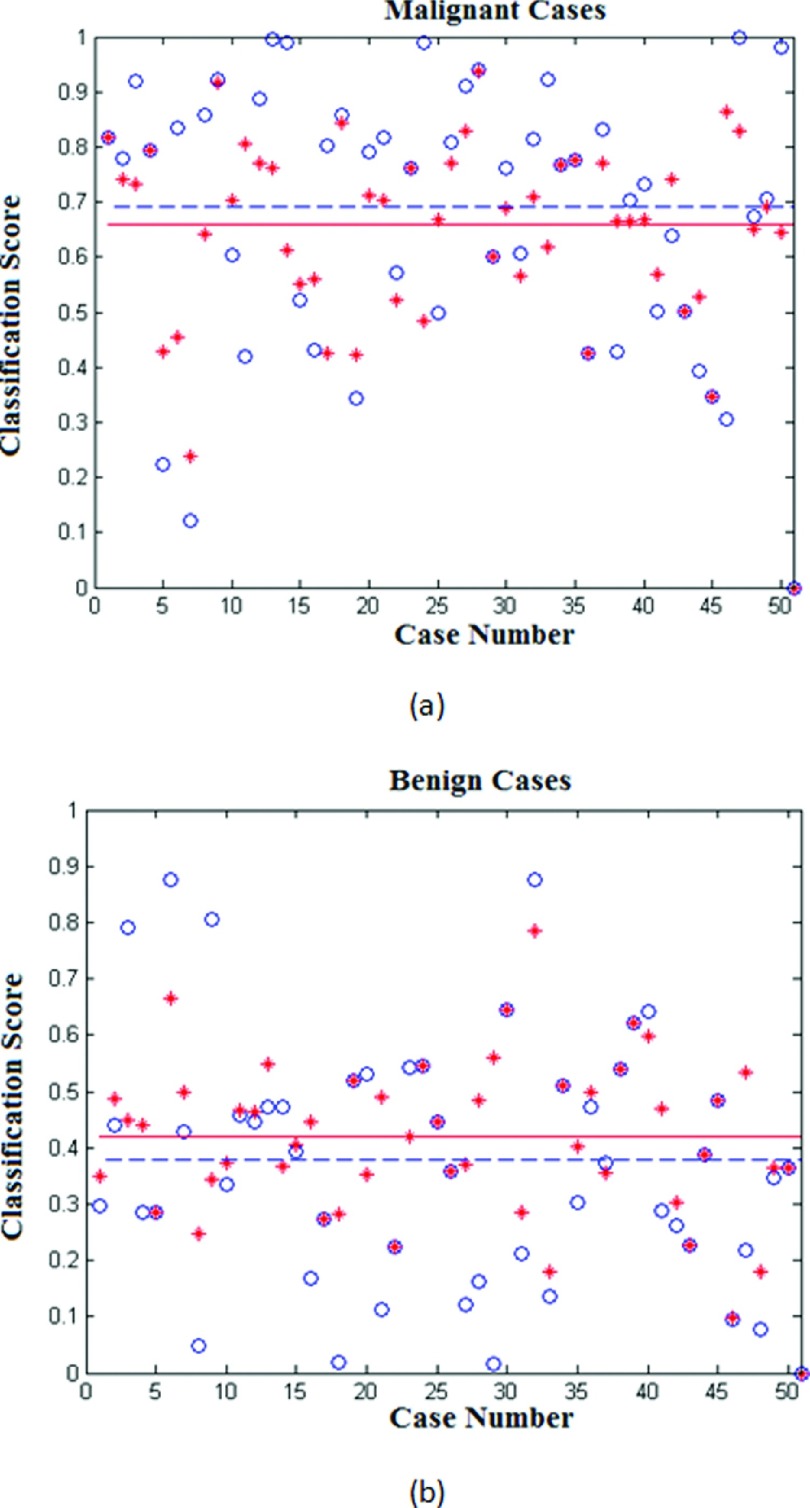
Methods: An image dataset including 820 regions of interest (ROIs) was used. Among them, 431 ROIs depict malignant lesions and 389 depict benign lesions. After applying an image preprocessing process to define the lesion center, two image features were computed from each ROI. The first feature is an average pixel value of a mapped region generated using a watershed algorithm. The second feature is an average pixel value difference between a ROI's center region and the rest of the image. A two-step CBIR approach uses these two features sequentially to search for ten most similar reference ROIs for each queried ROI. A similarity based classification score was then computed to predict the likelihood of the queried ROI depicting a malignant lesion. To assess the reproducibility of the CAD scheme, we selected another independent testing dataset of 100 ROIs. For each ROI in the testing dataset, we added four randomly queried lesion center pixels and examined the variation of the classification scores.
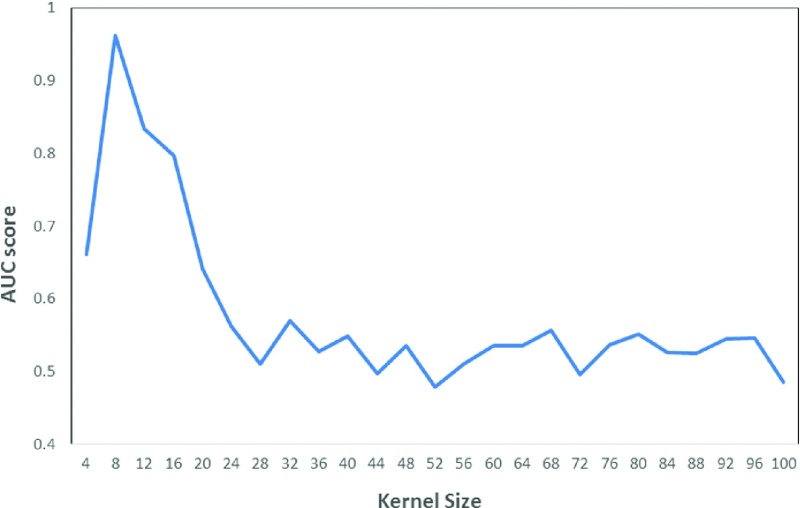
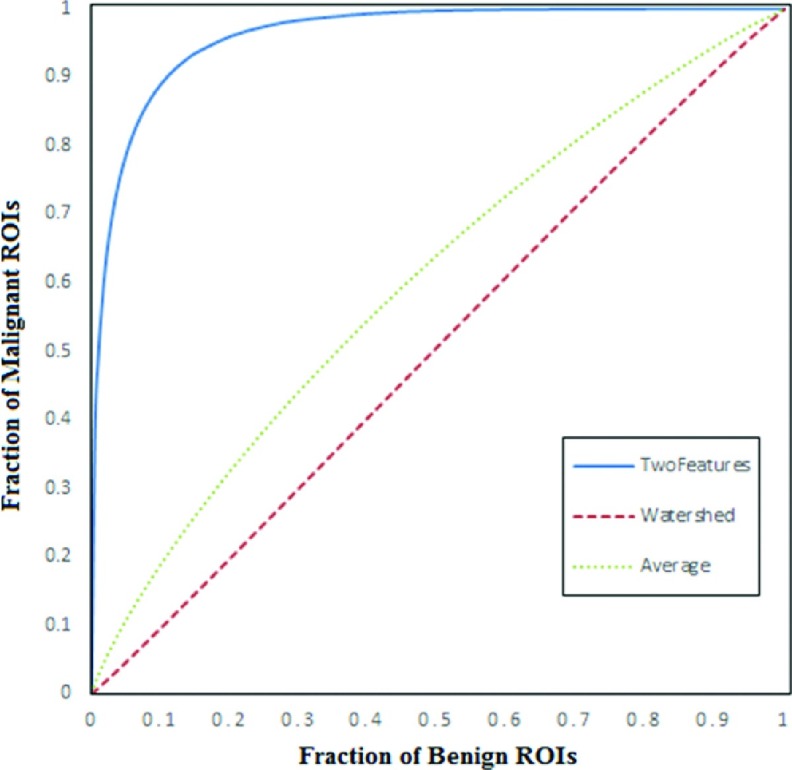
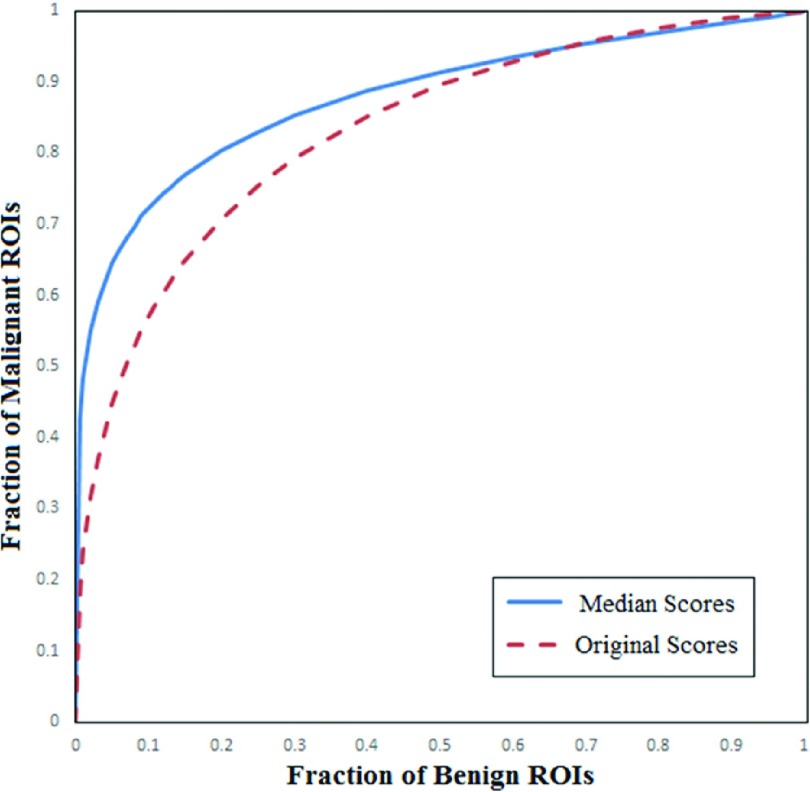
Results: The area under the ROC curve (AUC) = 0.962 ± 0.006 was obtained when applying a leave-one-out validation method to 820 ROIs. Using the independent testing dataset, the initial AUC value was 0.832 ± 0.040, and using the median classification score of each ROI with five queried seeds, AUC value increased to 0.878 ± 0.035.
Conclusions: The authors demonstrated that (1) a simple and efficient CBIR scheme using two lesion density distribution related features achieved high performance in classifying breast lesions without actual lesion segmentation and (2) similar to the conventional CAD schemes using global optimization approaches, improving reproducibility is also one of the challenges in developing CAD schemes using a CBIR based regional optimization approach.
Figures
Similar articles
-
A new approach to develop computer-aided diagnosis scheme of breast mass classification using deep learning technology.J Xray Sci Technol. 2017;25(5):751-763. doi: 10.3233/XST-16226. J Xray Sci Technol. 2017. PMID: 28436410 Free PMC article.
-
Assessment of performance and reliability of computer-aided detection scheme using content-based image retrieval approach and limited reference database.J Digit Imaging. 2011 Apr;24(2):352-9. doi: 10.1007/s10278-010-9281-x. J Digit Imaging. 2011. PMID: 20204448 Free PMC article.
-
A new and fast image feature selection method for developing an optimal mammographic mass detection scheme.Med Phys. 2014 Aug;41(8):081906. doi: 10.1118/1.4890080. Med Phys. 2014. PMID: 25086537 Free PMC article.
-
Deep Learning Computer-Aided Diagnosis for Breast Lesion in Digital Mammogram.Adv Exp Med Biol. 2020;1213:59-72. doi: 10.1007/978-3-030-33128-3_4. Adv Exp Med Biol. 2020. PMID: 32030663 Review.
-
POSTGRESQL-IE: an image-handling extension for PostgreSQL.J Digit Imaging. 2009 Apr;22(2):149-65. doi: 10.1007/s10278-007-9097-5. Epub 2008 Jan 23. J Digit Imaging. 2009. PMID: 18214614 Free PMC article. Review.
Cited by
-
Radiological images and machine learning: Trends, perspectives, and prospects.Comput Biol Med. 2019 May;108:354-370. doi: 10.1016/j.compbiomed.2019.02.017. Epub 2019 Feb 27. Comput Biol Med. 2019. PMID: 31054502 Free PMC article. Review.
-
A multi-feature image retrieval scheme for pulmonary nodule diagnosis.Medicine (Baltimore). 2020 Jan;99(4):e18724. doi: 10.1097/MD.0000000000018724. Medicine (Baltimore). 2020. PMID: 31977863 Free PMC article.
-
Applying a new quantitative image analysis scheme based on global mammographic features to assist diagnosis of breast cancer.Comput Methods Programs Biomed. 2019 Oct;179:104995. doi: 10.1016/j.cmpb.2019.104995. Epub 2019 Jul 29. Comput Methods Programs Biomed. 2019. PMID: 31443864 Free PMC article.
-
Computer-aided classification of mammographic masses using visually sensitive image features.J Xray Sci Technol. 2017;25(1):171-186. doi: 10.3233/XST-16212. J Xray Sci Technol. 2017. PMID: 27911353 Free PMC article.
-
Content-based image retrieval for Lung Nodule Classification Using Texture Features and Learned Distance Metric.J Med Syst. 2017 Nov 29;42(1):13. doi: 10.1007/s10916-017-0874-5. J Med Syst. 2017. PMID: 29185058
References
-
- American College of Radiology , ACR Breast Imaging Reporting and Data System Atlas (BI-RADS Atlas) (American College of Radiology, Reston, VA, 2003).
Publication types
MeSH terms
Grants and funding
LinkOut - more resources
Full Text Sources
Other Literature Sources
Medical
Miscellaneous
