

Experimental demonstration of passive acoustic imaging in the human skull cavity using CT-based aberration corrections
- PMID: 26133635
- PMCID: PMC4491023
- DOI: 10.1118/1.4922677
Experimental demonstration of passive acoustic imaging in the human skull cavity using CT-based aberration corrections
Erratum in
-
Erratum: "Experimental demonstration of passive acoustic imaging in the human skull cavity using CT-based aberration corrections" [Med. Phys. 42, 4385-4400 (2015)].Med Phys. 2017 May;44(5):2037. doi: 10.1002/mp.12171. Epub 2017 Apr 17. Med Phys. 2017. PMID: 28497522 Free PMC article. No abstract available.
Abstract
Purpose: Experimentally verify a previously described technique for performing passive acoustic imaging through an intact human skull using noninvasive, computed tomography (CT)-based aberration corrections Jones et al. [Phys. Med. Biol. 58, 4981-5005 (2013)].
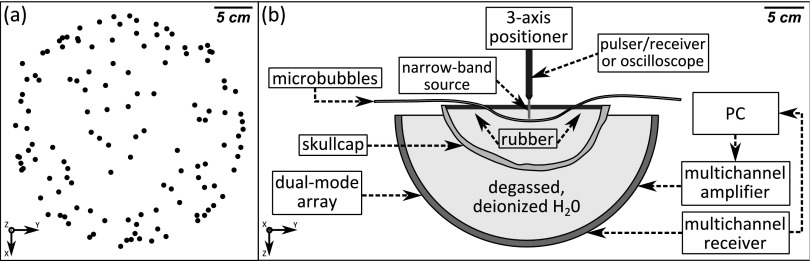
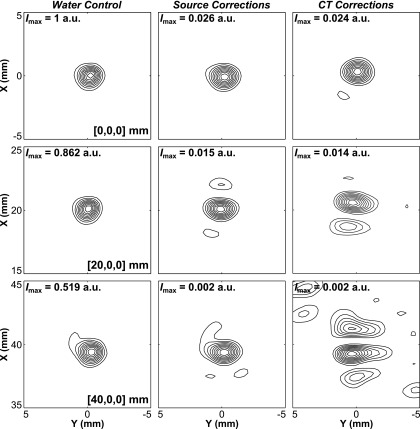
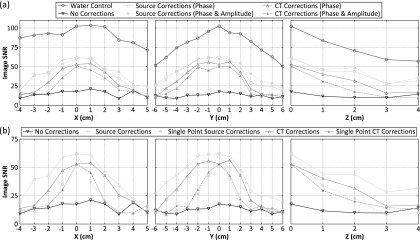
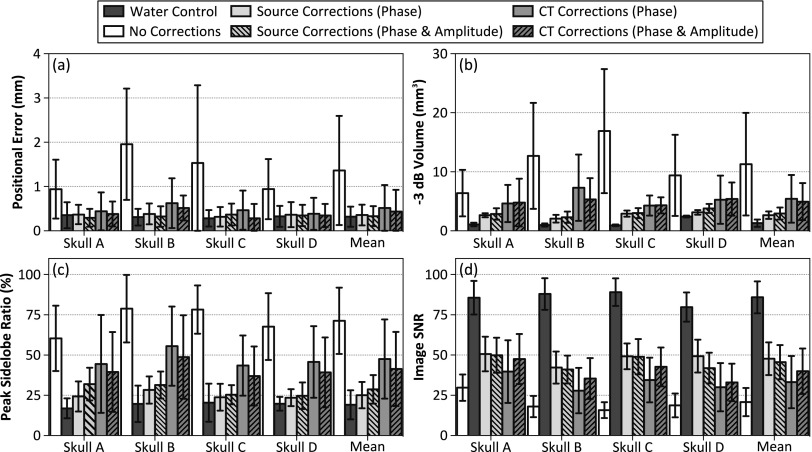
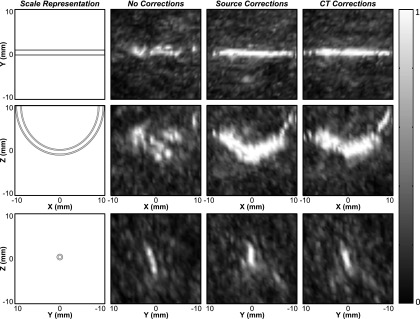
Methods: A sparse hemispherical receiver array (30 cm diameter) consisting of 128 piezoceramic discs (2.5 mm diameter, 612 kHz center frequency) was used to passively listen through ex vivo human skullcaps (n = 4) to acoustic emissions from a narrow-band fixed source (1 mm diameter, 516 kHz center frequency) and from ultrasound-stimulated (5 cycle bursts, 1 Hz pulse repetition frequency, estimated in situ peak negative pressure 0.11-0.33 MPa, 306 kHz driving frequency) Definity™ microbubbles flowing through a thin-walled tube phantom. Initial in vivo feasibility testing of the method was performed. The performance of the method was assessed through comparisons to images generated without skull corrections, with invasive source-based corrections, and with water-path control images.
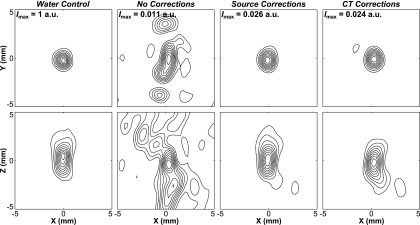
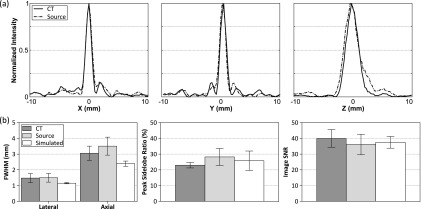
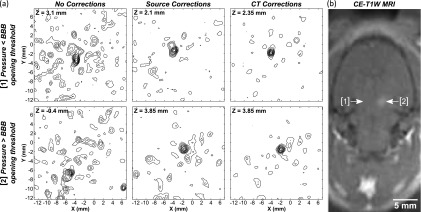
Results: For source locations at least 25 mm from the inner skull surface, the modified reconstruction algorithm successfully restored a single focus within the skull cavity at a location within 1.25 mm from the true position of the narrow-band source. The results obtained from imaging single bubbles are in good agreement with numerical simulations of point source emitters and the authors' previous experimental measurements using source-based skull corrections O'Reilly et al. [IEEE Trans. Biomed. Eng. 61, 1285-1294 (2014)]. In a rat model, microbubble activity was mapped through an intact human skull at pressure levels below and above the threshold for focused ultrasound-induced blood-brain barrier opening. During bursts that led to coherent bubble activity, the location of maximum intensity in images generated with CT-based skull corrections was found to deviate by less than 1 mm, on average, from the position obtained using source-based corrections.
Conclusions: Taken together, these results demonstrate the feasibility of using the method to guide bubble-mediated ultrasound therapies in the brain. The technique may also have application in ultrasound-based cerebral angiography.
Figures
Similar articles
-
Comparison of analytical and numerical approaches for CT-based aberration correction in transcranial passive acoustic imaging.Phys Med Biol. 2016 Jan 7;61(1):23-36. doi: 10.1088/0031-9155/61/1/23. Epub 2015 Nov 25. Phys Med Biol. 2016. PMID: 26605827 Free PMC article.
-
Ultrashort echo-time MRI versus CT for skull aberration correction in MR-guided transcranial focused ultrasound: In vitro comparison on human calvaria.Med Phys. 2015 May;42(5):2223-33. doi: 10.1118/1.4916656. Med Phys. 2015. PMID: 25979016
-
Transcranial passive acoustic mapping with hemispherical sparse arrays using CT-based skull-specific aberration corrections: a simulation study.Phys Med Biol. 2013 Jul 21;58(14):4981-5005. doi: 10.1088/0031-9155/58/14/4981. Epub 2013 Jun 27. Phys Med Biol. 2013. PMID: 23807573 Free PMC article.
-
In-situ synchrotron X-ray imaging of ultrasound (US)-generated bubbles: Influence of US frequency on microbubble cavitation for membrane fouling remediation.Ultrason Sonochem. 2021 Sep;77:105697. doi: 10.1016/j.ultsonch.2021.105697. Epub 2021 Aug 5. Ultrason Sonochem. 2021. PMID: 34388491 Free PMC article. Review.
-
Guided Waves in the Skull.Adv Exp Med Biol. 2022;1364:411-422. doi: 10.1007/978-3-030-91979-5_19. Adv Exp Med Biol. 2022. PMID: 35508886 Review.
Cited by
-
An all-ultrasound cranial imaging method to establish the relationship between cranial FUS incidence angle and transcranial attenuation in non-human primates in 3D.Sci Rep. 2024 Jan 17;14(1):1488. doi: 10.1038/s41598-024-51623-5. Sci Rep. 2024. PMID: 38233480 Free PMC article.
-
Transcranial MR-Guided Histotripsy System.IEEE Trans Ultrason Ferroelectr Freq Control. 2021 Sep;68(9):2917-2929. doi: 10.1109/TUFFC.2021.3068113. Epub 2021 Aug 27. IEEE Trans Ultrason Ferroelectr Freq Control. 2021. PMID: 33755563 Free PMC article.
-
Comparison between MR and CT imaging used to correct for skull-induced phase aberrations during transcranial focused ultrasound.Sci Rep. 2022 Aug 4;12(1):13407. doi: 10.1038/s41598-022-17319-4. Sci Rep. 2022. PMID: 35927449 Free PMC article.
-
Evaluating the safety profile of focused ultrasound and microbubble-mediated treatments to increase blood-brain barrier permeability.Expert Opin Drug Deliv. 2019 Feb;16(2):129-142. doi: 10.1080/17425247.2019.1567490. Epub 2019 Jan 29. Expert Opin Drug Deliv. 2019. PMID: 30628455 Free PMC article. Review.
-
Experimental Demonstration of Trans-Skull Volumetric Passive Acoustic Mapping With the Heterogeneous Angular Spectrum Approach.IEEE Trans Ultrason Ferroelectr Freq Control. 2022 Feb;69(2):534-542. doi: 10.1109/TUFFC.2021.3125670. Epub 2022 Jan 27. IEEE Trans Ultrason Ferroelectr Freq Control. 2022. PMID: 34748486 Free PMC article.
References
-
- Elias W. J., Huss D., Voss T., Loomba J., Khaled M., Zadicario E., Frysinger R. C., Sperling S. A., Wylie S., Monteith S. J., Druzgal J., Shah B. B., Harrison M., and Wintermark M., “A pilot study of focused ultrasound thalamotomy for essential tremor,” N. Engl. J. Med. 369, 640–648 (2013).10.1056/NEJMoa1300962 - DOI - PubMed
-
- Heimburger R. F., “Ultrasound augmentation of central nervous system tumor therapy,” Indiana Med. 78, 469–476 (1985). - PubMed
-
- Ram Z., Cohen Z. R., Harnof S., Tal S., Faibel M., Nass D., Maier S. E., Hadani M., and Mardor Y., “Magnetic resonance imaging-guided, high-intensity focused ultrasound for brain tumor therapy,” Neurosurgery 59, 949–956 (2006). - PubMed
Publication types
MeSH terms
Substances
Grants and funding
LinkOut - more resources
Full Text Sources
Other Literature Sources
Medical
