. 2015 Nov;35(11):875-87.
doi: 10.1089/jir.2014.0210. Epub 2015 Jul 2.

Liposomal Glutathione Supplementation Restores TH1 Cytokine Response to Mycobacterium tuberculosis Infection in HIV-Infected Individuals

Affiliations

Liposomal Glutathione Supplementation Restores TH1 Cytokine Response to Mycobacterium tuberculosis Infection in HIV-Infected Individuals

Judy Ly et al. J Interferon Cytokine Res. 2015 Nov.

Abstract

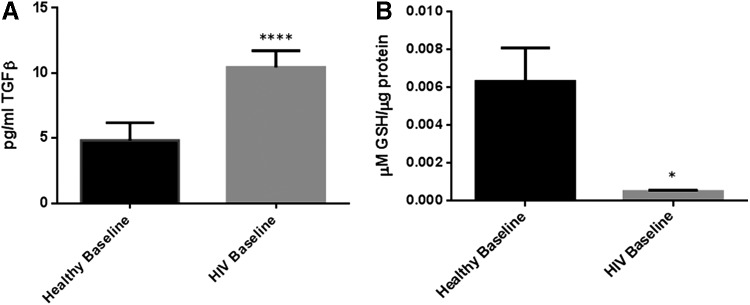
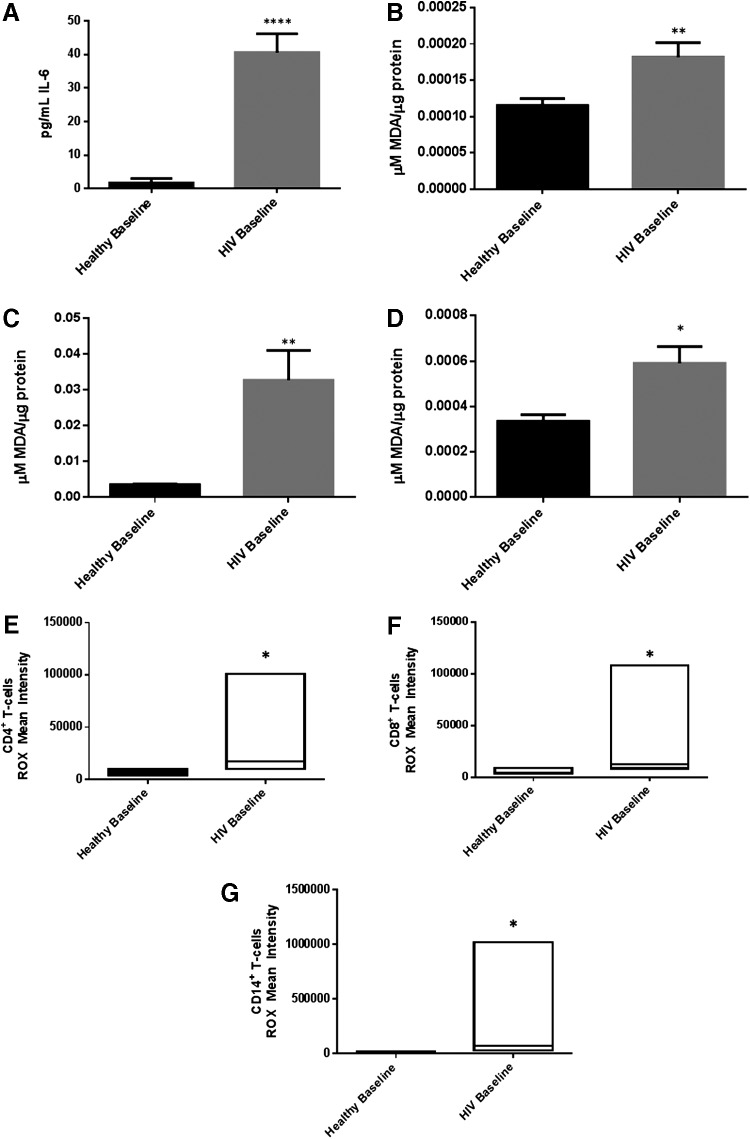
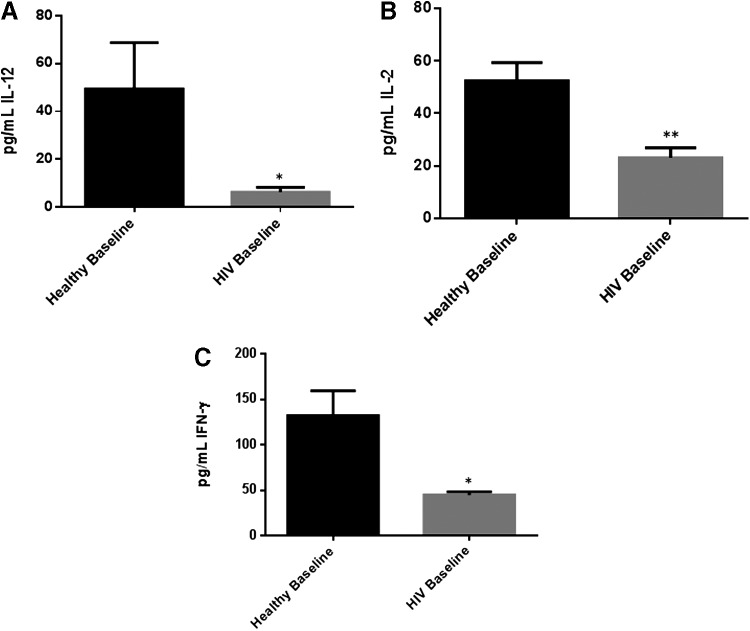
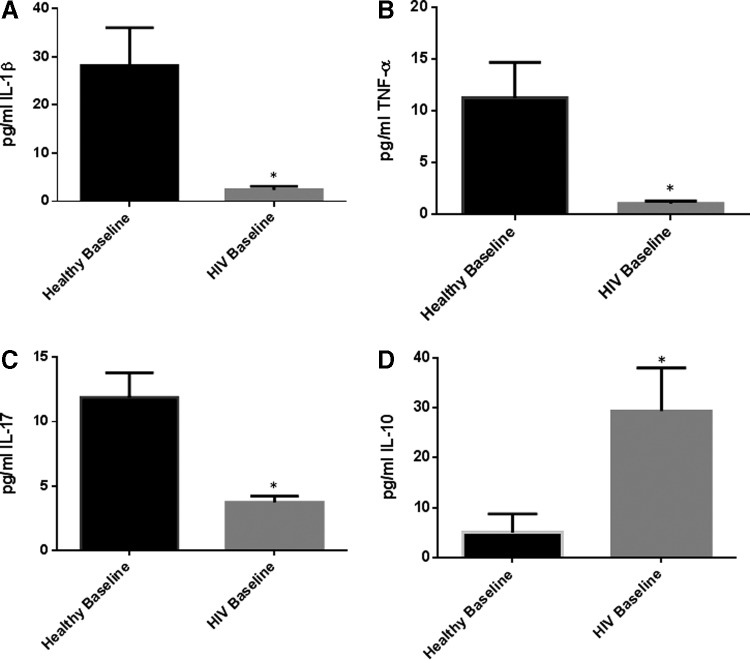
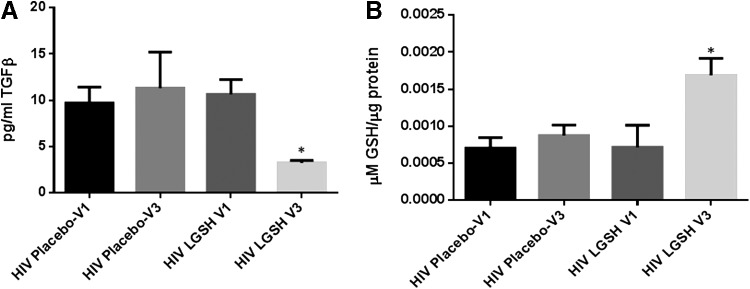
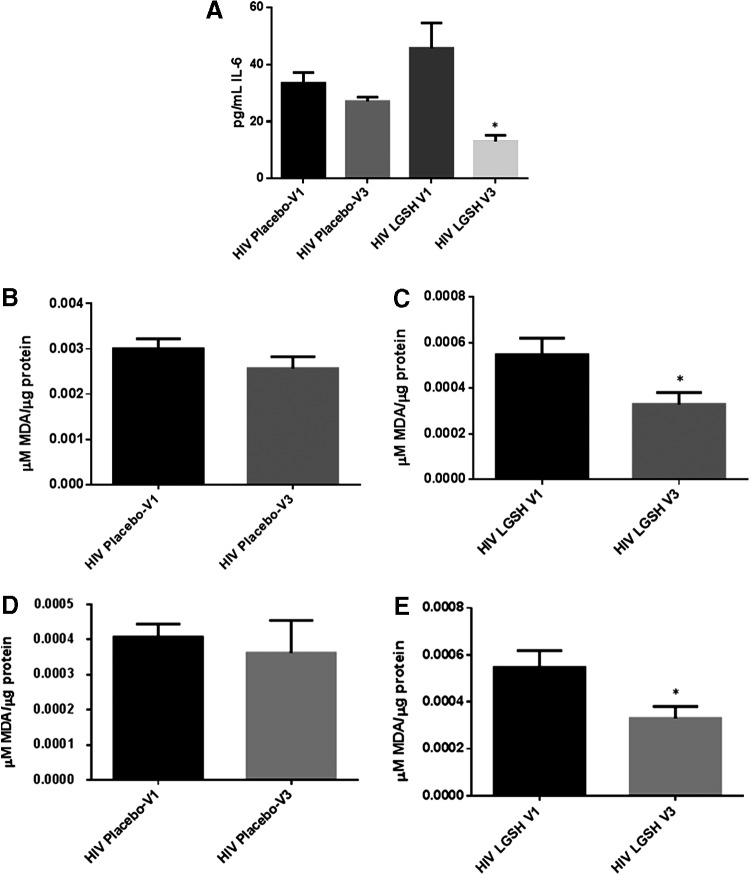
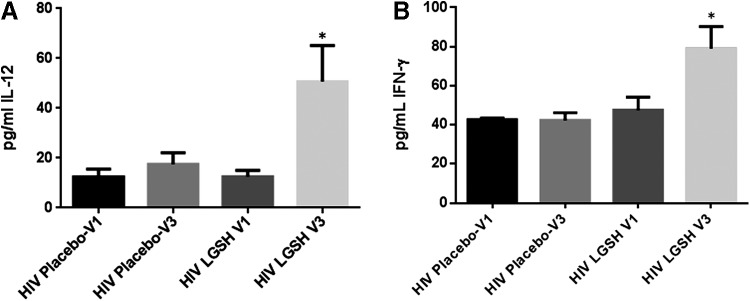
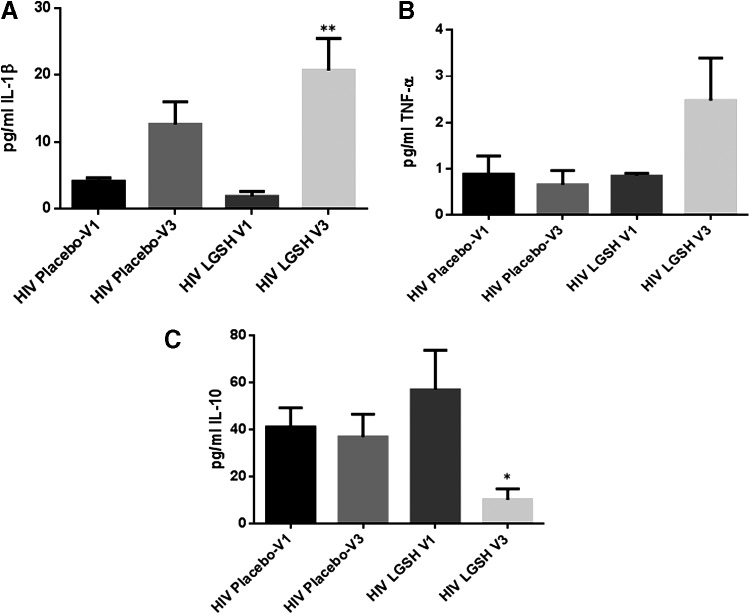
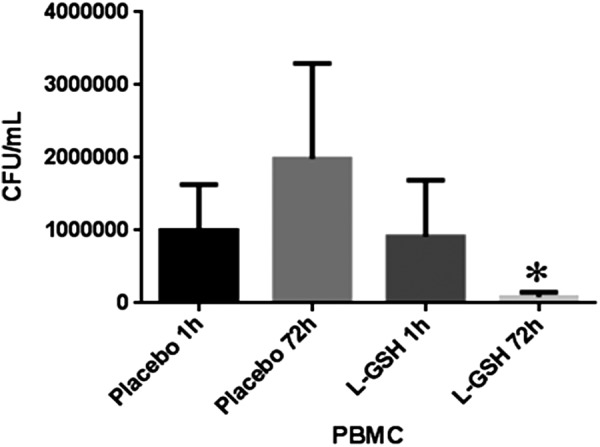
Cytokines are signaling biomolecules that serve as key regulators of our immune system. CD4(+) T-cells can be grouped into 2 major categories based on their cytokine profile: T-helper 1 (TH1) subset and T-helper 2 (TH2) subset. Protective immunity against HIV infection requires TH1-directed CD4 T-cell responses, mediated by cytokines, such as interleukin-1β (IL-1β), IL-12, interferon-γ (IFN-γ), and tumor necrosis factor-α (TNF-α). Cytokines released by the TH1 subset of CD4 T-cells are considered important for mediating effective immune responses against intracellular pathogens such as Mycobacterium tuberculosis (M. tb). Oxidative stress and redox imbalance that occur during HIV infection often lead to inappropriate immune responses. Glutathione (GSH) is an antioxidant present in nearly all cells and is recognized for its function in maintaining redox homeostasis. Our laboratory previously reported that individuals with HIV infection have lower levels of GSH. In this study, we report a link between lower levels of GSH and dysregulation of TH1- and TH2-associated cytokines in the plasma samples of HIV-positive subjects. Furthermore, we demonstrate that supplementing individuals with HIV infection for 13 weeks with liposomal GSH (lGSH) resulted in a significant increase in the levels of TH1 cytokines, IL-1β, IL-12, IFN-γ, and TNF-α. lGSH supplementation in individuals with HIV infection also resulted in a substantial decrease in the levels of free radicals and immunosuppressive cytokines, IL-10 and TGF-β, relative to those in a placebo-controlled cohort. Finally, we determined the effects of lGSH supplementation in improving the functions of immune cells to control M. tb infection by conducting in vitro assays using peripheral blood mononuclear cells collected from HIV-positive individuals at post-GSH supplementation. Our studies establish a correlation between low levels of GSH and increased susceptibility to M. tb infection through TH2-directed response, which may be relieved with lGSH supplementation enhancing the TH1 response.


Figures

<b>FIG. 1.</b>
FIG. 1.
Baseline comparison of TGF-β and total glutathione (GSH) levels between healthy subjects and individuals with HIV infection. There was a significant increase in the levels of TGF-β in plasma samples collected from individuals with HIV infection compared to healthy individuals (A). Data represent mean±SE from comparing baseline levels of 10 healthy volunteers and 15 HIV-positive individuals, *P<0.05. Assay of total GSH showed a significant decrease in the levels of total GSH in peripheral blood mononuclear cell (PBMCs) isolated from HIV-positive individuals compared to healthy subjects (B). Data represent mean±SE from comparing baseline levels of 10 healthy volunteers and 15 HIV-positive individuals, *P<0.05.
<b>FIG. 2.</b>
FIG. 2.
Baseline comparison of the interleukin-6 (IL-6) and reactive oxygen species (ROS) markers between healthy volunteers and HIV-positive individuals. We observed a significant increase in the levels of the proinflammatory cytokine, IL-6 in plasma samples collected from individuals with HIV infection compared to healthy individuals (A). Data represent mean±SE from comparing baseline levels of 10 healthy volunteers and 15 HIV-positive individuals, ****P<0.00005. Malondialdehyde (MDA), a marker of lipid peroxidation and oxidative stress was significantly increased in plasma (B), red blood cells (RBCs), **P<0.005 (C), and monocytes **P<0.005 (D) from HIV-positive individuals compared to healthy subjects. Data represent mean±SE from comparing baseline levels of 10 healthy volunteers and 15 HIV-positive individuals, *P<0.05. ROS production was also quantified by CellROX staining. CellROX green dye is nonfluorescent in its reduced state and produces bright near-infrared fluorescence upon oxidation. The resulting fluorescence can be measured using flow cytometry. Flow cytometry analysis indicates a significant increase in ROX mean intensity in CD4+ T-cells (E), CD8+ T-cells (F), and CD14+ cells/monocytes (G) from HIV-positive individuals compared to healthy subjects. Data represent medians with range, *P<0.05 when comparing baseline levels of healthy volunteers with HIV-positive individuals using the non-parametric version of the t-test, Mann–Whitney test.
<b>FIG. 3.</b>
FIG. 3.
Baseline comparison of TH1 cytokine (IL-12, IL-2, and interferon-γ [IFN-γ]) levels between healthy volunteers and HIV-positive individuals. Assay of TH1 cytokines showed significant decrease in the levels of IL-12 (A), IL-2 (B), and IFN-γ (C) in plasma samples collected from individuals with HIV infection compared to healthy individuals. Data represent mean±SE from comparing baseline levels of 10 healthy volunteers and 15 HIV-positive individuals, *P<0.05, **P<0.005.
<b>FIG. 4.</b>
FIG. 4.
Baseline comparison of IL-1β, tumor necrosis factor-α (TNF-α), IL-17, and IL-10 levels between healthy volunteers and HIV-positive individuals. We observed a significant decrease in the levels of IL-1β (A), TNF-α (B), and IL-17 (C) in plasma samples collected from individuals with HIV infection compared to healthy individuals. There was also a significant increase in the levels of IL-10 (D) in plasma samples collected from individuals with HIV infection compared to healthy individuals. Data represent mean±SE from comparing baseline levels of 10 healthy volunteers and 15 HIV-positive individuals, *P<0.05.
<b>FIG. 5.</b>
FIG. 5.
Changes in the plasma TGF-β levels pre- and post-GSH supplementation. Sandwich enzyme-linked immunosorbent assay (ELISA) was performed to compare the cytokine levels between pre-supplementation (V1) and post-supplementation (V3). Assay of cytokines showed a significant decrease in the levels of TGF-β in plasma samples collected from the liposomal GSH (lGSH)-treatment group after 13 weeks of supplementation. There was no significant difference between the levels of TGF-β from the placebo group when comparing visit 1 and visit 3 (A). Data represent mean±SE, *P<0.05 when comparing pre- and post-supplementation levels within placebo or lGSH group. GSH assay was performed to compare the levels of total GSH between pre-supplementation (V1) and post-supplementation (V3). Assay of GSH showed a significant increase in the levels of total GSH in PBMCs of the lGSH-treatment group after 13 weeks of supplementation. There was no significant difference between the levels of total GSH from the placebo group when comparing visit 1 and visit 3 (B). Data represent mean±SE, *P<0.05 when comparing pre- and post-supplementation levels within placebo or lGSH group.
<b>FIG. 6.</b>
FIG. 6.
Difference in plasma IL-6 levels and ROS markers pre- and post-GSH supplementation. Sandwich ELISA was performed to compare the cytokine levels between pre-supplementation (V1) and post-supplementation (V3). Assay of cytokines showed a significant decrease in the levels of IL-6 in plasma samples collected from the lGSH-treatment group. There was no significant difference between the levels of IL-6 from the placebo group when comparing visit 1 and visit 3 (A). Data represent mean±SE, *P<0.05 when comparing pre- and post-supplementation levels within placebo or lGSH group. MDA assay was performed to compare the levels of MDA, a byproduct of lipid peroxidation, between pre-supplementation (V1) and post-supplementation (V3). Assay of MDA showed that there was no significant difference between the levels of MDA in plasma (B), RBC (D), and monocytes (F) from the placebo group when comparing visit 1 and visit 3. The levels of MDA in plasma (C), RBC (E), and monocytes (G) of the lGSH-treatment group significantly decreased after 13 weeks of supplementation. Data represent mean±SE, **P<0.005 when comparing pre- and post-supplementation levels within placebo or lGSH group. Flow cytometry analysis of CellROX mean intensity, an indicator of ROS production, was completed to compare the levels of ROS production in different cell populations between pre-supplementation (V1) and post-supplementation (V3). Flow cytometry analysis of ROX showed that there was no significant difference between the median of ROX mean intensity CD4+ T-cells (H), CD8+ T-cells (J), and CD14+cells/monocytes (L) from the placebo group when comparing visit 1 and visit 3. Median of ROX mean intensity in CD4+ T-cells (I), CD8+ T-cells (K), and CD14+cells/monocytes (M) from the lGSH-treatment group significantly decreased after 13 weeks of supplementation. Data represent medians with range, *P<0.05 when comparing pre- and post-supplementation levels within placebo or lGSH group using the non-parametric version of the t-test, Mann–Whitney test.
<b>FIG. 7.</b>
FIG. 7.
Changes in the plasma TH1 cytokine (IL-12 and IFN-γ) levels pre- and post-GSH supplementation. Sandwich ELISA was performed to compare the cytokine levels between pre-supplementation (V1) and post-supplementation (V3). Assay of cytokines showed a significant increase in the levels of IL-12 (A) and IFN-γ (B) in the plasma samples collected from the lGSH-treatment group after 13 weeks of supplementation. There was no significant difference between the levels of IL-12 (A) and IFN-γ (B) from the placebo group when comparing V1 and V3. Data represent mean±SE, *P<0.05 when comparing pre- and post-supplementation levels within the placebo or lGSH group.
<b>FIG. 8.</b>
FIG. 8.
Changes in the plasma IL-1β, TNF-α, and IL-10 levels pre- and post-GSH supplementation. Sandwich ELISA was performed to compare the cytokine levels between pre-supplementation (V1) and post-supplementation (V3). Assay of cytokines showed a significant increase in the levels of IL-1β (A) and TNF-α (B) in plasma samples collected from the lGSH-treatment group after 13 weeks of supplementation. On the other hand, a decrease in the levels of IL-10 was observed in the plasma samples collected from the lGSH-treatment group after 13 weeks of supplementation (C). There was no significant difference between the levels of IL-1β (A), TNF-α (B), and IL-10 (C) from the placebo group when comparing V1 and V3. Data represent mean±SE, *P<0.05 and **P<0.005 when comparing pre- and post-supplementation levels within placebo or lGSH group.
<b>FIG. 9.</b>
FIG. 9.
Decreased survival of Mycobacterium tuberculosis (M. tb) in PBMCs isolated from individuals with HIV infection at 13 weeks post supplementation with lGSH. The figure illustrates significant decrease in the intracellular survival of H37Rv in PBMCs isolated from individuals with HIV infection at 13 weeks post-supplementation with lGSH. Data represent mean±SE, *P<0.05 when comparing colony-forming unit counts between 1 and 72 h time points of the lGSH group.
<b>FIG. 10.</b>
FIG. 10.
Effects of GSH supplementation in restoring the immune cell functions against M. tb infection.

Similar articles

Cited by

References

    1. Chung SS, Ho EC, Lam KS, Chung SK. 2003. Contribution of polyol pathway to diabetes-induced oxidative stress. J Am Soc Nephrol 14:S233–S236 - PubMed
    1. Garba ML, Pilcher CD, Bingham AL, Eron J, Frelinger JA. 2002. HIV antigens can induce TGF-beta(1)-producing immunoregulatory CD8(+) T cells. J Immunol 168:2247–2254 - PubMed
    1. Guerra C, Johal K, Morris D, Moreno S, Alvarado O, et al. . 2012. Control of Mycobacterium tuberculosis growth by activated natural killer cells. Clin Exp Immunol 168:142–152 - PMC - PubMed
    1. Guerra C, Morris D, Sipin A, Kung S, Franklin M, et al. . 2011. Glutathione and adaptive immune responses against Mycobacterium tuberculosis infection in healthy and HIV infected individuals. PLoS One 6 (12):e28378. - PMC - PubMed
    1. Herzenberg LA, DeRosa SC, Dubs JG, Roederer M, Anderson MT, et al. . 1997. Glutathione deficiency is associated with impaired survival in HIV disease. Proc Natl Acad Sci U S A 94:1967–1972 - PMC - PubMed

Publication types

MeSH terms