

A Novel Multivariate Index for Pancreatic Cancer Detection Based On the Plasma Free Amino Acid Profile
- PMID: 26133769
- PMCID: PMC4489861
- DOI: 10.1371/journal.pone.0132223
A Novel Multivariate Index for Pancreatic Cancer Detection Based On the Plasma Free Amino Acid Profile
Abstract
Background: The incidence of pancreatic cancer (PC) continues to increase in the world, while most patients are diagnosed with advanced stages and survive <12 months. This poor prognosis is attributable to difficulty of early detection. Here we developed and evaluated a multivariate index composed of plasma free amino acids (PFAAs) for early detection of PC.
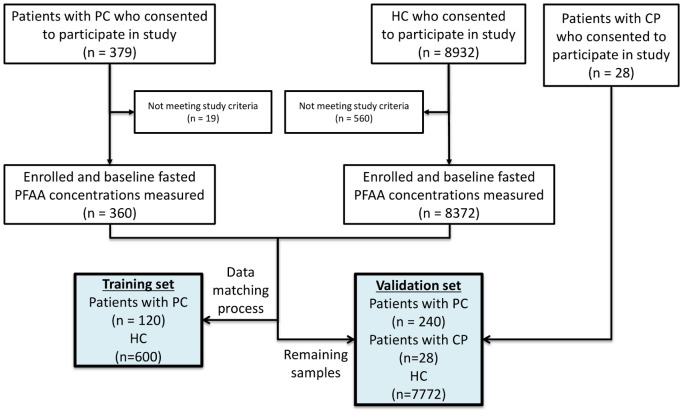
Methods: We conducted a cross-sectional study in multi-institutions in Japan. Fasting plasma samples from PC patients (n = 360), chronic pancreatitis (CP) patients (n = 28), and healthy control (HC) subjects (n = 8372) without apparent cancers who were undergoing comprehensive medical examinations were collected. Concentrations of 19 PFAAs were measured by liquid chromatography-mass spectrometry. We generated an index consisting of the following six PFAAs: serine, asparagine, isoleucine, alanine, histidine, and tryptophan as variables for discrimination in a training set (120 PC and matching 600 HC) and evaluation in a validation set (240 PC, 28 CP, and 7772 HC).
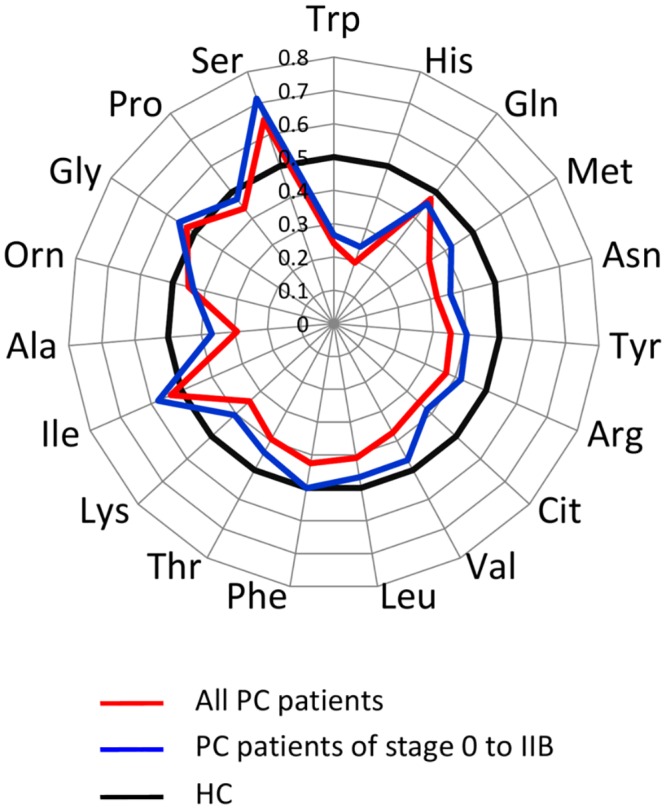
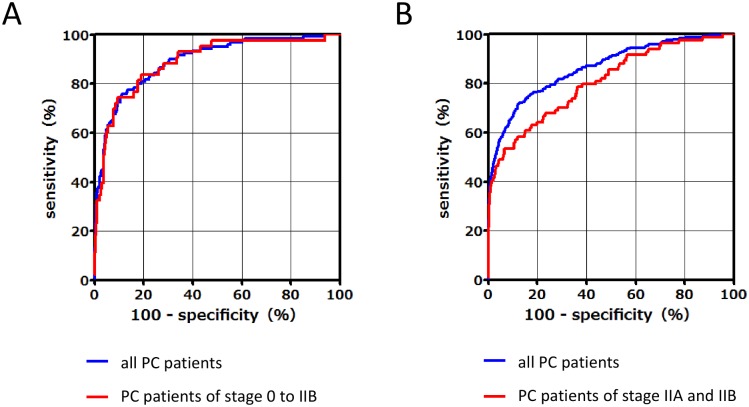
Results: Several amino acid concentrations in plasma were significantly altered in PC. Plasma tryptophan and histidine concentrations in PC were particularly low, while serine was particularly higher than that of HC. The area under curve (AUC) based on receiver operating characteristic (ROC) curve analysis of the resulting index to discriminate PC from HC were 0.89 [95% confidence interval (CI), 0.86-0.93] in the training set. In the validation set, AUCs based on ROC curve analysis of the PFAA index were 0.86 (95% CI, 0.84-0.89) for all PC patients versus HC subjects, 0.81 (95% CI, 0.75-0.86) for PC patients from stage IIA to IIB versus HC subjects, and 0.87 (95% CI, 0.80-0.93) for all PC patients versus CP patients.
Conclusions: These findings suggest that the PFAA profile of PC was significantly different from that of HC. The PFAA index is a promising biomarker for screening and diagnosis of PC.
Conflict of interest statement
Figures
Similar articles
-
The performance of a novel amino acid multivariate index for detecting lung cancer: A case control study in Korea.Lung Cancer. 2015 Dec;90(3):522-7. doi: 10.1016/j.lungcan.2015.10.006. Epub 2015 Oct 23. Lung Cancer. 2015. PMID: 26476713
-
Possibility of multivariate function composed of plasma amino acid profiles as a novel screening index for non-small cell lung cancer: a case control study.BMC Cancer. 2010 Dec 22;10:690. doi: 10.1186/1471-2407-10-690. BMC Cancer. 2010. PMID: 21176209 Free PMC article.
-
The significance and robustness of a plasma free amino acid (PFAA) profile-based multiplex function for detecting lung cancer.BMC Cancer. 2013 Feb 15;13:77. doi: 10.1186/1471-2407-13-77. BMC Cancer. 2013. PMID: 23409863 Free PMC article.
-
4. Chronic pancreatitis and pancreatic cancer, lifestyle-related diseases.Intern Med. 2007;46(2):109-13. doi: 10.2169/internalmedicine.46.1787. Epub 2007 Jan 15. Intern Med. 2007. PMID: 17220612 Review.
-
Diagnostic value of S100P for pancreatic cancer: a meta-analysis.Tumour Biol. 2014 Oct;35(10):9479-85. doi: 10.1007/s13277-014-2461-4. Epub 2014 Aug 15. Tumour Biol. 2014. PMID: 25123266 Review.
Cited by
-
Post-operative AICS status in completely resected lung cancer patients with pre-operative AICS abnormalities: predictive significance of disease recurrence.Sci Rep. 2018 Aug 17;8(1):12378. doi: 10.1038/s41598-018-30685-2. Sci Rep. 2018. PMID: 30120365 Free PMC article.
-
Upregulation of BRCA1 and 2 protein expression is associated with dysregulation in amino acids profiles in breast cancer.Mol Biol Rep. 2024 Jan 2;51(1):50. doi: 10.1007/s11033-023-09028-6. Mol Biol Rep. 2024. PMID: 38165507 Free PMC article.
-
Search for Early Pancreatic Cancer Blood Biomarkers in Five European Prospective Population Biobanks Using Metabolomics.Endocrinology. 2019 Jul 1;160(7):1731-1742. doi: 10.1210/en.2019-00165. Endocrinology. 2019. PMID: 31125048 Free PMC article.
-
Tissue amino acid profiles are characteristic of tumor type, malignant phenotype, and tumor progression in pancreatic tumors.Sci Rep. 2019 Jul 8;9(1):9816. doi: 10.1038/s41598-019-46404-4. Sci Rep. 2019. PMID: 31285536 Free PMC article.
-
Metabolomics Analysis of Laparoscopic Surgery Combined with Wuda Granule to Promote Rapid Recovery of Patients with Colorectal Cancer Using UPLC/Q-TOF-MS/MS.Evid Based Complement Alternat Med. 2020 Feb 13;2020:5068268. doi: 10.1155/2020/5068268. eCollection 2020. Evid Based Complement Alternat Med. 2020. PMID: 32104193 Free PMC article.
References
-
- Greene FL, Page DL, Fleming ID, Fritz AG, Balch CM, Haller DG, et al., editor. AJCC Cancer Staging Manual. 6th ed New York: Springer-Verlag; 2002.
-
- Fischer JE, Rosen HM, Ebeid AM, James JH, Keane JM, Soeters PB. The effect of normalization of plasma amino acids on hepatic encephalopathy in man. Surgery. 1976; 80: 77–91. - PubMed
Publication types
MeSH terms
Substances
LinkOut - more resources
Full Text Sources
Other Literature Sources
Medical
Miscellaneous
