. 2015 Jul 2;11(7):e1005008.
doi: 10.1371/journal.ppat.1005008. eCollection 2015 Jul.

Expression of the Blood-Group-Related Gene B4galnt2 Alters Susceptibility to Salmonella Infection

Affiliations

Expression of the Blood-Group-Related Gene B4galnt2 Alters Susceptibility to Salmonella Infection

Philipp Rausch et al. PLoS Pathog. .

Abstract

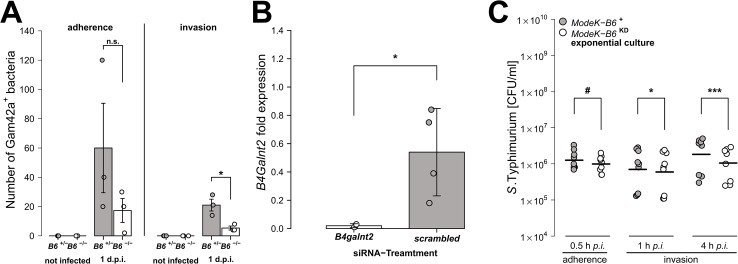
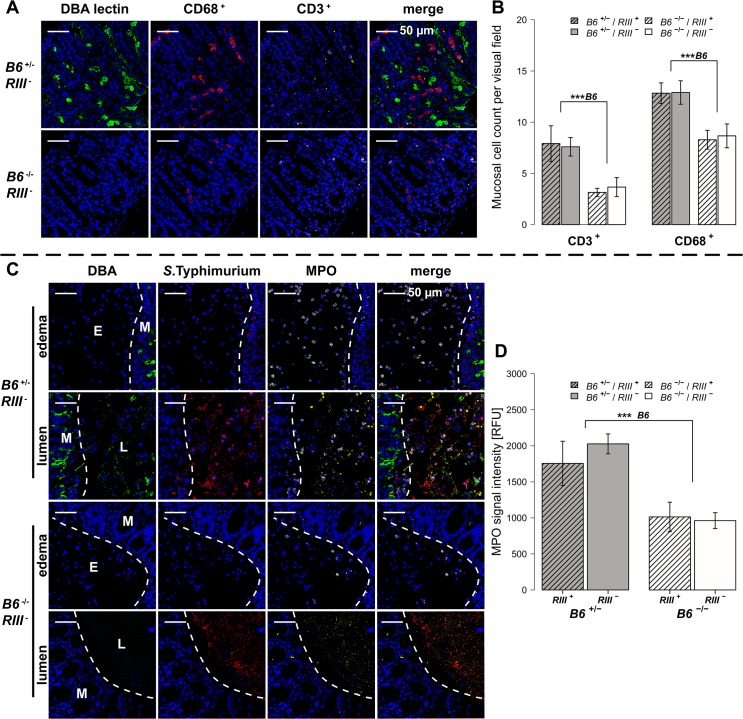
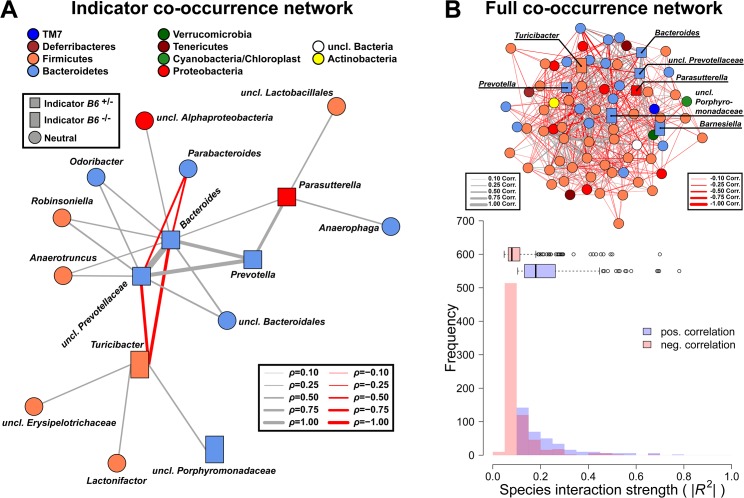
Glycans play important roles in host-microbe interactions. Tissue-specific expression patterns of the blood group glycosyltransferase β-1,4-N-acetylgalactosaminyltransferase 2 (B4galnt2) are variable in wild mouse populations, and loss of B4galnt2 expression is associated with altered intestinal microbiota. We hypothesized that variation in B4galnt2 expression alters susceptibility to intestinal pathogens. To test this, we challenged mice genetically engineered to express different B4galnt2 tissue-specific patterns with a Salmonella Typhimurium infection model. We found B4galnt2 intestinal expression was strongly associated with bacterial community composition and increased Salmonella susceptibility as evidenced by increased intestinal inflammatory cytokines and infiltrating immune cells. Fecal transfer experiments demonstrated a crucial role of the B4galnt2-dependent microbiota in conferring susceptibility to intestinal inflammation, while epithelial B4galnt2 expression facilitated epithelial invasion of S. Typhimurium. These data support a critical role for B4galnt2 in gastrointestinal infections. We speculate that B4galnt2-specific differences in host susceptibility to intestinal pathogens underlie the strong signatures of balancing selection observed at the B4galnt2 locus in wild mouse populations.


Conflict of interest statement

The authors have declared that no competing interests exist.

Figures

Fig 1
Fig 1. Tissue-specific expression of B4galnt2 glycans influence susceptibility to S. Typhimurium-induced colitis.
Mice were treated with streptomycin 24 h prior to infection with S. Typhimurium strain SL1344 for 24 h (acute) or with the attenuated strain S. Typhimurium ΔaroA for 14 days (chronic). (A) B4galnt2 expression phenotype is characterized by GalNAc residues, stained for by Dolichus biflorus agglutinin (DBA). H&E staining of cecal sections illustrated higher numbers of cells in the lumen (L), an increased influx of inflammatory cells to mucosa (M) and submucosa (Sm), epithelial cell desquamation and the formation of submucosal edema (E) upon infection with S. Typhimurium (bar = 100 μm). (B) Cecal weight indicated a significant influence of intestinal B4galnt2 glycans on S. Typhimurium induced colitis in the acute model (B6: F 1,49 = 8.709, P = 0.0048; Linear model). (C) Histological scoring revealed higher inflammation in B6 +/- compared to B6 -/- mice (B6: F 1,49 = 13.242, P = 0.0007; Linear model of X4 transformed inflammation scores). (D) Intestinal S. Typhimurium colonization was determined in tissue homogenates (RIII: F 1,49 = 10.537, P = 0.0021; Linear model of log(CFU)). Data are presented as mean ± SEM, N = 9–19 per group in the acute model, N = 5–7 in the chronic model (# P<0.100, * P<0.050, ** P<0.010, *** P<0.001).
Fig 2
Fig 2. B4galnt2 glycosylation in S. Typhimurium-induced colitis.
(A) MUC2 (red) and DBA lectin (green) staining in formalin fixed cecal tissue sections (B) Acidic mucus was stained with alcian blue in Carnoy’s-fixed tissue sections (bar = 20 μm). (C) Mucus thickness was determined at five different regions within one animal from which mean values were analysed (N = 3–5; Z = -1.807, P = 0.0816; Wilcoxon test via Monte-Carlo resampling). (D) B4galnt2 glycan residues (GalNAc) were stained with fluorescein labeled DBA (green) in formalin fixed cecal tissue sections before and 1 day p.i. with S. Typhimurium. GlcNAc residues were stained with Alexa633 labeled Wheat Germ Agglutinin (WGA) (red). (E) Relative expression of B4galnt2 before and after infection with S. Typhimurium showing significant differences between B6 and RIII genotypes before infection (B6: F 1,17 = 0.216, P = 0.64779; RIII: F 1,17 = 23.959, P = 0.00014; B6/RIII: F 1,17 = 7.687, P = 0.01304 [pairwise comparisons- B6 -/-/RIII +|B6 -/-/RIII -: P = 0.00018, B6 +/-/RIII +|B6 -/-/RIII -: P = 0.08626, B6 -/-/RIII +|B6 +/-/RIII -: P = 0.02673]; Linear model and Tukey post-hoc test) and B6 genotype differences after infection (F 1,53 = 11.787, P = 0.001165). Infection has additional influence on B4galnt2 expression (Z = 5.268, P<0.00001, Wilcoxon test via Monte-Carlo resampling), which is also genotype specific (B6 +/-/RIII +: Z = 2.6458, P Bonferroni = 0.01192, B6 +/-/RIII -: Z = 2.6122, P Bonferroni = 0.02832; B6 -/-/RIII +: Z = 3.5496, P Bonferroni = 0.00016, B6 -/-/RIII -: Z = 2.0642, P Bonferroni = 0.16132; Wilcoxon test via Monte-Carlo resampling; # P < 0.100, * P < 0.050, ** P < 0.010, *** P < 0.001; error bars indicate SEM).
Fig 3
Fig 3. Epithelial B4galnt2-expression increases invasion by S. Typhimurium.
(A) Carnoy’s fixed cecal sections were stained by FISH (Gam42a probe) to visualize bacteria. Measurement of Salmonella adherence (t 2.286 = -1.349, P = 0.2954, unpaired t-test) and mucosa invasion (t 2.430 = -3.681, P = 0.0491; bacterial counts in 10 high power fields per individual, N = 3; unpaired t-test). (B) B4galnt2 expression in Mode-K cells after transfection with B4galnt2 specific siRNA and scrambled siRNA relative to untreated cells (t 3.025 = -3.3601, P = 0.0432; unpaired t-test). (C) Salmonella invasion of Mode-K cell cultures transfected with B4galnt2 specific and scrambled siRNA, infected with S. Typhimurium. There is no significant effect of B4galnt2 expression for adhesion of the bacteria to Mode-K cells (0.5 h: F 1,14 = 3.133, P = 0.0985; LMM with experiment as random factor), while invasion of S. Typhimurium into Mode-K cells expressing B4galnt2 was slightly better than into cells with B4galnt2 knockdown (1 h: F 1,14 = 7.644, P = 0.0152, 4 h: F 1,14 = 26.336, P = 0.0002; LMM with experiment as random factor; # P < 0.100, * P < 0.050, ** P < 0.010, *** P < 0.001; error bars indicate SEM).
Fig 4
Fig 4. B4galnt2-dependent immune response after S. Typhimurium infection.
(A-D) Relative gene expression of Tnf-α, Il-6, Inf-γ and Mcp-1 was determined by RT-qPCR analysis. Values were normalized to Gapdh and Hprt and calculated as fold expression compared to the non-infected samples of each respective genotype. (E) Lipocalin-2 levels were measured by ELISA in supernatants of cecal homogenates (N = 3–11 per group) before- and one day p.i. with S. Typhimurium, showing a clear increase with infection (Z = -2.219, P = 0.0261; Wilcoxon test via Monte-Carlo resampling) and differences between B6 and RIII genotypes (S1 Table, # P < 0.100, * P < 0.050, ** P < 0.010, *** P < 0.001; error bars indicate SEM).
Fig 5
Fig 5. B4galnt2-dependent infiltration of immune cells after S. Typhimurium infection.
(A and B) Immunofluorescence staining and enumeration of positive cells per vision field showed that B6 +/- mice have higher numbers of CD68 (red) and CD3 (white) positive cells in the cecal mucosa 1d p.i. (N = 5–7). Nuclei were stained with DAPI (blue) and B4galnt2 glycans by using fluorescein labeled DBA (green). (C) Myeloperoxidase (MPO) positive cells (white) and S. Typhimurium (red) were determined by immunofluorescence staining. (D) MPO signal in lumen and edema was quantified and expressed as relative fluorescence units (RFU) (N = 7; Linear model; # P < 0.100, * P < 0.050, ** P < 0.010, *** P < 0.001, error bars indicate SEM).
Fig 6
Fig 6. Analysis of microbial alpha diversity among genotypes and their association with intestinal inflammation.
Microbial diversity was estimated from 97% species level OTUs and focused on the mean species richness (A; Chao1), and mean abundance based diversity (B; Shannon H), in the untreated animals. (C) The bacterial species richness is (i) decreasing with increasing inflammation (F 1,22 = 14.2123, P = 0.0011; LMM), (ii) but highly predictive of inflammation with differences among B4galnt2 genotypes (D; Chao1 F 1,21 = 9.8274, P = 0.005, B6: F 1,21 = 9.2976, P = 0.0061, see also Table 2). The predictive power of alpha diversity for the outcome of infection is significantly improved by incorporating the B6 genotype (Chao1: R 2 LR = 0,320, ΔAIC = -5.936, LR = 7.9360, P LR-Test = 0.0048; Shannon H: R 2 LR = 0,271, ΔAIC = -6.1811, LR = 8.1811, P LR-Test = 0.0042; NTI: R 2 LR = 0.2625, ΔAIC = -8.8842, LR = 10.8842, P LR-Test = 0.001). The turnover of bacterial communities (Δ unweighted UniFrac) over the course of the experiment is strongest in animals expressing B4galnt2 in the epithelium (E; Z = -2.3213, P = 0.01978; Wilcoxon test via Monte-Carlo resampling), and is highest in animals with strong inflammation (F; ρ = 0.5894, P = 0.00005; Spearman rank correlation). The community disturbance is also highest in animals with a high species richness before treatment (G; ρ = 0.6040, P = 0.000042; Spearman rank correlation; # P < 0.100, * P < 0.050, ** P < 0.010, *** P < 0.001, error bars indicate SEM; only results of best models are shown and pairwise tests are indicated).
Fig 7
Fig 7. Treatment wise Principle Coordinate Analysis (unweighted UniFrac) of untreated- and S. Typhimurium inoculated mice and distribution of indicator bacteria among mice.
The significant sample clusters and correlations are shown, displaying a strong influence of epithelial B4galnt2 expression on the microbial community composition (no treatment (A): R 2 = 0.1480, P = 0.0019; Salmonella treatment (B): B6: R 2 = 0.0607, P = 0.08669, RIII: R 2 = 0.0781, P = 0.040, inflammation: R 2 = 0.5531, P<0.0001). Abundance distribution of indicator genera before (C) and after S. Typhimurium infection (D) for B4galnt2 gut expression among mice.
Fig 8
Fig 8. Targeted co-occurrence network analysis of indicator genera and overall network analysis.
(A) Indicator genera for B6 genotypes were correlated to abundances of the remaining community members to investigate proximate interactions among indicator genera and the surrounding community (interactions are Spearman correlations see S6 Table; square - B6 +/- indicator, rectangle—B6 -/- indicator, circle—no indicator/neutral). (B) Microbial co-occurrence network based on genera abundances (only significant associations shown), with indicator species highlighted. Microbial communities show significant higher interaction strength among positive interactions (i.e. potential mutualistic; SPF: W = 489396, P < 2.20 × 10⁻¹⁶; Wilcoxon test). However, the higher frequency of negative weak interactions overall has a stabilizing effect preventing the communities from collapsing (positive/negative interactions = 0.482; # P < 0.100, * P < 0.050, ** P < 0.010, *** P < 0.001).
Fig 9
Fig 9. B4galnt2-dependent microbiota composition is responsible for enhanced susceptibility to inflammation.
(A) Representative H&E staining of cecal sections with higher number of luminal cells (L), increased influx of inflammatory cell populations into the mucosa (M) and epithelial cell desquamation and submucosal edema (E) upon infection with S. Typhimurium (bar = 100 μm). (B) Cecum weight (Z = 1.087, P = 0.3013, (C) and Salmonella abundance in the cecum (Z = 0.447, P = 0.7098) do not differ between donor genotypes (N = 7 infected and N = 3 uninfected controls per donor genotype). (D) Histological inflammation is significantly reduced in mice that received a B6 -/- microbiome (Z = -2.074, P = 0.0459; Wilcoxon test via Monte-Carlo resampling, # P < 0.100, * P < 0.050, ** P < 0.010, *** P < 0.001, error bars indicate SEM).

References

    1. Koropatkin NM, Cameron EA, Martens EC. How glycan metabolism shapes the human gut microbiota. Nat Rev Micro. 2012;10(5):323–35. Epub 2012/04/12. 10.1038/Nrmicro2746 - DOI - PMC - PubMed
    1. Sonnenburg JL, Xu J, Leip DD, Chen CH, Westover BP, Weatherford J, et al. Glycan foraging in vivo by an intestine-adapted bacterial symbiont. Science. 2005;307(5717):1955–9. - PubMed
    1. Varki A, Freeze HH, Gagneux P. Evolution of Glycan Diversity In: Varki A, Cummings RD, Esko JD, Freeze HH, Stanley P, Bertozzi CR, et al. , editors. Essentials of Glycobiology. 2010/03/20 ed. Cold Spring Harbor NY: The Consortium of Glycobiology Editors, La Jolla, California; 2009.
    1. Giannasca KT, Giannasca PJ, Neutra MR. Adherence of Salmonella typhimurium to Caco-2 cells: identification of a glycoconjugate receptor. Infection and immunity. 1996;64(1):135–45. Epub 1996/01/01. - PMC - PubMed
    1. Kobayashi M, Lee H, Nakayama J, Fukuda M. Roles of gastric mucin-type O-glycans in the pathogenesis of Helicobacter pylori infection. Glycobiology. 2009;19(5):453–61. Epub 2009/01/20. 10.1093/glycob/cwp004 - DOI - PMC - PubMed

Publication types

MeSH terms

Substances

LinkOut - more resources