. 2015 Aug 18;48(8):2200-8.
doi: 10.1021/acs.accounts.5b00198. Epub 2015 Jul 2.

Protein structural dynamics revealed by time-resolved X-ray solution scattering

Affiliations

Protein structural dynamics revealed by time-resolved X-ray solution scattering

Jong Goo Kim et al. Acc Chem Res. .

Abstract

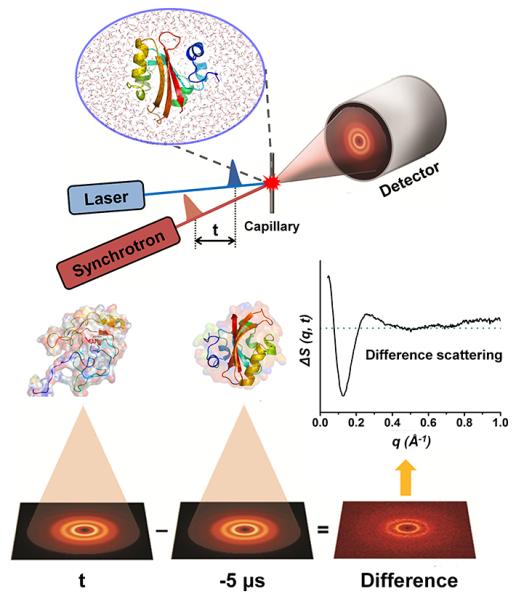
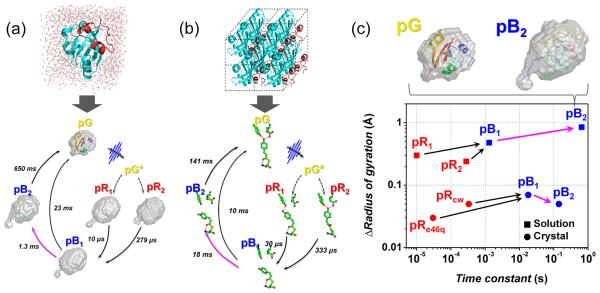
One of the most important questions in biological science is how a protein functions. When a protein performs its function, it undergoes regulated structural transitions. In this regard, to better understand the underlying principle of a protein function, it is desirable to monitor the dynamic evolution of the protein structure in real time. To probe fast and subtle motions of a protein in physiological conditions demands an experimental tool that is not only equipped with superb spatiotemporal resolution but also applicable to samples in solution phase. Time-resolved X-ray solution scattering (TRXSS), discussed in this Account, fits all of those requirements needed for probing the movements of proteins in aqueous solution. The technique utilizes a pump-probe scheme employing an optical pump pulse to initiate photoreactions of proteins and an X-ray probe pulse to monitor ensuing structural changes. The technical advances in ultrafast lasers and X-ray sources allow us to achieve superb temporal resolution down to femtoseconds. Because X-rays scatter off all atomic pairs in a protein, an X-ray scattering pattern provides information on the global structure of the protein with subangstrom spatial resolution. Importantly, TRXSS is readily applicable to aqueous solution samples of proteins with the aid of theoretical models and therefore is well suited for investigating structural dynamics of protein transitions in physiological conditions. In this Account, we demonstrate that TRXSS can be used to probe real-time structural dynamics of proteins in solution ranging from subtle helix movement to global conformational change. Specifically, we discuss the photoreactions of photoactive yellow protein (PYP) and homodimeric hemoglobin (HbI). For PYP, we revealed the kinetics of structural transitions among four transient intermediates comprising a photocycle and, by applying structural analysis based on ab initio shape reconstruction, showed that the signaling of PYP involves the protrusion of the N-terminus with significant increase of the overall protein size. For HbI, we elucidated the dynamics of complex allosteric transitions among transient intermediates. In particular, by applying structural refinement analysis based on rigid-body modeling, we found that the allosteric transition of HbI accompanies the rotation of quaternary structure and the contraction between two heme domains. By making use of the experimental and analysis methods presented in this Account, we envision that the TRXSS can be used to probe the structural dynamics of various proteins, allowing us to decipher the working mechanisms of their functions. Furthermore, when combined with femtosecond X-ray pulses generated from X-ray free electron lasers, TRXSS will gain access to ultrafast protein dynamics on sub-picosecond time scales.


Figures

Figure 1
Figure 1
Schematic of TRXSS experiment. The protein in solution is excited by an optical laser (pump) pulse. After a well-defined time-delay (t), an X-ray (probe) pulse generated from a synchrotron is delivered to the photoexcited sample and the scattering patterns are measured at various time delays. By taking the difference between scattering patterns measured before the laser excitation (i.e., at a negative time delay) and after the laser excitation (i.e., at a positive time delay), the transient structural change of the protein can be obtained selectively.
Figure 2
Figure 2
(a) (Left) Unfolding process of Cyt c produced by MD simulation. (Right) For various unfolded conformations of the protein sampled from MD snapshots, theoretical static (upper panel) and difference (lower panel) scattering curves were calculated. As the protein becomes unfolded (magenta arrow), the amplitude of the difference scattering curve in the SAXS region increases gradually. (b) (Left) Helix movement of Mb produced by MD simulation. (Right) For two conformations of the protein with slightly different helix positions, which can result from the clamshell movement (magenta arrow), theoretical static (upper panel) and difference (lower panel) scattering curves were calculated. The small change in the static scattering curve induced by the subtle helix movement is seen distinctly in the difference scattering curve.
Figure 3
Figure 3
Overall analysis scheme of the TRXSS data. Population changes and species-associated difference scattering curves of reaction intermediates are obtained by singular value decomposition (SVD) analysis and subsequent principal component analysis (PCA). By minimizing the discrepancy (χ) between experimental species-associated scattering curves and theoretical scattering curves calculated from a dummy atom model or a rigid-body model, the refined structure that yields the scattering curve fitting the experimental scattering curve is determined as the structure of a protein intermediate.
Figure 4
Figure 4
(a) Structure of PYP and its pCA chromophore. (b) Time-resolved difference scattering curves, qΔS(q,t), of PYP in solution (black) and theoretical difference scattering curves (red) obtained from the kinetic analysis. (c) Proposed kinetic model of the PYP photocycle. (d) Species-associated difference scattering curves of the intermediates extracted from the kinetic analysis based on the proposed kinetic model. (e) Population changes of the individual intermediates as a function of time. The open circles correspond to the optimized populations at the time delay points where experimental data were measured and the lines correspond to the population changes obtained by the kinetic analysis.
Figure 5
Figure 5
(a) Global molecular shapes of the protein intermediates in solution obtained by the ab initio shape reconstruction. (b) The structural change of the pCA chromophore determined from time-resolved X-ray crystallography. We note that the pR1 and pR2 intermediates in solution were termed as pRE46Q and pRCW intermediates in crystal in a previous study., (c) Change in the radius of gyration (Rg) for each intermediate relative to the ground-state PYP as the photocycle in solution (squares) and crystal (circles) progresses over time. The magenta lines emphasize the formation of a putative signaling state (pB2) in solution and crystal. For clarity, the protein shape of pB2 is compared with that of ground state (pG). The reconstructed shape of pB2 state is superimposed onto the protein structure (rainbow cartoon) determined from a combination of various probes (DEER, NMR, and SAXS/WAXS).
Figure 6
Figure 6
(a) Structure of HbI(CO)2 (pdb code: 3SDH). The Phe97 residue (shown in blue) in each subunit is replaced by Tyr in the F97Y mutant. Two hemes (shown in green) are in contact with each other through a hydrogen-bonding network connected by well-organized interfacial water molecules (shown in red). (b) (Upper) Time-resolved difference scattering curves, ΔS(q,t), measured for solution samples of wild-type (black curves) and F97Y HbI (red curves). (Lower) Species-associated difference scattering curves for the three intermediates of wild-type HbI (black) and its F97Y mutant (red). (c) Kinetic model common for both wild-type and F97Y HbI. The time constants in black and red correspond to the wild type and the mutant, respectively. The red (with “CO”) and white symbols represent the ligated and photolyzed subunits, respectively. (d) Population changes of the three intermediates and HbI(CO)2 as a function of time for the wild type (black) and the mutant (red). The open circles and the lines have the same meaning as in Figure 3e.
Figure 7
Figure 7
(a) Experimental species-associated difference scattering curves (squares) and theoretical difference scattering curves of candidate structures (solid lines) for the four intermediates. (b) (Upper) Averaged displacement plots of the three intermediates of wild-type HbI (solid lines). Error bars represent standard deviation values among various candidate structures of each intermediate. (Lower) Displacement plots of I3WT (black) and the crystallographic structure of deoxy HbI (red) relative to HbI(CO)2. (c) Heme-heme distances in the candidate structures of the four intermediates represented as a function of subunit rotation angle. Dots in black, red, blue and green correspond to I1, I2, I3WT, and I3F97Y, respectively. The blue arrow indicates that the transition from I2 to I3WT involves the rotation of subunits and the decrease of the heme-heme distance, while the green one indicates that the transition from I2 to I3F97Y does not accompany any decrease of the heme-heme distance.

References

    1. Kukura P, McCamant DW, Mathies RA. Femtosecond stimulated Raman spectroscopy. Annu. Rev. Phys. Chem. 2007;58:461–488. - PubMed
    1. Kennis JTM, Larsen DS, Ohta K, Facciotti MT, Glaeser RM, Fleming GR. Ultrafast protein dynamics of bacteriorhodopsin probed by photon echo and transient absorption spectroscopy. J. Phys. Chem. B. 2002;106:6067–6080.
    1. Zanni MT, Hochstrasser RM. Two-dimensional infrared spectroscopy: a promising new method for the time resolution of structures. Curr. Opin. Struc. Biol. 2001;11:516–522. - PubMed
    1. Lewis JW, Goldbeck RA, Kliger DS, Xie XL, Dunn RC, Simon JD. Time-resolved circular-dichroism spectroscopy - experiment, theory, and applications to biological-systems. J. Phys. Chem. 1992;96:5243–5254.
    1. Jung YO, Lee JH, Kim J, Schmidt M, Moffat K, Srajer V, Ihee H. Volume-conserving trans-cis isomerization pathways in photoactive yellow protein visualized by picosecond X-ray crystallography. Nat. Chem. 2013;5:212–220. - PMC - PubMed

Publication types

MeSH terms

LinkOut - more resources