Differential Effects of Glycyrrhiza Species on Genotoxic Estrogen Metabolism: Licochalcone A Downregulates P450 1B1, whereas Isoliquiritigenin Stimulates It
- PMID: 26134484
- PMCID: PMC4664064
- DOI: 10.1021/acs.chemrestox.5b00157
Differential Effects of Glycyrrhiza Species on Genotoxic Estrogen Metabolism: Licochalcone A Downregulates P450 1B1, whereas Isoliquiritigenin Stimulates It
Abstract
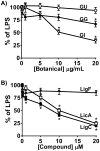
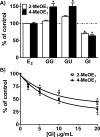
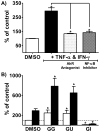
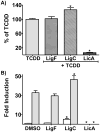
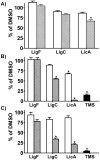
Estrogen chemical carcinogenesis involves 4-hydroxylation of estrone/estradiol (E1/E2) by P450 1B1, generating catechol and quinone genotoxic metabolites that cause DNA mutations and initiate/promote breast cancer. Inflammation enhances this effect by upregulating P450 1B1. The present study tested the three authenticated medicinal species of licorice [Glycyrrhiza glabra (GG), G. uralensis (GU), and G. inflata (GI)] used by women as dietary supplements for their anti-inflammatory activities and their ability to modulate estrogen metabolism. The pure compounds, liquiritigenin (LigF), its chalcone isomer isoliquiritigenin (LigC), and the GI-specific licochalcone A (LicA) were also tested. The licorice extracts and compounds were evaluated for anti-inflammatory activity by measuring inhibition of iNOS activity in macrophage cells: GI ≫ GG > GU and LigC ≅ LicA ≫ LigF. The Michael acceptor chalcone, LicA, is likely responsible for the anti-inflammatory activity of GI. A sensitive LC-MS/MS assay was employed to quantify estrogen metabolism by measuring 2-MeOE1 as nontoxic and 4-MeOE1 as genotoxic biomarkers in the nontumorigenic human mammary epithelial cell line, MCF-10A. GG, GU, and LigC increased 4-MeOE1, whereas GI and LicA inhibited 2- and 4-MeOE1 levels. GG, GU (5 μg/mL), and LigC (1 μM) also enhanced P450 1B1 expression and activities, which was further increased by inflammatory cytokines (TNF-α and IFN-γ). LicA (1, 10 μM) decreased cytokine- and TCDD-induced P450 1B1 gene expression and TCDD-induced xenobiotic response element luciferase reporter (IC50 = 12.3 μM), suggesting an antagonistic effect on the aryl hydrocarbon receptor, which regulates P450 1B1. Similarly, GI (5 μg/mL) reduced cytokine- and TCDD-induced P450 1B1 gene expression. Collectively, these data suggest that, of the three licorice species that are used in botanical supplements, GI represents the most promising chemopreventive licorice extract for women's health. Additionally, the differential effects of the Glycyrrhiza species on estrogen metabolism emphasize the importance of standardization of botanical supplements to species-specific bioactive compounds.
Figures






Similar articles
-
Evidence for Chemopreventive and Resilience Activity of Licorice: Glycyrrhiza Glabra and G. Inflata Extracts Modulate Estrogen Metabolism in ACI Rats.Cancer Prev Res (Phila). 2018 Dec;11(12):819-830. doi: 10.1158/1940-6207.CAPR-18-0178. Epub 2018 Oct 4. Cancer Prev Res (Phila). 2018. PMID: 30287522 Free PMC article.
-
Red Clover Aryl Hydrocarbon Receptor (AhR) and Estrogen Receptor (ER) Agonists Enhance Genotoxic Estrogen Metabolism.Chem Res Toxicol. 2017 Nov 20;30(11):2084-2092. doi: 10.1021/acs.chemrestox.7b00237. Epub 2017 Oct 19. Chem Res Toxicol. 2017. PMID: 28985473 Free PMC article.
-
Induction of NAD(P)H:Quinone Oxidoreductase 1 (NQO1) by Glycyrrhiza Species Used for Women's Health: Differential Effects of the Michael Acceptors Isoliquiritigenin and Licochalcone A.Chem Res Toxicol. 2015 Nov 16;28(11):2130-41. doi: 10.1021/acs.chemrestox.5b00310. Epub 2015 Nov 5. Chem Res Toxicol. 2015. PMID: 26473469 Free PMC article.
-
Mechanisms of estrogen carcinogenesis: The role of E2/E1-quinone metabolites suggests new approaches to preventive intervention--A review.Steroids. 2015 Jul;99(Pt A):56-60. doi: 10.1016/j.steroids.2014.08.006. Epub 2014 Aug 24. Steroids. 2015. PMID: 25159108 Free PMC article. Review.
-
Biological Effects of Licochalcones.Mini Rev Med Chem. 2019;19(8):647-656. doi: 10.2174/1389557518666180601095420. Mini Rev Med Chem. 2019. PMID: 30049263 Review.
Cited by
-
Hop (Humulus lupulus L.) Extract and 6-Prenylnaringenin Induce P450 1A1 Catalyzed Estrogen 2-Hydroxylation.Chem Res Toxicol. 2016 Jul 18;29(7):1142-50. doi: 10.1021/acs.chemrestox.6b00112. Epub 2016 Jun 22. Chem Res Toxicol. 2016. PMID: 27269377 Free PMC article.
-
Classification of Flavonoid Metabolomes via Data Mining and Quantification of Hydroxyl NMR Signals.Anal Chem. 2020 Apr 7;92(7):4954-4962. doi: 10.1021/acs.analchem.9b05084. Epub 2020 Mar 26. Anal Chem. 2020. PMID: 32108467 Free PMC article.
-
Evidence for Chemopreventive and Resilience Activity of Licorice: Glycyrrhiza Glabra and G. Inflata Extracts Modulate Estrogen Metabolism in ACI Rats.Cancer Prev Res (Phila). 2018 Dec;11(12):819-830. doi: 10.1158/1940-6207.CAPR-18-0178. Epub 2018 Oct 4. Cancer Prev Res (Phila). 2018. PMID: 30287522 Free PMC article.
-
Breast cancer prevention with liquiritigenin from licorice through the inhibition of aromatase and protein biosynthesis in high-risk women's breast tissue.Sci Rep. 2023 May 30;13(1):8734. doi: 10.1038/s41598-023-34762-z. Sci Rep. 2023. PMID: 37253812 Free PMC article.
-
Red Clover Aryl Hydrocarbon Receptor (AhR) and Estrogen Receptor (ER) Agonists Enhance Genotoxic Estrogen Metabolism.Chem Res Toxicol. 2017 Nov 20;30(11):2084-2092. doi: 10.1021/acs.chemrestox.7b00237. Epub 2017 Oct 19. Chem Res Toxicol. 2017. PMID: 28985473 Free PMC article.
References
-
- Siegel R, Ma J, Zou Z, Jemal A. Cancer statistics, 2014. CA Cancer J Clin. 2014;64:9–29. - PubMed
-
- Sorg O. AhR signalling and dioxin toxicity. Toxicol Lett. 2014;230:225–233. - PubMed
-
- Fernandez SV, Russo IH, Russo J. Estradiol and its metabolites 4-hydroxyestradiol and 2-hydroxyestradiol induce mutations in human breast epithelial cells. Int J Cancer. 2006;118:1862–1868. - PubMed
-
- Russo J, Fernandez SV, Russo PA, Fernbaugh R, Sheriff FS, Lareef HM, Garber J, Russo IH. 17-Beta-estradiol induces transformation and tumorigenesis in human breast epithelial cells. FASEB J. 2006;20:1622–1634. - PubMed
Publication types
MeSH terms
Substances
Grants and funding
LinkOut - more resources
Full Text Sources
Other Literature Sources
Medical

