

Directed evolution of anti-HER2 DARPins by SNAP display reveals stability/function trade-offs in the selection process
- PMID: 26134501
- PMCID: PMC4550541
- DOI: 10.1093/protein/gzv029
Directed evolution of anti-HER2 DARPins by SNAP display reveals stability/function trade-offs in the selection process
Abstract
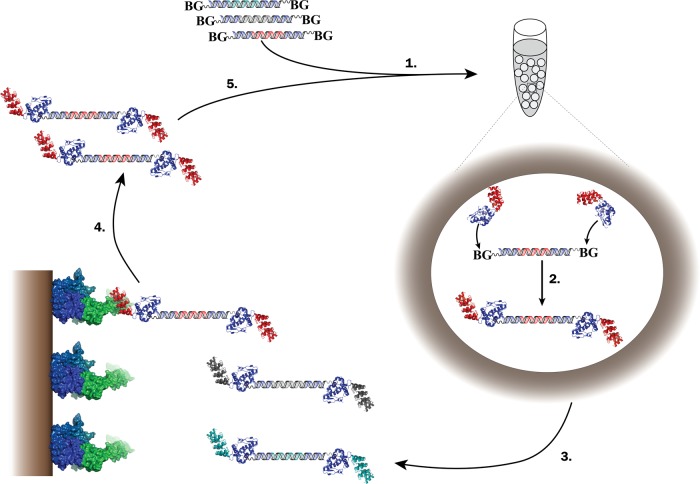
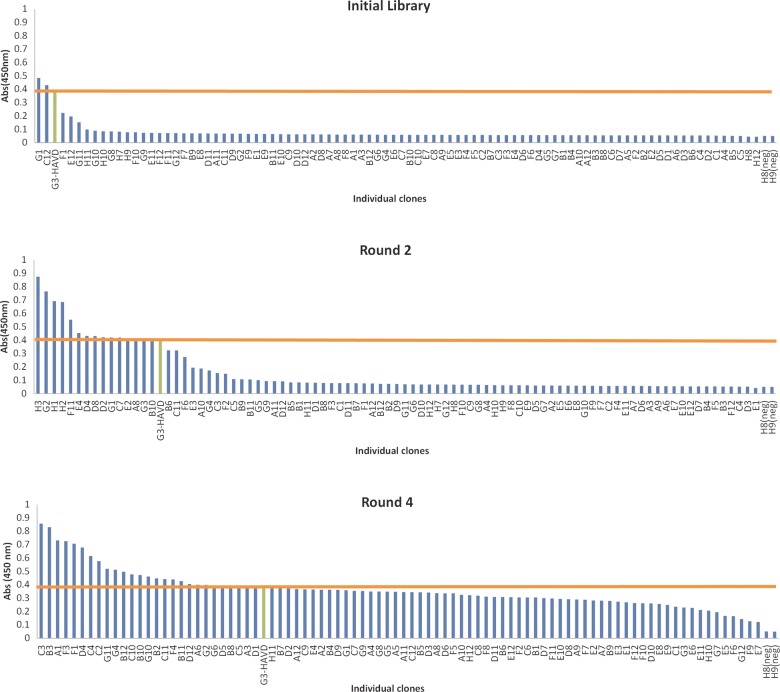
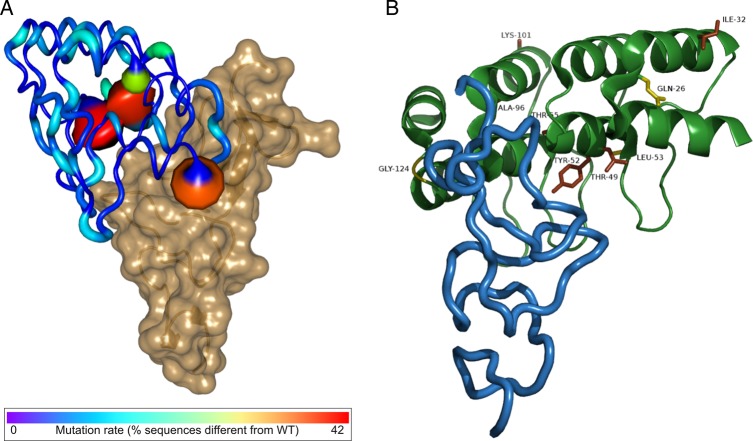
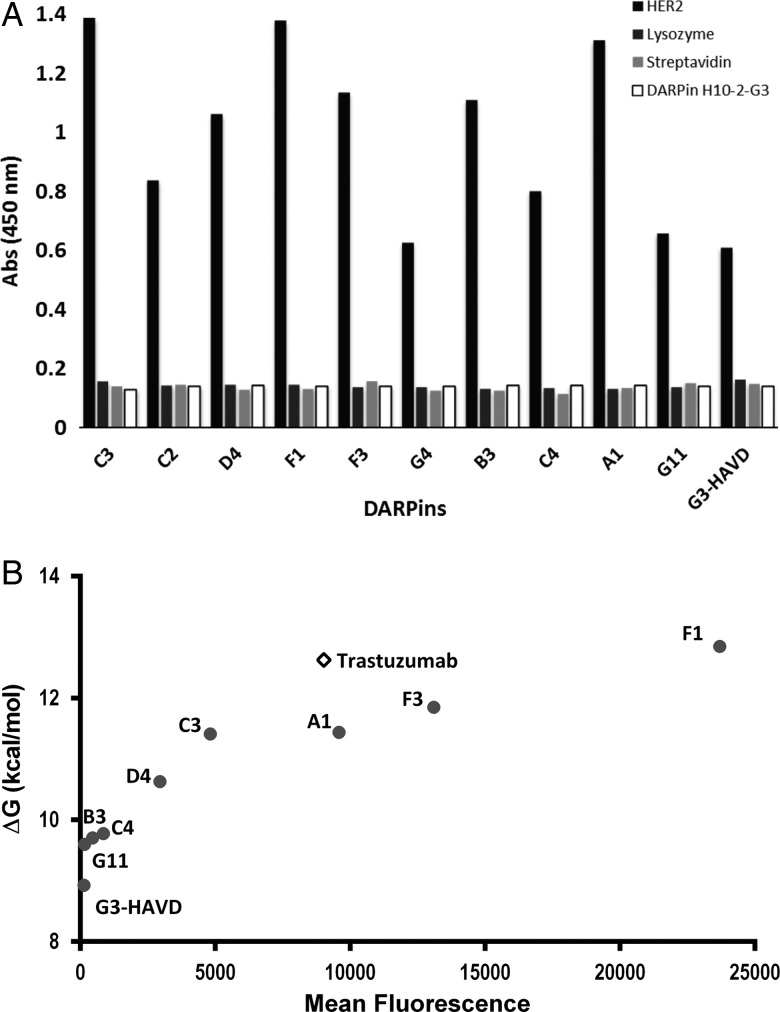
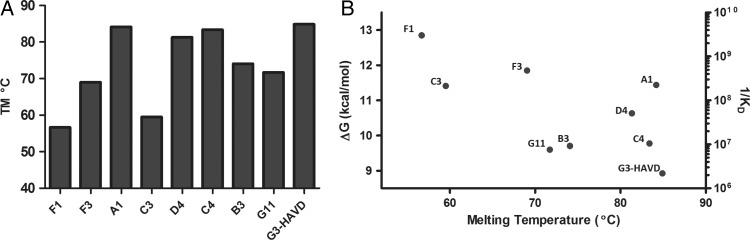
In vitro display technologies have proved to be powerful tools for obtaining high-affinity protein binders. We recently described SNAP display, an entirely in vitro DNA display system that uses the SNAP-tag to link protein with its encoding DNA in water-in-oil emulsions. Here, we apply SNAP display for the affinity maturation of a designed ankyrin repeat proteins (DARPin) that binds to the extracellular domain of HER2 previously isolated by ribosome display. After four SNAP display selection cycles, proteins that bound specifically to HER2 in vitro, with dissociation constants in the low- to sub-nanomolar range, were isolated. In vitro affinities of the panel of evolved DARPins directly correlated with the fluorescence intensities of evolved DARPins bound to HER2 on a breast cancer cell line. A stability trade-off is observed as the most improved DARPins have decreased thermostability, when compared with the parent DARPin used as a starting point for affinity maturation. Dissection of the framework mutations of the highest affinity variant, DARPin F1, shows that functionally destabilising and compensatory mutations accumulated throughout the four rounds of evolution.
Keywords: DARPin; SNAP display; alternative scaffold; antibody; directed evolution; in vitro compartmentalisation; trade-off.
© The Author 2015. Published by Oxford University Press.
Figures
Similar articles
-
An experimental framework for improved selection of binding proteins using SNAP display.J Immunol Methods. 2014 Mar;405:47-56. doi: 10.1016/j.jim.2014.01.006. Epub 2014 Jan 20. J Immunol Methods. 2014. PMID: 24456628
-
A designed ankyrin repeat protein evolved to picomolar affinity to Her2.J Mol Biol. 2007 Jun 15;369(4):1015-28. doi: 10.1016/j.jmb.2007.03.028. Epub 2007 Mar 20. J Mol Biol. 2007. PMID: 17466328
-
DARPins recognizing the tumor-associated antigen EpCAM selected by phage and ribosome display and engineered for multivalency.J Mol Biol. 2011 Nov 4;413(4):826-43. doi: 10.1016/j.jmb.2011.09.016. Epub 2011 Sep 21. J Mol Biol. 2011. PMID: 21963989
-
DARPins: a true alternative to antibodies.Curr Opin Drug Discov Devel. 2007 Mar;10(2):153-9. Curr Opin Drug Discov Devel. 2007. PMID: 17436550 Review.
-
[Ribosome display: Evolution and acellular selection of molecular libraries for high affinity binder generation].Med Sci (Paris). 2020 Aug-Sep;36(8-9):717-724. doi: 10.1051/medsci/2020126. Epub 2020 Aug 21. Med Sci (Paris). 2020. PMID: 32821048 Review. French.
Cited by
-
The Effect of Mutations in the TPR and Ankyrin Families of Alpha Solenoid Repeat Proteins.Front Bioinform. 2021 Jul 6;1:696368. doi: 10.3389/fbinf.2021.696368. eCollection 2021. Front Bioinform. 2021. PMID: 36303725 Free PMC article. Review.
-
Engineered fast-dissociating antibody fragments for multiplexed super-resolution microscopy.Cell Rep Methods. 2022 Sep 20;2(10):100301. doi: 10.1016/j.crmeth.2022.100301. eCollection 2022 Oct 24. Cell Rep Methods. 2022. PMID: 36313806 Free PMC article.
-
Development of a novel anti-HER2 scFv by ribosome display and in silico evaluation of its 3D structure and interaction with HER2, alone and after fusion to LAMP2B.Mol Biol Rep. 2018 Dec;45(6):2247-2256. doi: 10.1007/s11033-018-4386-2. Epub 2018 Sep 17. Mol Biol Rep. 2018. PMID: 30225583
-
The production of the first functional antibody mimetic in higher plants: the chloroplast makes the DARPin G3 for HER2 imaging in oncology.Biol Res. 2022 Oct 23;55(1):32. doi: 10.1186/s40659-022-00400-7. Biol Res. 2022. PMID: 36274167 Free PMC article.
-
Computational design of newly engineered DARPins as HER2 receptor inhibitors for breast cancer treatment.Res Pharm Sci. 2023 Nov 23;18(6):626-637. doi: 10.4103/1735-5362.389950. eCollection 2023 Dec. Res Pharm Sci. 2023. PMID: 39005564 Free PMC article.
References
Publication types
MeSH terms
Substances
LinkOut - more resources
Full Text Sources
Other Literature Sources
Research Materials
Miscellaneous
