. 2015 Aug 14;290(33):20396-406.
doi: 10.1074/jbc.M115.639385. Epub 2015 Jul 1.

Metal Fluoride Inhibition of a P-type H+ Pump: STABILIZATION OF THE PHOSPHOENZYME INTERMEDIATE CONTRIBUTES TO POST-TRANSLATIONAL PUMP ACTIVATION

Affiliations

Metal Fluoride Inhibition of a P-type H+ Pump: STABILIZATION OF THE PHOSPHOENZYME INTERMEDIATE CONTRIBUTES TO POST-TRANSLATIONAL PUMP ACTIVATION

Jesper Torbøl Pedersen et al. J Biol Chem. .

Abstract

The plasma membrane H(+)-ATPase is a P-type ATPase responsible for establishing electrochemical gradients across the plasma membrane in fungi and plants. This essential proton pump exists in two activity states: an autoinhibited basal state with a low turnover rate and a low H(+)/ATP coupling ratio and an activated state in which ATP hydrolysis is tightly coupled to proton transport. Here we characterize metal fluorides as inhibitors of the fungal enzyme in both states. In contrast to findings for other P-type ATPases, inhibition of the plasma membrane H(+)-ATPase by metal fluorides was partly reversible, and the stability of the inhibition varied with the activation state. Thus, the stability of the ATPase inhibitor complex decreased significantly when the pump transitioned from the activated to the basal state, particularly when using beryllium fluoride, which mimics the bound phosphate in the E2P conformational state. Taken together, our results indicate that the phosphate bond of the phosphoenzyme intermediate of H(+)-ATPases is labile in the basal state, which may provide an explanation for the low H(+)/ATP coupling ratio of these pumps in the basal state.

Keywords: H+-ATPase; plasma membrane; post-translational modification (PTM); proton pump; proton transport.


Figures

FIGURE 1.
FIGURE 1.
Detailed reaction sequence of sarco(endo)plasmic reticulum Ca2+-ATPase and PM H+-ATPase. Conformational states that are stabilized by metal fluorides functioning as phosphate analogs are indicated. Such states have been experimentally verified in crystal structures of sarco(endo)plasmic reticulum Ca2+-ATPase (A). Similar states have been hypothesized to exist for PM H+-ATPase (B) as well. Beryllium fluoride mimics the phosphate geometry of the covalently bound tetrahedral ground state E2P. Because of its trigonal bipyramidal shape, aluminum fluoride inhibits the “transition state” of P-type ATPases, which results from water attacking the phosphoenzyme bond. In the presence of ADP, however, the E1P conformational state is stabilized. Because of its tetrahedral nature, magnesium fluoride interacts with the product state of P-type ATPases, which mimics the phosphoenzyme immediately after water attack and with released inorganic phosphate still occluded within the active site (32).
FIGURE 2.
FIGURE 2.
Metal fluoride inhibition of PM H+-ATPase in a direct assay. Metal fluoride inhibition was tested using either the Baginski assay at pH 5.9 (A–D) or the proton pumping assay (E) at pH 6.5. Metal fluoride concentrations were as indicated. The following metal fluorides were tested in the assay: aluminum fluoride (A), beryllium fluoride (B), magnesium fluoride (C), and aluminum fluoride (D) in combination with 1 mm ADP. Plasma membranes containing pumps in either the activated (●, blue line) or basal (□, red line) state were used. Error bars refer to S.E. (n = 3).
FIGURE 3.
FIGURE 3.
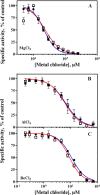
Metal chloride inhibition of PM H+-ATPase in a direct assay. Metal chloride concentrations were as indicated. The following metal chlorides were tested: magnesium chloride (A), aluminum chloride (B), and beryllium chloride (C). Plasma membrane containing pumps in either the activated (●, blue line) or basal (□, red line) state were used. Error bars refer to S.E. (n = 3).
FIGURE 4.
FIGURE 4.
Metal fluoride inhibition of PM H+-ATPase in an indirect assay. Following preincubation for 1 h with metal fluorides (pH 5.9), the inhibition mixture was diluted 100 times and allowed to equilibrate for 1 h before initiation of the PM H+-ATPase assay. Metal fluoride inhibition was determined after preincubation. The following metal fluorides were tested: aluminum fluoride (A–C), beryllium fluoride (D--F), magnesium fluoride (G–I), and aluminum fluoride (J–L) in combination with ADP. Preincubation was carried out at the following pH values: pH 5.9 (A, D, G, and J), pH 6.7 (B, E, H, and K), and pH 7.5 (C, F, I, and L). Plasma membranes containing pumps in either the activated (●, blue line) or basal (□, red line) state were used. Error bars refer to S.E. (n = 3).
FIGURE 5.
FIGURE 5.
Reversibility of metal fluoride inhibition of PM H+-ATPase. Following preincubation for 1 h with metal fluorides (pH 5.9), the inhibition mixture was diluted 200 times concomitantly with initiation of the ATPase assay. At the indicated time points, samples were taken, and specific PM H+-ATPase activity was determined. The following metal fluorides were tested: aluminum fluoride (A), beryllium fluoride (B), magnesium fluoride (C), and aluminum fluoride in combination with ADP (D). Plasma membranes containing pumps in either the activated (●) or basal (□) state were used. The control corresponds to specific activity with 5 mm NaF. Beryllium fluoride inhibition of the pump in the activated state was linearly reversed with koff = 0.005%/s (linear regression; y = 0.005x + 4.5; R2 = 0.888; all time points were included), whereas the basal state had lost 46% inhibition already at the first time point of measurement (30 s), meaning koff ≥ 1.5%/s (linear regression; y = 1.5x; only the first time point was included). Error bars refer to S.E. (n = 2–3).
FIGURE 6.
FIGURE 6.
Proton transport by Pma1p in the activated state requires less energy than in the basal state. Proton transport into lecithin vesicles was determined using quenching of the fluorescent ΔpH sensor ACMA and coupled to hydrolysis of ATP using fluorescence quenching of NADH. Proton transport and ATP hydrolysis were initiated by adding 5 mm ATP (final concentration), and the proton gradient was collapsed by adding nigericin. A, 5.0 μg of reconstituted Pma1p in the activated state (blue dots) showed the same hydrolysis of ATP as 20.0 μg of reconstituted Pma1p in the basal state (red dots). Pma1p (blue line) was able to quench ∼85% of the ACMA signal in the activated state but only 55% in the basal state (red line). B, the protein concentration of the activated state was reduced to test the concentration needed to reach proton pumping equal to that of the basal state. The red curve corresponds to 20.0 μg of reconstituted Pma1p in the basal state, and the blue curves represent reconstituted Pma1p in the activated state with the amount of protein added being 25.0, 5.0, 2.5, 1.3, 0.6, and 0.3 μg, respectively. The fluorescence before the addition of ATP was set to 10%.
FIGURE 7.
FIGURE 7.
Homology model of the phosphorylation (P) and membrane (M) domains of the yeast PM H+-ATPase Pma1p (UniProt accession number P05030) based on the crystal structure of plant AHA2 PM H+-ATPase (Protein Data Bank code 3B8C). Left, ribbon model. Right, space-filling model. The plasma membrane-embedded membrane domain is denoted in gray, whereas the P-domain is marked in green. Asp-378, which is phosphorylated by ATP during catalysis, is indicated in red. Residues that were found to be important for keeping the pump in its basal state and situated on the surface of the P-domain (49, 50) are indicated. The N- and C-terminal domains of the PM+-ATPase are not traceable in AHA2 structures and could therefore not be modeled. For clarity, the actuator and nucleotide-binding domains are omitted from the model.

References

    1. Goffeau A., Slayman C. W. (1981) The proton-translocating ATPase of the fungal plasma membrane. Biochim. Biophys. Acta 639, 197–223 - PubMed
    1. Lefebvre B., Boutry M., Morsomme P. (2003) The yeast and plant plasma membrane H+ pump ATPase: divergent regulation for the same function. Prog. Nucleic Acid Res. Mol. Biol. 74, 203–237 - PubMed
    1. Morth J. P., Pedersen B. P., Buch-Pedersen M. J., Andersen J. P., Vilsen B., Palmgren M. G., Nissen P. (2011) A structural overview of the plasma membrane Na+,K+-ATPase and H+-ATPase ion pumps. Nat. Rev. Mol. Cell Biol. 12, 60–70 - PubMed
    1. Slayman C. L. (1987) The plasma membrane ATPase of Neurospora: a proton-pumping electroenzyme. J. Bioenerg. Biomembr. 19, 1–20 - PubMed
    1. Palmgren M. G., Nissen P. (2011) P-type ATPases. Annu. Rev. Biophys. 40, 243–266 - PubMed

Publication types

MeSH terms

Associated data