. 2015 Aug 21;290(34):20748-20760.
doi: 10.1074/jbc.M115.638023. Epub 2015 Jul 1.

Glutamate Stimulates Local Protein Synthesis in the Axons of Rat Cortical Neurons by Activating α-Amino-3-hydroxy-5-methyl-4-isoxazolepropionic Acid (AMPA) Receptors and Metabotropic Glutamate Receptors

Affiliations

Glutamate Stimulates Local Protein Synthesis in the Axons of Rat Cortical Neurons by Activating α-Amino-3-hydroxy-5-methyl-4-isoxazolepropionic Acid (AMPA) Receptors and Metabotropic Glutamate Receptors

Wei-Lun Hsu et al. J Biol Chem. .

Abstract

Glutamate is the principal excitatory neurotransmitter in the mammalian CNS. By analyzing the metabolic incorporation of azidohomoalanine, a methionine analogue, in newly synthesized proteins, we find that glutamate treatments up-regulate protein translation not only in intact rat cortical neurons in culture but also in the axons emitting from cortical neurons before making synapses with target cells. The process by which glutamate stimulates local translation in axons begins with the binding of glutamate to the ionotropic AMPA receptors and metabotropic glutamate receptor 1 and members of group 2 metabotropic glutamate receptors on the plasma membrane. Subsequently, the activated mammalian target of rapamycin (mTOR) signaling pathway and the rise in Ca(2+), resulting from Ca(2+) influxes through calcium-permeable AMPA receptors, voltage-gated Ca(2+) channels, and transient receptor potential canonical channels, in axons stimulate the local translation machinery. For comparison, the enhancement effects of brain-derived neurotrophic factor (BDNF) on the local protein synthesis in cortical axons were also studied. The results indicate that Ca(2+) influxes via transient receptor potential canonical channels and activated the mTOR pathway in axons also mediate BDNF stimulation to local protein synthesis. However, glutamate- and BDNF-induced enhancements of translation in axons exhibit different kinetics. Moreover, Ca(2+) and mTOR signaling appear to play roles carrying different weights, respectively, in transducing glutamate- and BDNF-induced enhancements of axonal translation. Thus, our results indicate that exposure to transient increases of glutamate and more lasting increases of BDNF would stimulate local protein synthesis in migrating axons en route to their targets in the developing brain.

Keywords: axon; glutamate; local translation; metabotropic glutamate receptor (mGluR); protein synthesis; α-amino-3-hydroxy-5-methyl-4-isoxazolepropionic acid receptor (AMPA receptor, AMPAR).


Figures

FIGURE 1.
FIGURE 1.
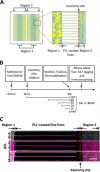
Chip design and experimental procedures. A, schematic presentation of the chip used here. Left panel, chip (1.4 × 1.4 cm) contains a PLL-coated micropattern (blue), consisting of regions 1 and 2 and the lines connecting these two regions, on the surface. Right panel, region enclosed by the square in the left panel at higher magnification. Fifteen to sixteen days after plating neurons (yellow) on the chip, region 2 is almost fully occupied by those axons extending from the neurons in region 1 and migrating along PLL-coated lines. B, experimental procedures for metabolically labeling cultured cortical neurons with AHA and for assaying incorporated AHA moieties. Cells on chips are incubated with methionine-free DMEM for 45 min and then with methionine-free DMEM supplemented with AHA for 2 h. The axons connecting regions 1 and 2 are severed at the position as indicated by the broken red line in A just before the addition of AHA. Lines in the lower part indicate the periods when glutamate or BDNF is present in different experiments. Cells on chips are then subjected to washes and fixation, followed by alkyne-Alexa Fluor 647 tagging and fluorescence immunostaining. C, images obtained from an experiment wherein neurons on the chip surface are assayed by the procedures shown in B. Top and middle images, respectively, show the distributions of Alexa Fluor 647 that tag incorporated AHA moieties and βIII-tubulin immunolabeling in neuronal structures on the chip surface. Bottom image is the merge of the top and middle images. Scale bar, 100 μm.
FIGURE 2.
FIGURE 2.
Enhancements of protein synthesis in cultured rat cortical neurons by treatments with BDNF or glutamate. A, cortical neurons were treated with 100 ng/ml BDNF for 2 h or with 500 μm glutamate (Glu) for 10 min in the presence or absence of 40 μm cycloheximide (CHX) in the medium supplemented with 2 mm AHA. AHA moieties incorporated in proteins were labeled with alkyne-Alexa Fluor 647 (white), and cells were subsequently immunostained by using the antibody to βIII-tubulin (magenta). Scale bar, 20 μm. The results are from a representative experiment of a total of more than five independent experiments. B, quantitative analysis of the fluorescence intensities of Alexa Fluor 647 in neurons as shown in A. Fluorescence intensities of samples were normalized to that of cells kept in AHA-containing medium for 2 h (control). Each datum is the mean ± S.E. of five independent experiments. *, p < 0.05; **, p < 0.01 and ***, p < 0.001 versus the control sample. C, Western blotting analysis of the proteins extracted from cortical neurons subjected to various combinations of treatments, including 500 μm glutamate, 100 ng/ml BDNF, 40 μm cycloheximide, and 2 mm AHA, as indicated at the top. Extracted proteins were labeled with alkyne-biotin, separated by SDS-PAGE on a 12% polyacrylamide gel, electrotransferred to PVDF membrane, and probed with HRP-streptavidin. The same membrane was also probed with the antibody to β-tubulin as the loading control (bottom). Molecular weight markers are indicated to the left. D, quantitative analysis of the summed intensities of the HRP-streptavidin-stained bands of the samples obtained from cells subjected to treatments as shown in C. The summed intensities of samples were normalized to that of the sample obtained from cells kept in AHA-containing medium for 2 h (control). Each datum is the mean ± S.E. of four independent experiments. *, p < 0.05, and **, p < 0.01 versus the control sample. E, effects of CNQX and dl-APV on glutamate-induced enhancement of protein synthesis in cortical neurons. Cortical neurons were treated with 500 mm glutamate for 10 min in the absence or presence of 200 μm CNQX, a non-NMDA receptor antagonist, or 50 μm dl-APV, an NMDA receptor antagonist, or treated with CNQX or dl-APV alone. After treatments, AHA moieties incorporated in neurons were tagged with Alexa Fluor 647, and the Alexa Fluor 647 fluorescence in neurons was quantified by the same procedure as in A and B. Each datum is the mean ± S.E. of three independent experiments. ***, p < 0.001 versus the control or glutamate-treated sample. ns, not significant.
FIGURE 3.
FIGURE 3.
BDNF- and glutamate-induced enhancements of protein synthesis in axons. A, AHA incorporation and p-4EBP1 immunoreactivity in axons in region 2 after treatments with BDNF or glutamate (Glu). Axons of cultured cortical neurons at DIV 15 were severed from their cell bodies, maintained in AHA-containing medium, and then treated with 100 ng/ml BDNF for 2 h or with 500 μm glutamate for 10 min in the presence or absence of 40 μm cycloheximide (CHX) or treated with cycloheximide alone. Axons were reacted with alkyne-Alexa Fluor 647 (white) and then subjected to fluorescence immunostaining with the antibodies to p-4EBP1 (green) and βIII-tubulin (magenta). Axons maintained in AHA-containing medium for 2 h (control) were also treated by the same procedure. The results were from a representative experiment of a total of eight independent experiments. Scale bar, 10 μm. B, relative fluorescence intensities of Alexa Fluor 647 in axons subjected to the treatments as in A. Intensities of Alexa Fluor 647 measured from these samples were normalized by that measured from the control sample. C, relative levels of p-4EBP1 immunoreactivity in axons subjected to treatments as in A. Each datum of B and C is the mean ± S.E. of eight independent experiments. **, p < 0.01, and ***, p < 0.001 versus the control sample; #, p < 0.05 versus the BDNF-treated sample.
FIGURE 4.
FIGURE 4.
Time courses of glutamate- and BDNF-induced enhancements of protein synthesis in axons and the dependence of protein synthesis in axons upon glutamate concentration. A and B, at DIV 15, axons were severed from their cell bodies and treated with 500 μm glutamate (Glu) (A), 100 ng/ml BDNF (B), or PBS vehicle for different lengths of time in the presence of AHA. Afterward, AHA moieties incorporated in axons were tagged with alkyne-Alexa Fluor 647 (white), followed by immunostaining with the antibody to βIII-tubulin (green). Arrows indicate fragmented axons. Scale bars, 10 μm. C, fluorescence intensities of Alexa Fluor 647 in axons after being treated with glutamate (○), BDNF (Δ), or vehicle (●) for different lengths of time were normalized by that measured from axons kept in AHA for 2 h (control). *, p < 0.05 versus samples treated with PBS vehicle for the same lengths of incubation time. D, axons were treated with 100, 200, or 500 μm glutamate for 10 min in the presence of AHA, and the AHA moieties incorporated in axons were tagged with alkyne-Alexa Fluor 647. The fluorescence intensities of Alexa Fluor 647 measured from these samples were normalized by that measured from axons kept in AHA for 2 h. *, p < 0.05 versus the control sample. Each datum of C and D is the mean ± S.E. of three independent experiments.
FIGURE 5.
FIGURE 5.
AMPA receptors mediated glutamate-enhanced protein synthesis in axons. A, axons were disconnected from their cell bodies and then treated with 500 μm glutamate (Glu) or PBS vehicle for 10 min in the presence or absence of 200 μm CNQX or 50 μm dl-APV or treated with 200 μm CNQX or 50 μm dl-APV alone in the presence of AHA. Afterward, AHA moieties in neurons were tagged with alkyne-Alexa Fluor 647. The fluorescence intensities of Alexa Fluor 647 measured from axons subjected to the above treatments were normalized by that measured from axons maintained in AHA-containing medium for 2 h (control). Each datum is the mean ± S.E. of three independent experiments. B, relative fluorescence intensities of Alexa Fluor 647 were measured from axons being treated with 200 μm AMPA or 200 μm NMDA in the presence or absence of 200 μm CNQX or 50 μm dl-APV in the presence of AHA by the same procedure as that used in A. Each datum is the mean ± S.E. of four independent experiments. C, relative fluorescence intensities measured from axons after being treated with 200 μm AMPA or PBS vehicle in presence or absence of 200 μm NASPM or 10 μm GdCl3 for 10 min in the presence of AHA by the same procedure as that used in A. Each datum is the mean ± S.E. of three independent experiments. *, p < 0.05; **, p < 0.01, and ***, p < 0.001 versus the control or stimulated sample. ns, not significant.
FIGURE 6.
FIGURE 6.
AMPA and NMDA receptors in neuronal structures on chip surface. A, fluorescence immunostaining of the axons in region 2 and neurons in region 1 with anti-GluR1 (green) and SMI-312 (magenta) antibodies and labeled with DAPI (blue). B, fluorescence immunostaining of the axons in region 2 and neurons in region 1 with anti-GluN2A/B (green) and SMI-312 (magenta) antibodies and labeled with DAPI (blue). C, left panels, fluorescence immunostaining of the axons in region 2 and neurons in region 1 with anti-GluR1 (green, top row images) and anti-GluN1 (magenta, 2nd row images) antibodies and labeled with DAPI (blue, 3rd row images). The two images at bottom are the areas enclosed by white broken lines in the images above at higher magnification. Right panels, axons in region 2 and neurons in region 1 were incubated with Cy3-conjugated goat anti-rabbit IgG (green, top images) and Alexa Fluor 488-conjugated goat anti-mouse IgG (2nd row images) and labeled with DAPI (3rd row images). Scale bars, 20 μm.
FIGURE 7.
FIGURE 7.
Metabotropic glutamate receptors mediated glutamate-induced enhancements of protein synthesis in axons. A, axons were treated with 500 μm glutamate for 10 min in the absence or presence of 300 μm dl-AP3, a group I mGluR antagonist; 1 μm LY341495, a group II mGluR antagonist; or 1 μm CPPG, a group III mGluR antagonist, or treated with 300 μm dl-AP3, 1 μm LY341495; or 1 μm CPPG alone for 10 min in the presence of AHA. Afterward, the AHA moieties incorporated in neurons were tagged with alkyne-Alexa Fluor 647. The fluorescence intensities of Alexa Fluor 647 measured from the above samples were normalized by that of axons kept in AHA-containing medium for 2 h (control). B, relative fluorescence intensities of Alexa Fluor 647 in axons being treated with 100 μm RS)-2-chloro-5-hydroxyphenylglycine, a selective mGluR5 agonist, or 100 μm (S)-3,5-DHPG, a selective group I mGluRs agonist, in the presence or absence of 10 μm 3-MATIDA, a mGluR1 antagonist, or 10 μm MTEP hydrochloride, a mGlu5 antagonist, in the presence of AHA, as calculated by the same procedure as that used in A. C, relative fluorescence intensities of Alexa Fluor 647 in axons being treated with 100 μm (S)-3,5-DHPG in the absence or presence of 100 nm rapamycin, 50 μm W7, or 30 μm SKF96365, as calculated by the same procedure as that used in A. D, relative fluorescence intensities of Alexa Fluor 647 in axons being treated with 100 μm (S)-3,5-DHPG in the absence or presence of 50 μm dl-APV or 200 μm CNQX in the presence of AHA by the same procedure as that used in A. Each datum is the mean ± S.E. of three independent experiments. *, p < 0.05; **, p < 0.01 and ***, p < 0.001 versus the control or stimulated sample.
FIGURE 8.
FIGURE 8.
A, Ca2+ and the mTOR signaling mediated glutamate (Glu)- and BDNF-induced enhancements of protein synthesis in axons. Axons were severed from their cell bodies and then treated with 500 μm glutamate for 10 min or 100 ng/ml BDNF for 2 h in the absence or presence of 1.8 mm EGTA, 30 μm SKF96365, 50 μm W7, or 100 nm rapamycin in the medium containing AHA. Axons were also treated with 1.8 mm EGTA, 30 μm SKF96365, 50 μm W7, or 100 nm rapamycin in the medium containing AHA for 2 h alone. Afterward, AHA moieties incorporated in axons were tagged with alkyne-Alexa Fluor 647. B, glutamate and BDNF do not produce additive effects on the protein synthesis in axons. Severed axons were treated with 500 μm glutamate for 10 min, 100 ng/ml BDNF for 2 h, 100 ng/ml BDNF for 2 h with 500 μm glutamate being added at the last 10 min, 100 ng/ml BDNF for 2 h in the presence of 200 μm CNQX, or 100 ng/ml BDNF for 2 h in the presence of 50 μm dl-APV in the medium containing AHA. Afterward, AHA moieties incorporated in axons were tagged with alkyne-Alexa Fluor 647. The fluorescence intensities measured from the above samples were normalized by those measured from axons being kept in AHA-containing medium for 2 h (control). Each datum is the mean ± S.E. of three independent experiments. **, p < 0.01; ***, p < 0.001 versus the drug-treated sample.
FIGURE 9.
FIGURE 9.
Model of the signaling paths mediating glutamate- and BDNF-induced enhancements of local protein synthesis in the axon. Glutamate first activates both AMPA receptors (R) and mGlu receptors on the plasma membrane of axons. This results in Ca2+ influxes into the axon via activated calcium-permeable AMPA receptors (CP-AMPARs), voltage-gated calcium channels (VGCC), and transient potential receptor canonical (TRPC) channels. Ca2+ binds calmodulin (CaM) in the cytoplasm, and the resultant complex interacts with various components of the translation machinery and stimulates protein synthesis. In addition, activation of mGlu receptors leads to the stimulation of mTOR path and, consequently, the phosphorylation of 4EPB1, thereby releasing eIF4E to participate in translation initiation. BDNF is depicted here to bind the TrkB receptor on the plasma membrane and next leads to the activation of TRPC channels as well as mTOR signaling path. The resultant Ca2+ influxes and phosphorylation of 4EBP1 also enhance protein synthesis in the axon.

Similar articles

Cited by

References

    1. Gordon-Weeks P. R. (2005) Developmental and Cell Biology Series (No. 37), Cambridge University Press, Cambridge, UK
    1. Bashaw G. J., Klein R. (2010) Signaling from axon guidance receptors. Cold Spring Harb. Perspect. Biol. 2, a001941. - PMC - PubMed
    1. Schmitz Y., Luccarelli J., Kim M., Wang M., Sulzer D. (2009) Glutamate controls growth rate and branching of dopaminergic axons. J. Neurosci. 29, 11973–11981 - PMC - PubMed
    1. Brewer G. J., Cotman C. W. (1989) NMDA receptor regulation of neuronal morphology in cultured hippocampal neurons. Neurosci. Lett. 99, 268–273 - PubMed
    1. Zheng J. Q., Wan J. J., Poo M. M. (1996) Essential role of filopodia in chemotropic turning of nerve growth cone induced by a glutamate gradient. J. Neurosci. 16, 1140–1149 - PMC - PubMed

Publication types

MeSH terms