Predominant contribution of cis-regulatory divergence in the evolution of mouse alternative splicing
- PMID: 26134616
- PMCID: PMC4547845
- DOI: 10.15252/msb.20145970
Predominant contribution of cis-regulatory divergence in the evolution of mouse alternative splicing
Abstract
Divergence of alternative splicing represents one of the major driving forces to shape phenotypic diversity during evolution. However, the extent to which these divergences could be explained by the evolving cis-regulatory versus trans-acting factors remains unresolved. To globally investigate the relative contributions of the two factors for the first time in mammals, we measured splicing difference between C57BL/6J and SPRET/EiJ mouse strains and allele-specific splicing pattern in their F1 hybrid. Out of 11,818 alternative splicing events expressed in the cultured fibroblast cells, we identified 796 with significant difference between the parental strains. After integrating allele-specific data from F1 hybrid, we demonstrated that these events could be predominately attributed to cis-regulatory variants, including those residing at and beyond canonical splicing sites. Contrary to previous observations in Drosophila, such predominant contribution was consistently observed across different types of alternative splicing. Further analysis of liver tissues from the same mouse strains and reanalysis of published datasets on other strains showed similar trends, implying in general the predominant contribution of cis-regulatory changes in the evolution of mouse alternative splicing.
Keywords: alternative splicing; cis‐regulation; evolution.
© 2015 The Authors. Published under the terms of the CC BY 4.0 license.
Figures


A MA plot comparing the PSI values in parental strains and their downsampling datasets. The local standard deviation for each comparison was also indicated (see Materials and Methods).
B MA plot comparing the PSI values in parental strains and those estimated based on mock F1 dataset. The red dots represented the outliers with inconsistent PSI values between parental strain and mock F1 dataset.
C–E After filtering, the PSI values for C57BL/6J (C), SPRET/EiJ (D), and their difference (E) correlated well between parental strains and mock F1 hybrid (R2 = 0.99, 0.99 and 0.94, respectively).


Scatterplot comparing parental splicing differences (dots, denoted as F0 hereafter) or allelic splicing differences (triangles) estimated based on Illumina RNA-seq results (y-axis) to those based on PacBio sequencing of splicing event-spanning cDNA products (x-axis) (R2 = 0.91 and 0.92 for comparison of parental and allelic difference, respectively).
Scatterplot comparing splicing difference in parental strains (y-axis) versus the allelic difference in F1 hybrid (x-axis). After filtering using mock F1 hybrid, 5,802 AS events were expressed in F1 hybrid (gray dots). Among these, 417 AS events were divergent between parental strains (black dots), of which 255 (indicated as “+”) and 62 (indicated as “×”) exhibited significant cis- and trans-regulatory divergence, respectively.
Examples of cis (upper panel)- and trans (lower panel)-regulatory divergence in alternative splicing. The RNA-seq read densities supporting the inclusion and exclusion of exons were shown in the left plot. The estimated PSI values and 95% confidence intervals were shown in the right plot.
Percentage of cis- and trans-divergent events for the five AS types separately (numbers of events for each type were indicated above bars).

A–C Scatterplot comparing splicing differences in parental strains (y-axis) versus the allelic differences in F1 hybrid (x-axis) at different |ΔPSI| cutoffs [|ΔPSI| > 0 (A), 0.05 (B) and 0.15 (C)]. After filtering using mock F1 hybrid, 5,802 AS events were expressed in F1 hybrid (gray dots). Among these, 615 (A)/530 (B)/336 (C) AS events were divergent between parental strains (black dots), of which 376 (A)/320 (B)/209 (C) (indicated as “+”) and 115 (A)/86 (B)/43 (C) (indicated as “×”) exhibited significant cis- and trans-regulatory divergence, respectively.
D–F Percentage of cis- and trans-divergent events for the five AS types separately at different |ΔPSI| cutoffs [|ΔPSI| > 0 (D), 0.05 (E), and 0.15 (F)].
G Contributions of cis (indicated as triangle)-/trans (indicated as circle)-regulatory divergence (y-axis) to parental divergent AS events with different effect sizes (|ΔPSI|, x-axis). A total of 417 divergent events between parental strains (see Fig2B) were grouped into 7 categories according to the |ΔPSI| values: (0.1, 0.2), (0.2, 0.3), (0.3, 0.4), (0.4, 0.5), (0.5, 0.6), (0.6, 0.7), and (0.7, 1.0). The number of events in each category was marked. While cis-regulatory divergence always played the predominant role in determining parental AS divergence with different effect sizes, its relative contribution slightly decreased with the decreasing effect size.

A, B Venn diagram showing the overlap of the divergent events identified by Fisher’s exact test and MISO in parental strains (A) and in F1 hybrid (B).
C Scatterplot comparing splicing difference in parental strains versus the allelic difference in F1 hybrid identified by Fisher’s exact test. After filtering using mock F1 hybrid, 5,802 AS events were expressed in F1 hybrid (gray dots). Among these, 626 AS events were divergent between parental strains (black dots), of which 357 (indicated as “+”) and 72 (indicated as “×”) exhibited significant cis- and trans-regulatory divergence, respectively.
D Percentage of cis- and trans-divergent events for the five AS types separately using Fisher’s exact test.

Scatterplot comparing splicing difference between C57BL/6J and SPRET/EiJ liver samples versus their allelic difference in F1 hybrid liver sample. After filtering using mock F1 hybrid, 4,124 AS events were expressed in F1 hybrid (gray dots). Among these, 336 AS events were divergent between parental strains (black dots), of which 196 (indicated as “+”) and 38 (indicated as “×”) exhibited significant cis- and trans-regulatory divergence, respectively.
Percentage of cis- and trans-divergent events for the five AS types separately.

Scatterplot comparing splicing difference between C57BL/6J and CAST/EiJ versus their allelic difference in F1 hybrid. After filtering using mock F1 hybrid, 2,042 AS events were expressed in F1 hybrid (gray dots). Among these, 79 AS events were divergent between parental strains (black dots), of which 44 (indicated as “+”) and 6 (indicated as “×”) exhibited significant cis- and trans-regulatory divergence, respectively.
Percentage of cis- and trans-divergent events for the five AS types separately.


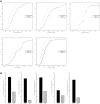
The cumulative distribution function (CDF) of frequencies of nucleotide variants in the AS flanking regions for the events with cis-regulatory divergence (black) and controls (grey). Compared with controls, the events with significant cis-regulatory impact had higher sequence divergence in the flanking regions. The P-values were calculated by the Mann–Whitney U-test.
36.2 and 11.5% of the events with significant cis-regulatory divergence (black) and control events (gray) had sequence divergence at their exact splice sites, respectively (***P = 9.21e-14, Fisher’s exact test).
CDF of allelic differences in splicing site strengths due to sequence variants at the exact splicing sites plotted for cis-regulatory divergent events (black) and control events (grey), separately. The splicing site strengths changed more in the events with cis-regulatory events than in those without. The P-values were calculated by the Mann–Whitney U-test.
An example showing that a SNV at the canonical GU/AG sites (indicated as an arrow) resulted in complete functional abortion of the corresponding splice sites. The substitution of the AG to GG in SPRET/EiJ disrupted the splicing site and thereby facilitated the use of a downstream splicing acceptor.

CDF of frequencies of nucleotide variants in the AS flanking regions for the events with cis-regulatory divergence (black) and controls (grey) for A3SS, A5SS, MXE, RI, and SE, respectively.
Percentages of the events with significant cis-regulatory divergence (black) and controls events (gray) that had sequence divergence at the exact splice sites for A3SS, A5SS, MXE, RI, and SE, respectively.

CDF of frequencies of nucleotide variants in the AS flanking regions for the events with cis-regulatory divergence (black) and controls (grey) identified in liver sample. Compared with controls, the events with significant cis-regulatory impact also had higher sequence divergence in the flanking regions.
In liver sample, 37.0 and 10.8% of the events with significant cis-regulatory divergence (black) and controls (gray) had sequence divergence at the exact splice sites, respectively.
CDF of allelic differences in splicing site strengths due to sequence variants at the exact splicing sites plotted for cis-regulatory divergent events (black) and controls (grey) identified in liver sample. The splicing site strengths changed more in the events with cis-regulatory events than in those without.


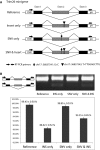
Schematic diagrams of minigene constructs for validating the cis-divergent SE event identified in Trim26 gene. Two candidate variants, one SNV and one insertion (INS), were indicated. Four constructs were prepared in C57BL/6J background with no variant, only insertion, only SNV, and both insertion and SNV, respectively (see Materials and Methods).
Minigene assays of the four constructs transfected into HEK293T cells suggested only the insertion contributed to this divergent SE event. The gel image illustrated RT–PCR products from these constructs. The barplot below the gel image represented the PSI values calculated from triplicates of RT–PCR products using Agilent Bioanalyzer 2000 system (see Materials and Methods, for minigene assays in NIH3T3 cells, see FigEV12).

Similar articles
-
Global analysis of regulatory divergence in the evolution of mouse alternative polyadenylation.Mol Syst Biol. 2016 Dec 8;12(12):890. doi: 10.15252/msb.20167375. Mol Syst Biol. 2016. PMID: 27932516 Free PMC article.
-
Evolution of splicing regulatory networks in Drosophila.Genome Res. 2014 May;24(5):786-96. doi: 10.1101/gr.161521.113. Epub 2014 Feb 10. Genome Res. 2014. PMID: 24515119 Free PMC article.
-
Extensive compensatory cis-trans regulation in the evolution of mouse gene expression.Genome Res. 2012 Dec;22(12):2376-84. doi: 10.1101/gr.142281.112. Epub 2012 Aug 23. Genome Res. 2012. PMID: 22919075 Free PMC article.
-
Quantitative regulation of alternative splicing in evolution and development.Bioessays. 2009 Jan;31(1):40-50. doi: 10.1002/bies.080092. Bioessays. 2009. PMID: 19154001 Review.
-
The evolution of posttranscriptional regulation.Wiley Interdiscip Rev RNA. 2018 Sep;9(5):e1485. doi: 10.1002/wrna.1485. Epub 2018 May 31. Wiley Interdiscip Rev RNA. 2018. PMID: 29851258 Review.
Cited by
-
Alternative splicing contributes to plasticity and regulatory divergence in locally adapted house mice from the Americas.bioRxiv [Preprint]. 2025 Jul 7:2025.07.03.662996. doi: 10.1101/2025.07.03.662996. bioRxiv. 2025. PMID: 40672278 Free PMC article. Preprint.
-
Regulatory Divergence of Transcript Isoforms in a Mammalian Model System.PLoS One. 2015 Sep 4;10(9):e0137367. doi: 10.1371/journal.pone.0137367. eCollection 2015. PLoS One. 2015. PMID: 26339903 Free PMC article.
-
Cis-regulatory differences in isoform expression associate with life history strategy variation in Atlantic salmon.PLoS Genet. 2020 Sep 30;16(9):e1009055. doi: 10.1371/journal.pgen.1009055. eCollection 2020 Sep. PLoS Genet. 2020. PMID: 32997662 Free PMC article.
-
Branch point strength controls species-specific CAMK2B alternative splicing and regulates LTP.Life Sci Alliance. 2022 Dec 21;6(3):e202201826. doi: 10.26508/lsa.202201826. Print 2023 Mar. Life Sci Alliance. 2022. PMID: 36543542 Free PMC article.
-
Transcriptome-Wide Analyses Identify Dominant as the Predominantly Non-Conservative Alternative Splicing Inheritance Patterns in F1 Chickens.Front Genet. 2021 Dec 3;12:774240. doi: 10.3389/fgene.2021.774240. eCollection 2021. Front Genet. 2021. PMID: 34925458 Free PMC article.
References
-
- Barbosa-Morais NL, Irimia M, Pan Q, Xiong HY, Gueroussov S, Lee LJ, Slobodeniuc V, Kutter C, Watt S, Colak R, Kim T, Misquitta-Ali CM, Wilson MD, Kim PM, Odom DT, Frey BJ, Blencowe BJ. The evolutionary landscape of alternative splicing in vertebrate species. Science. 2012;338:1587–1593. - PubMed
-
- Cutter AD. Divergence times in Caenorhabditis and Drosophila inferred from direct estimates of the neutral mutation rate. Mol Biol Evol. 2008;25:778–786. - PubMed
Publication types
MeSH terms
Substances
LinkOut - more resources
Full Text Sources
Other Literature Sources

