Review
. 2015 Jul 21;60(14):R239-69.
doi: 10.1088/0031-9155/60/14/R239. Epub 2015 Jul 2.

Quantitative in vivo cell-surface receptor imaging in oncology: kinetic modeling and paired-agent principles from nuclear medicine and optical imaging

Affiliations
Review

Quantitative in vivo cell-surface receptor imaging in oncology: kinetic modeling and paired-agent principles from nuclear medicine and optical imaging

Kenneth M Tichauer et al. Phys Med Biol. .

Abstract

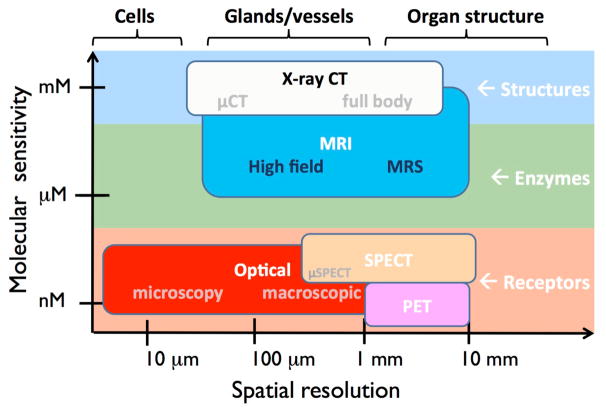
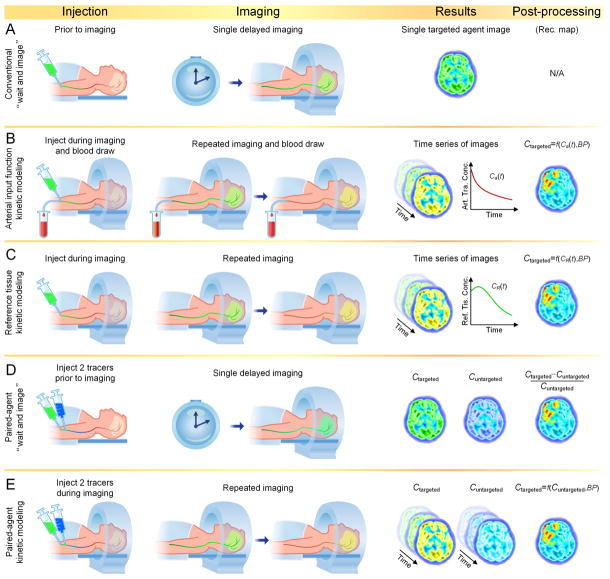
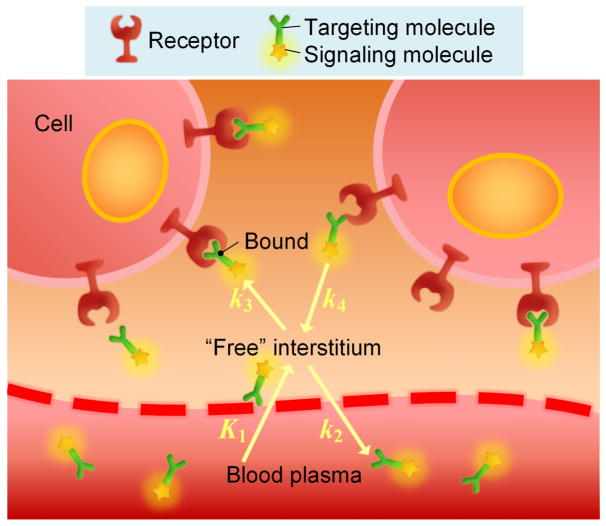
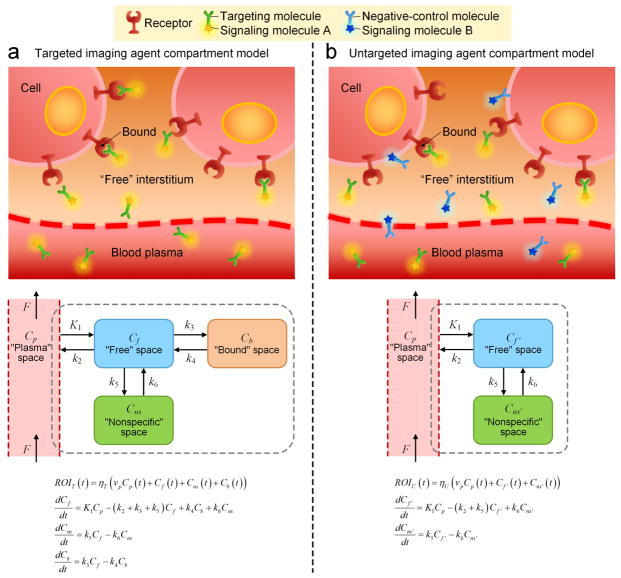
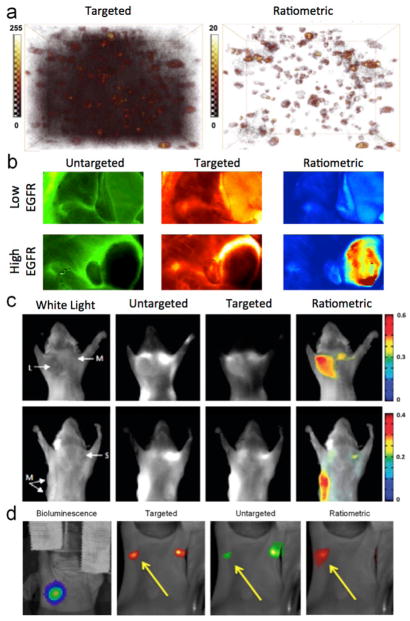
The development of methods to accurately quantify cell-surface receptors in living tissues would have a seminal impact in oncology. For example, accurate measures of receptor density in vivo could enhance early detection or surgical resection of tumors via protein-based contrast, allowing removal of cancer with high phenotype specificity. Alternatively, accurate receptor expression estimation could be used as a biomarker to guide patient-specific clinical oncology targeting of the same molecular pathway. Unfortunately, conventional molecular contrast-based imaging approaches are not well adapted to accurately estimating the nanomolar-level cell-surface receptor concentrations in tumors, as most images are dominated by nonspecific sources of contrast such as high vascular permeability and lymphatic inhibition. This article reviews approaches for overcoming these limitations based upon tracer kinetic modeling and the use of emerging protocols to estimate binding potential and the related receptor concentration. Methods such as using single time point imaging or a reference-tissue approach tend to have low accuracy in tumors, whereas paired-agent methods or advanced kinetic analyses are more promising to eliminate the dominance of interstitial space in the signals. Nuclear medicine and optical molecular imaging are the primary modalities used, as they have the nanomolar level sensitivity needed to quantify cell-surface receptor concentrations present in tissue, although each likely has a different clinical niche.


Figures

Figure 1
Figure 1
Comparison of dominant medical imaging modalities with respect to molecular sensitivity (lowest concentration of an imaging reporter that can be accurately detected in a medium) and spatial resolution. Note that while optical imaging is capable of cellular and sub-cellular-level spatial resolution, this comes at the price of a reduced imaging depth in tissues (Leigh et al., 2014).
Figure 2
Figure 2
Variability of imaging-agent delivery and non-specific retention in tumors. (a) Example of an untargeted fluorescent imaging agent, indocyanine green (ICG), exhibiting preferential uptake and retention in an orthotopic mouse model of ovarian cancer. Obvious contrast can be seen by 6 h post-intravenous injection of the ICG (Kosaka et al., 2011). (b) Transverse (Trans.) and coronal PET images of 89Zr-labeled albumin – in three different tumor xenografts (CWR22rv1, DU-145, and PC-3) on the right and left flanks of mice – demonstrate large variability in enhanced permeability and retention (EPR) between tumor phenotypes (Heneweer et al., 2011). (c) Fluorescence image of an epidermal growth factor receptor (EGFR)-targeted imaging agent in a tumor xenograft with no EGFR expression (EGFR-; left) and a tumor with high EGFR expression (EGFR++; right) at 1 h post injection. Overall tumor uptake was considerably higher in the EGFR- tumor compared to the EGFR++ tumor, demonstrating that nonspecific uptake confounds the relationship between targeted tracer uptake and receptor concentration (Tichauer et al., 2012c). The locations of the tumors are indicated by the white arrows.
Figure 3
Figure 3
Summary of methods to quantify cell-surface receptor concentrations in vivo using molecular imaging. Row A presents the dominant method in cancer imaging, the “wait and image” approach where a targeted imaging agent is injected and imaging is carried out after unbound agent is allowed to wash out. The imaged distribution of the remaining agent is presumed to reflect the distribution of the targeted receptor. Row B represents arterial-input-function-driven kinetic modeling of the temporal dynamics of a targeted imaging agent (from repeated imaging over time). Mathematical models associating tissue time-concentration curves with the arterial input function [Ca(t)] are used to estimate and map the binding potential (BP), a parameter that is proportional to receptor concentration. Such approaches typically require invasive arterial blood sampling during imaging and have troubles decoupling hemodynamic effects from specific-binding effects on the dynamics of imaging agents. Row C represents reference-tissue-input-function-driven kinetic modeling approaches that estimate BP by employing the time-concentration curve of a targeted imaging agent in a tissue devoid of targeted receptor [CR(t)] as a surrogate of the arterial input function. Such approaches benefit from not requiring blood sampling; however, the hemodynamics of the reference tissue must be representative of all other tissues of interest for the approach to be relevant (a poor assumption for tumor imaging). Row D represents a “paired-agent” approach for estimating BP. This methodology requires the simultaneous injection of targeted and untargeted imaging agents that have similar kinetic characteristics and nonspecific binding properties. The concentration maps of the targeted imaging agent can be normalized by the map of the untargeted imaging agent to account for nonspecific effects and to calculate BP. Row E represents a more sophisticated version of the paired-agent approach illustrated in row D, using kinetic imaging data and the mathematical models derived for reference-tissue-input imaging to estimate BP. This final method can provide the most accurate and precise estimations of BP if an ideal untargeted imaging agent is utilized that allows all nonspecific effects to be accounted for.
Figure 4
Figure 4
Distribution of a molecular targeted imaging agent in tissue. At any time, the concentration of an injected agent in tissue is in a dynamic balance between at least three “compartments:” the blood (specifically the blood plasma volume), the extravascular interstitial “free” space, and the “bound” space (bound to targeted cell-surface receptors). Rate constants K1 and k2 govern the rate of imaging agent delivery from the blood plasma to the tissue and washout of the agent from the tissue to the blood plasma, respectively. Rate constants k3 and k4 govern the rate of imaging agent receptor binding and receptor dissociation, respectively.
Figure 5
Figure 5
Basic principles of kinetic compartment modeling of imaging agents that (a) reversibly target cell-surface receptors in tumors or (b) are used as untargeted controls. These form the basis for all kinetic modeling used to estimate or quantify cell-surface receptor concentrations. The drawings at the top illustrate where targeted and untargeted imaging agents are distributed in tissue (in this case, assuming no nonspecific binding). Compartment models are depicted in the box diagrams below the drawings. A three-compartment model is used for the targeted imaging agent while a two-compartment model (without specific binding) is utilized for the untargeted imaging agents. Both compartment models are driven by an input function that describes the concentration of the imaging agents in the blood plasma (Cp), which is assumed to be identical for the targeted and untargeted imaging agent. The rate constants K1 and k2 represent transport of the imaging agent from the blood plasma to the tissue and back, respectively. K1 is intentionally capitalized to emphasize that it is unique from the other rate constants in that it can be dependent on the blood flow (F). The rate constants k3/k4 and k5/k6 govern association/dissociation of the agent with specific and nonspecific receptors, respectively (note: k4 = 0 for irreversible binding). The dashed line encompassing the three tissue compartments, and a fraction of the blood plasma, reflects the fact that a pixel in a molecular image will include signal from all three compartments and part of the blood plasma (depending on the fractional volume of the pixel that is blood). The systems of equations can be solved in numerous ways to estimate or directly calculate the binding potential (BP = k3/k4), which is proportional to receptor concentration for agents that exhibit reversible binding, or to estimate k3, which is proportional to receptor concentration for agents that exhibit irreversible binding.
Figure 6
Figure 6
Paired-agent imaging applications. (a) Three-dimensional microscopy of a human epidermal growth factor receptor 2 (HER2)-targeted fluorescent contrast agent used to stain HER2-positive tumor cells suspended in a 3D matrix (Liu et al., 2009). The left image shows the signal from the HER2-targeted imaging agent, displaying significant nonspecific uptake in the surrounding matrix. The figure on the right demonstrates that HER2-positive cells are more readily identified when normalizing the signal from the HER2-targeted imaging agent by the uptake of an untargeted imaging agent. (b) Temporal uptakes of an epidermal growth factor receptor (EGFR)-targeted imaging agent and an untargeted imaging agent in a low EGFR-expressing tumor line, 9L rat gliosarcoma (top row) and a high EGFR-expressing tumor line, A431 human epidermoid (bottom row). Higher retention of the targeted imaging agent is apparent in the low-EGFR tumor compared to the high-EGFR tumor. Quantitative analysis of the binding potential from the targeted (red-scale images) and untargeted imaging agents (green-scale images) can be used to map receptor concentration (Tichauer et al., 2012c). (c) White-light images of large (L), medium (M), and small (S) tumors in a transgenic breast cancer mouse model (first column). Angiosense uptake, acting as an untargeted imaging agent, is presented in the second column. In the third column, either tumor-specific Prosense (top row) or MMPsense (bottom row) enzyme-activated fluorescence is visualized. Tumor location only becomes obvious by normalizing the enzyme-activated fluorescence images to the Angiosense images [fourth column of images] (Baeten et al., 2009). (d) Application of paired-agent imaging for the detection of microscopic cancer burden in tumor-draining lymph nodes. A bioluminescence image on the left demonstrates the presence of metastatic bioluminescent human breast cancer tumor cells in the right axillary lymph node of an athymic mouse. EGFR-targeted imaging agent uptake is similar in both the right and left axillary lymph nodes upon injection in the front footpad (second image); however, by normalizing the targeted agent uptake with untargeted agent uptake (third image), the affected lymph node is clearly delineated. As few as 200 cells were detectable using the paired-agent method in this model (Tichauer et al., 2014c).

Similar articles

Cited by

References

    1. Molecular Imaging: Principles and Practice. Shelton, CT: People’s Medical Publishing House (PMPH) - USA; 2010.
    1. Allen TM, Cullis PR. Drug delivery systems: entering the mainstream. Science. 2004;303:1818–22. - PubMed
    1. Annis DA, Shipps GW, Jr, Deng Y, Popovici-Muller J, Siddiqui MA, Curran PJ, Gowen M, Windsor WT. Method for quantitative protein-ligand affinity measurements in compound mixtures. Analytical chemistry. 2007;79:4538–42. - PubMed
    1. Ardeshirpour Y, Hassan M, Zielinski R, Horton JA, Capala J, Gandjbakhche AH, Chernomordik V. In Vivo Assessment of HER2 Receptor Density in HER2-positive Tumors by Near-infrared Imaging, Using Repeated Injections of the Fluorescent Probe. Technology in cancer research & treatment. 2014;13:427–34. - PMC - PubMed
    1. Baeten J, Haller J, Shih H, Ntziachristos V. In vivo investigation of breast cancer progression by use of an internal control. Neoplasia. 2009;11:220–7. - PMC - PubMed

Publication types

Substances

LinkOut - more resources