. 2015 Jul 1;35(26):9544-57.
doi: 10.1523/JNEUROSCI.5117-14.2015.

Parvalbumin-Positive Inhibitory Interneurons Oppose Propagation But Favor Generation of Focal Epileptiform Activity

Affiliations

Parvalbumin-Positive Inhibitory Interneurons Oppose Propagation But Favor Generation of Focal Epileptiform Activity

Michele Sessolo et al. J Neurosci. .

Abstract

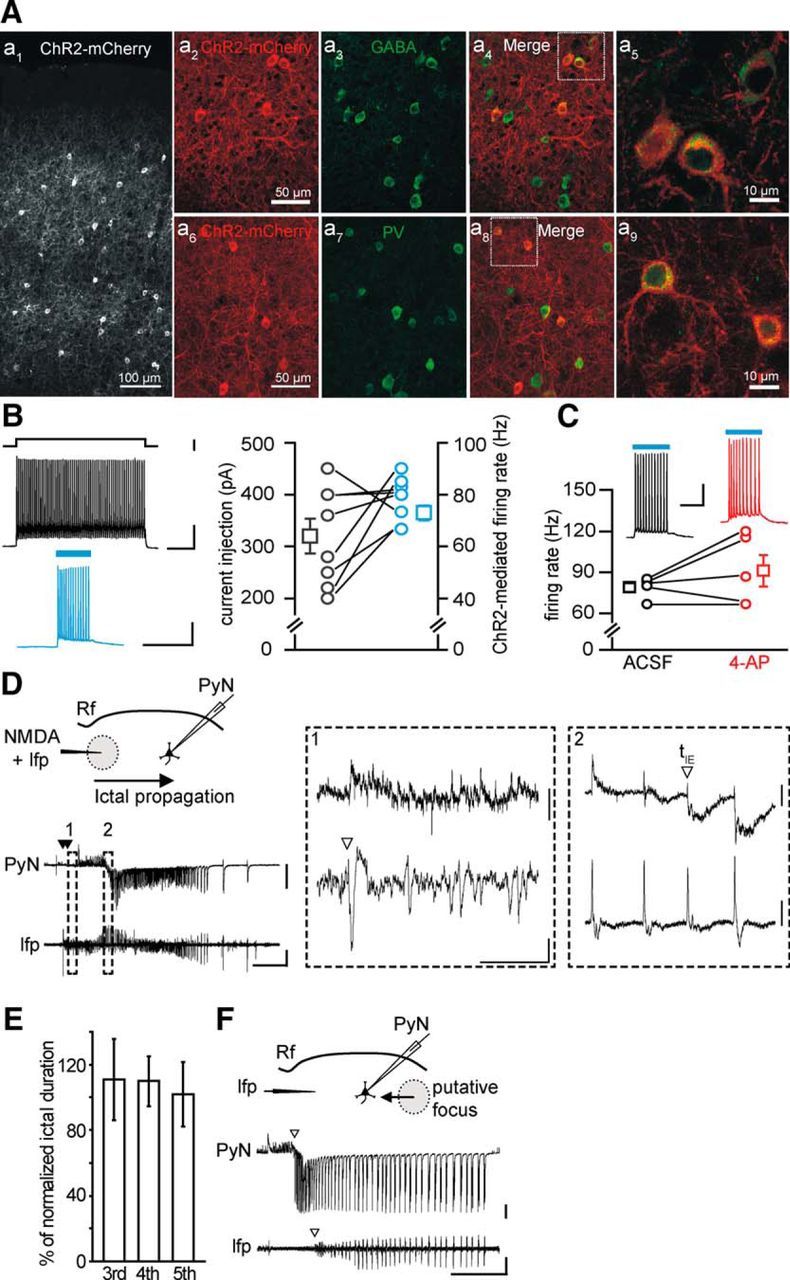
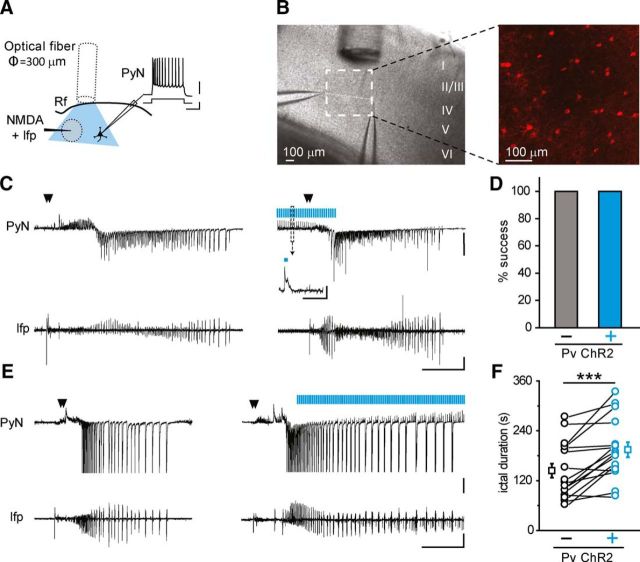
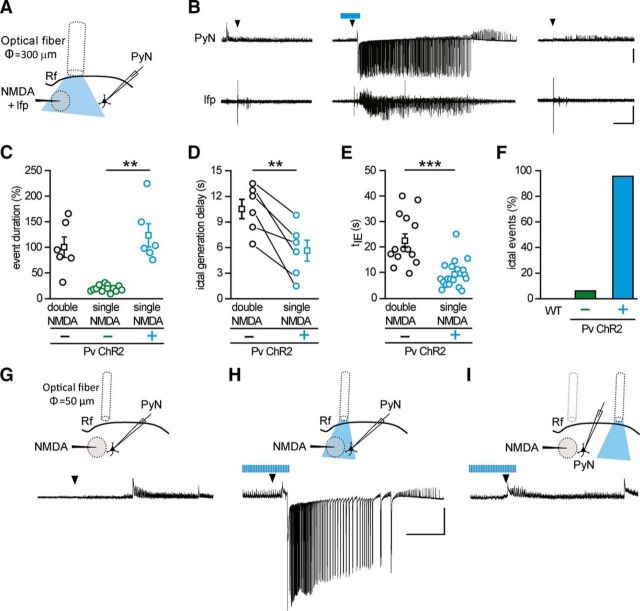
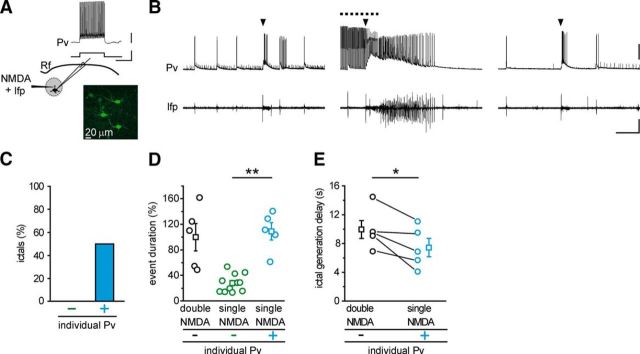
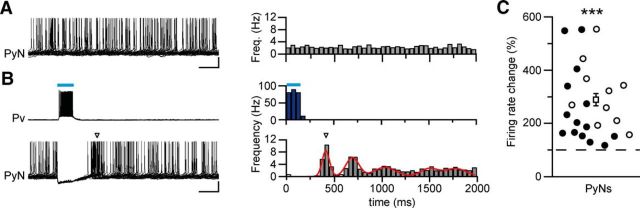
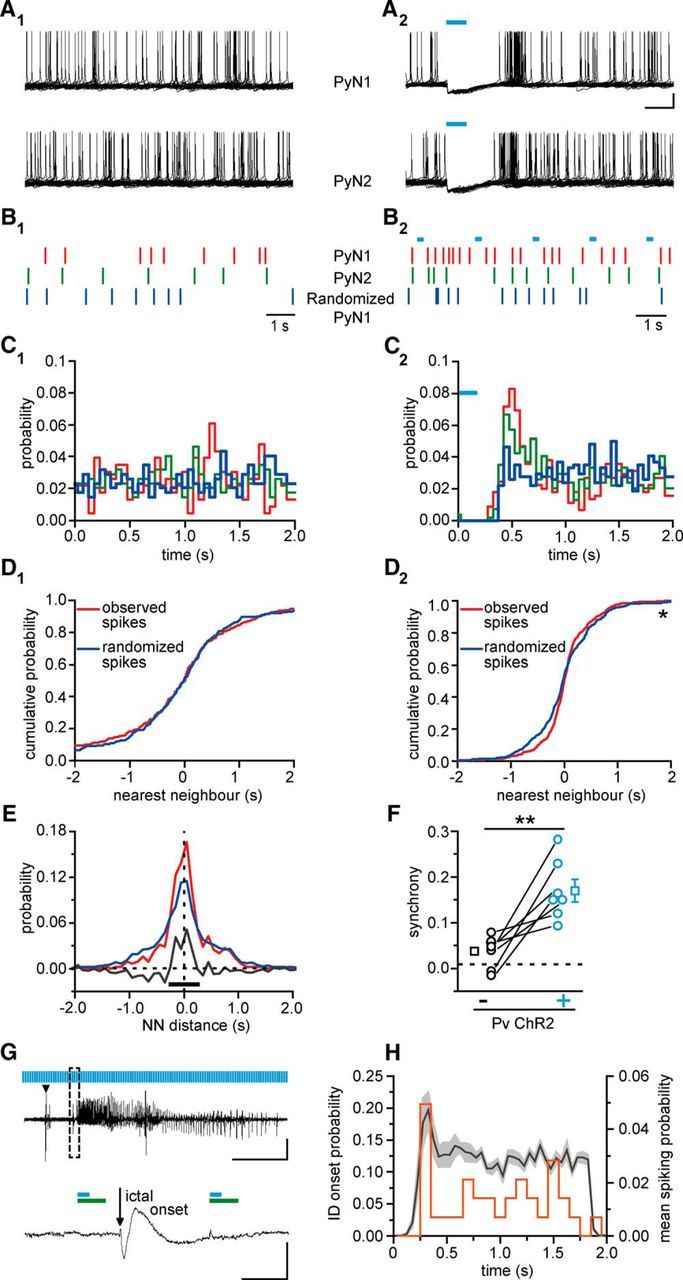
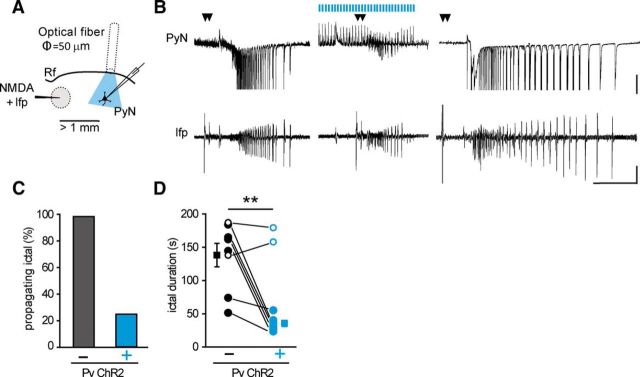
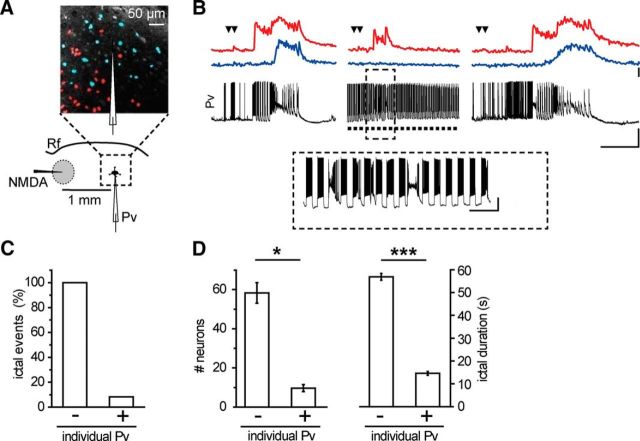
Parvalbumin (Pv)-positive inhibitory interneurons effectively control network excitability, and their optogenetic activation has been reported to block epileptic seizures. An intense activity in GABAergic interneurons, including Pv interneurons, before seizures has been described in different experimental models of epilepsy, raising the hypothesis that an increased GABAergic inhibitory signal may, under certain conditions, initiate seizures. It is therefore unclear whether the activity of Pv interneurons enhances or opposes epileptiform activities. Here we use a mouse cortical slice model of focal epilepsy in which the epileptogenic focus can be identified and the role of Pv interneurons in the generation and propagation of seizure-like ictal events is accurately analyzed by a combination of optogenetic, electrophysiological, and imaging techniques. We found that a selective activation of Pv interneurons at the focus failed to block ictal generation and induced postinhibitory rebound spiking in pyramidal neurons, enhancing neuronal synchrony and promoting ictal generation. In contrast, a selective activation of Pv interneurons distant from the focus blocked ictal propagation and shortened ictal duration at the focus. We revealed that the reduced ictal duration was a direct consequence of the ictal propagation block, probably by preventing newly generated afterdischarges to travel backwards to the original focus of ictal initiation. Similar results were obtained upon individual Pv interneuron activation by intracellular depolarizing current pulses. The functional dichotomy of Pv interneurons here described opens new perspectives to our understanding of how local inhibitory circuits govern generation and spread of focal epileptiform activities.

Keywords: channelrhodopsin-2; cortex; epileptiform activity; optogenetics; parvalbumin; rebound spiking.


Figures

Figure 1.
Figure 1.
Characterization of ChR2-expressing neurons in Pv-Cre injected mice. A, Immunohistological characterization of ChR2-expressing neurons. Aa1, Confocal image of a cortical section from Pv-Cre mice injected with AAV-transducing ChR2-mCherry. Aa2–a5, A large fraction of ChR2-mCherry-positive cells (a2) stains for GABA (a3, n = 325 cells, 3 mice). The ChR2-mCherry and GABA fluorescence signals are shown merged in a4 (multiconfocal stack). A higher-magnification image of two ChR2-mCherry and Pv-positive cells is shown in a5 (single confocal image). Aa6–a9, Same as in a2–a5 for cortical sections that were stained against PV (n = 319 cells, 3 mice). The large majority of cells expressing ChR2-mCherry also stain for GABA and Pv, confirming that transgenes are expressed selectively in inhibitory neurons expressing parvalbumin. Scale bars in a2 and a6 apply to a3, a4, a7, and a8. B, Representative traces of the action potential firing in a ChR2-expressing Pv interneuron in response to an intracellular depolarizing current pulse (top left) and to a 473 nm light stimulation of 150 ms duration (bottom left). Right, Amount of injected current required to evoke a firing rate (in the first 150 ms, black circles) similar to that elicited by light stimulation (cyan circles, n = 8 cells, 6 mice). Calibration: top, 200 ms, 500 pA, 20 mV; bottom, 200 ms, 20 mV. C, Action potential firing rate in response to 473 nm light stimulation of ChR2-expressing Pv interneurons in the absence (black, ACSF) and in the presence of 100 μm 4-AP and Mg2+ 0.5 mm (red, n = 5, 5 mice). Calibration: 100 ms, 20 mV. D, Schematic of the experiment performed in a TCx slice from a Pv-Cre mouse injected with AAV-transducing ChR2, and representative traces of voltage-clamp recordings (Vh = −50 mV) from a pyramidal neuron located 1 mm from the NMDA application site (PyN, top) and of local field potentials (lfp, bottom) recorded from the focus. A double NMDA pulse (closed arrowheads) evoked an ictal event that propagated from the focal site of NMDA application to the distant pyramidal neuron. Calibration: 40 s, 500 pA, 0.01 mV. Rf, Rhinal fissure. Insets illustrate at expanded time scales the ictal event onsets (open arrowheads) at the focal area (1) and at the propagating region (2), as revealed by lfp change and voltage-clamp recording from a pyramidal neuron (see Materials and Methods). Calibration: 2 s; inset 1, 40 pA, 0.002 mV; inset 2, 100 pA, 0.004 mV. E, Mean duration of the third, fourth, and fifth ictals normalized to the averaged duration of the first and second ictal (n = 30 ictals, 5 mice, p = 0.97 between third and fourth, p = 0.62 between third and fifth, paired t test). F, Spontaneous ictal event arising from an unpredictable focus. As revealed by the different ictal onset in the PyN and the field potential recordings (open arrowheads), the epileptiform activity propagated first to the pyramidal neuron and second to the site of field potential recording. Calibration: 40 s, 500 pA, 0.01 mV. In this and the other figures, traces may report unclamped action potentials, closed arrowheads indicate NMDA pulses, and cyan bars represent 473 nm light pulses. Empty squares represent mean values. Error bars indicate SEM.
Figure 2.
Figure 2.
Optogenetic activation of Pv interneurons does not prevent ictal event generation. A, Schematic of the experimental configuration also showing the typical firing of patched pyramidal neurons. Calibration: 0.2 s, 30 mV, 200 pA. B, Differential interference contrast image of the cortical region showing the NMDA-containing pipette that is used to both apply NMDA pulses and record extracellular local field potentials, the optical fiber used to activate ChR2 Pv interneurons, and the patch pipette onto a pyramidal neuron located at ∼400 μm from the ictal initiation site. A confocal z-stack maximal projection showing fluorescent ChR2-mCherry expressing Pv interneurons from the same region is also reported. C, Representative voltage-clamp recordings (Vh = −50 mV) from a pyramidal neuron and simultaneous local field potential recordings of ictal events in the absence (left) and in the presence (right) of pulsed light stimulation. A light-evoked IPSC is reported at enlarged scale. Calibration: 40 s, 500 pA, 0.01 mV; inset, 1 s, 100 pA. D, Percentage of ictal events evoked by double NMDA pulses in the presence and in the absence of pulsed stimulation applied at 0.5 Hz (n = 16, 10 mice), 2 Hz and 4 Hz (n = 8, 4 mice). E, Representative voltage-clamp recordings from a pyramidal neuron and simultaneous field potential recordings of ictal events in the absence (left) and in the presence (right) of a pulsed light stimulation at 0.5 Hz (n = 30 ictals, 13 mice) or 2 Hz (n = 5 ictals, 3 mice) that initiated after ictal onset. Calibration: 40 s, 0.01 mV, 500 pA. F, Ictal duration distribution in the absence (black) and in the presence (cyan) of pulsed light stimulation (n = 16, 10 mice). ***p < 0.001.
Figure 3.
Figure 3.
Optogenetic activation of Pv interneurons at the epileptogenic focus promotes ictal event generation. A, Schematic of the experiment and (B) representative voltage-clamp recording (Vh = −50 mV) from a pyramidal neuron 700 μm from the focus and simultaneous local field potential recording in response to a single NMDA pulse in the absence (left, right) and in the presence (middle) of light stimulation at 0.5 Hz, which was initiated 30 s before the NMDA challenge. Note the ictal response evoked by a single NMDA pulse in the presence of optogenetic stimulation. Calibration: 40 s, 0.01 mV, 500 pA. C, Distribution of normalized event duration in double NMDA pulses (black circles, n = 6, 4 mice) and single NMDA pulse experiments in the absence (green circles, n = 12, 4 mice) and in the presence (cyan, n = 6, 4 mice) of light stimulation. As in the representative experiment reported in B, in the six experiments the effect of a single NMDA pulse was checked twice, both before and after the ictal event evoked by the single NMDA pulse coupled with light stimulation. All data points are normalized to the mean duration of double NMDA-evoked events. D, Paired distribution of the delay in ictal onset measured from local field potentials recorded at the focus in a subset of the experiments (n = 6 ictals, 4 mice) that are reported in E. E, Distribution of the delay between the first NMDA pulse and the recruitment of the pyramidal neuron, as measured by tIE (see Materials and Methods), in ictal events evoked by double NMDA pulses in the absence of light stimulation (black, n = 14, 7 mice), and single NMDA pulses in the presence of light stimulation (cyan, n = 20, 7 mice). F, Bar histogram of the percentage of ictal events evoked by a single NMDA pulse in slices from Pv-Cre mice injected with saline solution (n = 9 trials, 3 mice) and from ChR2 Pv mice in the absence (−, green bar, n = 33 trials, 9 mice) and in the presence (+, cyan, n = 23 trials, 9 mice) of pulsed light stimulation. G–I, Schematic of the experiment (top) and representative voltage-clamp (Vh = −50 mV) recordings (bottom) of the response to a single NMDA pulse in a pyramidal neuron located 250 μm from the focus in the absence of light stimulation (G), in the presence of light stimulation at the focus (H), and in the presence of light stimulation in distant regions 1 mm from the focus (I) (n = 3 ictal events, 2 mice). **p < 0.01. ***p < 0.001.
Figure 4.
Figure 4.
Individual Pv interneuron activation at the epileptogenic focus promotes ictal event generation. A, Schematic of the experiment also showing the typical firing discharge of an FS interneuron expressing GFP in a TCx slice from a G42 mouse. Calibration: 0.5 s, 20 mV, 500 pA. B, Representative current-clamp recordings at resting potential from a Pv interneuron located at the focus and simultaneous local field potential recordings in response to a single NMDA pulse in the absence (left, right) and in the presence (middle) of 1 s intracellular current pulses at 0.5 Hz (dashed line). The intense firing activity in the interneuron facilitates the generation of a full ictal event (middle). Calibration: 40 s, 30 mV, 0.01 mV. C, Percentage of ictal events successfully evoked by a single NMDA pulse in the absence (−, n = 11, 3 mice) and in the presence (+, n = 10, 3 mice) of current pulse stimulation. D, Distribution of event duration evoked by double NMDA pulse (black circles, n = 5, 3 mice) and by single NMDA pulse in the absence (green, n = 11, 3 mice) and in the presence (cyan, n = 5, 3 mice) of evoked Pv interneuron firing activity. In each experiment, single NMDA pulses without light stimulation were performed at least twice as in the representative experiment reported in B. All data points are normalized to the mean duration of double NMDA pulse-evoked ictal events. E, Paired distribution of ictal onset delay measured from local field potential recorded at the focus (n = 5, 3 mice). *p < 0.05. **p < 0.01.
Figure 5.
Figure 5.
Optogenetic activation of Pv interneurons induce postinhibitory rebound spiking in pyramidal neurons. A, B, Representative simultaneous current-clamp recordings from a pyramidal neuron, depolarized to action potential threshold by steady-state current injection, and a Pv interneuron in the absence (A, left panel) and presence of pulsed light stimulation at 0.5 Hz (B, left panels). Recordings were performed in the presence of 4-AP and 0.5 mm Mg2+. Histograms of the relative firing rate as a function of time, calculated over 50 ms time bins, obtained by the analysis of 300 consecutive sweeps (A, B, right panels). Open arrowheads indicate the main spike clustering. Red line indicates the multipeak fitting of the firing rate over time (reduced χ2 = 0.99). Calibration: 200 ms, 20 mV. C, Distribution of normalized firing rate changes during rebound spiking both in basal conditions (empty circles, n = 10) and in the presence of 4-AP (full circles, n = 14). The mean value of both datasets is represented by the empty square (284 ± 28.1%, n = 24 cells, 14 slices, 6 mice). ***p < 0.001 (Wilcoxon signed-rank test).
Figure 6.
Figure 6.
Optogenetic activation of Pv interneurons promotes synchronous firing in pyramidal neurons. A1, A2, Spike trains recorded in 2-s-long sweeps from two neighboring pyramidal neurons in the absence (A1) and in the presence (A2) of light pulse stimulation at 0.5 Hz. Cyan bars represent 150 ms light pulses. The rhythmic activation of Pv interneurons causes a temporal modulation of spikes in both pyramidal neurons. Calibration: 200 ms, 20 mV. B1, B2, Raster plots showing the spike timing of the two pyramidal neurons (red and green bars) and a randomized trial (blue bars). C1, C2, Probability distribution in the 2 s period in the absence (C1) and in the presence (C2) of rhythmic optogenetic activation of Pv interneurons. D1, D2, For each spike produced by the pyramidal neuron 2 (PyN2), the distance from the closest spike produced by PyN1 was computed. The observed cumulative distribution of the nearest neighbor distances is plotted in red (n = 230 spikes). The distribution was computed again after randomization of the spike train of PyN1 (blue trace, n = 230 spikes). In the presence of optogenetic stimulation (D2), the difference between the observed cumulative distribution and the cumulative distribution obtained after randomization is statistically significant (n = 447 spikes, *p < 0.05, Kolomogorov–Smirnov test). E, The integral of the difference between observed and simulated distributions has been computed in an interval centered ∼0, returning a measure of the synchronization between the two pyramidal neurons. F, Summary report for the increase in pyramidal neuron synchrony induced by Pv interneuron activation (n = 7 pairs, 5 mice) in the presence (black circles) and in the absence (cyan circles) of pulsed light stimulation both in basal ACSF and 4-AP. **p < 0.01. G, Representative local field potential recording of an NMDA-evoked ictal event in the presence of light pulse stimulation. The ictal event onset between two light pulses is shown at enlarged scales. Green bars represent the firing suppression period in pyramidal neurons induced by light stimulation of ChR2-expressing Pv interneurons (cyan bars, 150 ms at 0.5 Hz). Calibration: 40 s, 0.01 mV; inset, 500 ms, 0.01 mV. H, Distribution of both the ictal onset probability (orange line, n = 31 ictal events in 100 ms time bins, 17 mice) and the pyramidal neuron mean spiking probability in 4-AP (light gray represents SEM; n = 24 cells, 6 mice; 50 ms time bins) as a function of time during pulsed light stimulation of Pv interneurons. The 0 value is set as the end of the light stimulus.
Figure 7.
Figure 7.
Optogenetic activation of Pv interneurons distant from the focus blocks ictal event propagation and shortens ictal event duration at the focus. A, Schematic of the experiment. B, Representative voltage-clamp recordings (Vh = −50 mV) from a pyramidal neuron located >1 mm from the focus and simultaneous local field potential recordings at the focus in the absence (left and right) and in the presence (middle) of light stimulation starting 60 s before the double NMDA pulse. Calibration: 40 s, 0.01 mV, 500 pA. C, Percentage of propagating ictal events in the absence (n = 14, 3 mice) and in the presence of light stimulation (n = 8, 3 mice). D, Paired distribution of ictal event duration evoked by double NMDA pulses in the absence (empty and full black circles, n = 8, 3 mice) and in the presence (empty and full cyan circles, n = 8, 3 mice) of light stimulation, as measured from local field potentials recorded at the focus. The duration of the two ictal events that were not blocked by local optogenetic activation of Pv interneurons was not reduced. Mean values of black and cyan full circles are represented by full squares. Paired sample t test was performed on the values obtained from the six successful experiments (3 mice). **p < 0.01.
Figure 8.
Figure 8.
Individual Pv interneuron activation in penumbra regions blocks ictal event propagation. A, Schematic of the experiment and differential interference contrast image illustrating the neuronal clusters progressively recruited into the ictal event in Ca2+ imaging experiments. B, Representative single current-clamp recordings from a Pv interneuron and simultaneous mean Ca2+ signal from two neuronal clusters (red and blue traces; soma position of these neurons is reported in A according to their different time of recruitment into the propagating ictal event. Steps of current were repeatedly injected to evoke firing activity (inset) that prevented the occurrence of a full ictal event. Calibration: 40 s, ΔF/F0 40%, 40 mV; inset, 5 s, 20 mV. C, Bar histogram of the percentage of NMDA evoked ictal events without (−, n = 23, 8 mice) or during (+, n = 12, 8 mice) stimulation of individual Pv interneurons. D, Bar histograms reporting the number of recruited neurons (left) and ictal event duration (right) measured in red neuron Ca2+ signals, in the absence and in the presence of current pulse stimulation of Pv interneurons (n = 3 ictal events, 2 mice). *p < 0.05. ***p < 0.001.
Figure 9.
Figure 9.
Afterdischarges invert their propagation direction during ictal events. A, Schematic of the experiment also illustrating the switch in the direction of ictal propagation. B, Representative traces of a dual voltage-clamp (Vh = −50 mV) recording from two pyramidal neurons 1 mm apart and pseudocolor plot of the cross-correlation (see Materials and Methods) during a focal ictal event showing the switch in the afterdischarge direction (n = 4, 3 mice). Calibration: 10 s, 500 pA. C, Two afterdischarges at enlarged time scale with cross-correlation diagrams of the relative bin. Calibration: 200 ms, 200 pA. D, Mean lag before and after the switch in the afterdischarge direction (n = 4, 3 mice).

Similar articles

Cited by

References

    1. Anderson WW, Lewis DV, Swartzwelder HS, Wilson WA. Magnesium-free medium activates seizure-like events in the rat hippocampal slice. Brain Res. 1986;398:215–219. doi: 10.1016/0006-8993(86)91274-6. - DOI - PubMed
    1. Avoli M, de Curtis M. GABAergic synchronization in the limbic system and its role in the generation of epileptiform activity. Prog Neurobiol. 2011;95:104–132. doi: 10.1016/j.pneurobio.2011.07.003. - DOI - PMC - PubMed
    1. Avoli M, Barbarosie M, Lücke A, Nagao T, Lopantsev V, Köhling R. Synchronous GABA-mediated potentials and epileptiform discharges in the rat limbic system in vitro. J Neurosci. 1996;16:3912–3924. - PMC - PubMed
    1. Bartos M, Vida I, Jonas P. Synaptic mechanisms of synchronized gamma oscillations in inhibitory interneuron networks. Nat Rev Neurosci. 2007;8:45–56. doi: 10.1038/nrn2044. - DOI - PubMed
    1. Bonifazi P, Goldin M, Picardo MA, Jorquera I, Cattani A, Bianconi G, Represa A, Ben-Ari Y, Cossart R. GABAergic hub neurons orchestrate synchrony in developing hippocampal networks. Science. 2009;326:1419–1424. doi: 10.1126/science.1175509. - DOI - PubMed

Publication types

MeSH terms