. 2015 Jul 2:5:11790.
doi: 10.1038/srep11790.

Acyl-CoA N-acyltransferase influences fertility by regulating lipid metabolism and jasmonic acid biogenesis in cotton

Affiliations

Acyl-CoA N-acyltransferase influences fertility by regulating lipid metabolism and jasmonic acid biogenesis in cotton

Wenfeng Fu et al. Sci Rep. .

Abstract

Cotton (Gossypium spp.) is an important economic crop and there is obvious heterosis in cotton, fertility has played an important role in this heterosis. However, the genes that exhibit critical roles in anther development and fertility are not well understood. Here, we report an acyl-CoA N-acyltransferase (EC2.3; GhACNAT) that plays a key role in anther development and fertility. Suppression of GhACNAT by virus-induced gene silencing in transgenic cotton (G. hirsutum L. cv. C312) resulted in indehiscent anthers that were full of pollen, diminished filaments and stamens, and plant sterility. We found GhACNAT was involved in lipid metabolism and jasmonic acid (JA) biosynthesis. The genes differentially expressed in GhACNAT-silenced plants and C312 were mainly involved in catalytic activity and transcription regulator activity in lipid metabolism. In GhACNAT-silenced plants, the expression levels of genes involved in lipid metabolism and jasmonic acid biosynthesis were significantly changed, the amount of JA in leaves and reproductive organs was significantly decreased compared with the amounts in C312. Treatments with exogenous methyl jasmonate rescued anther dehiscence and pollen release in GhACNAT-silenced plants and caused self-fertility. The GhACNAT gene may play an important role in controlling cotton fertility by regulating the pathways of lipid synthesis and JA biogenesis.


Figures

Figure 1
Figure 1. Phylogenetic analysis of the ACNAT family.
(a) GhACNAT had high homology with ACNAT in different species. (b) The phylogenetic cladogram of the ACNAT superfamily in different species. Pp, Prunus persica (XP_007222936.1); Tc1, Theobroma cacao1 (XP_007022847.1); Tc2, Theobroma cacao2 (XP_007022848.1); Tc3, Theobroma cacao3 (XP_007022849.1); Pm, Prunus mume (XP_008218653.1); Vv, Vitis vinifera (XP_002268159.2); Pt, Populus trichocarpa (XP_006385079.1); Es, Eutrema salsugineum (XP_006402222.1); Cr, Capsella rubella (XP_006294555.1); Br, Brassica rapa (XP_009134028.1); Nt, Nicotiana tomentosiformis (XP_009618447.1); Pv, Phaseolus vulgaris (XP_007153914.1); Os, Oryza sativa Japonica Group (NP_001052881.1); Hv, Hordeum vulgare subsp. vulgare (BAJ94372.1); Rc, Ricinus communis (XP_002527856.1); Al, Arabidopsis lyrata subsp. Lyrata (XP_002880496.1); At, Arabidopsis thaliana (At2g23390.1); Gh, G. hirsutum L.
Figure 2
Figure 2. The GhACNAT gene expression pattern in the cotton variety C312.
R: root; S: stem; L: leaves, B: bract, P: petals, St: stigmas and stamens, and fibers of different development stages (0-, 5-, 10-, 15-, 20, 25-DPA) in C312. (DPA: days post anthesis). The values are the means±s.ds. for three biological replicates. The asterisks indicate statistically significant differences between the transgenic and WT plants (*P < 0.05, **P < 0.01, Student’s t-test).
Figure 3
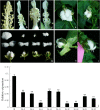
Figure 3. The morphological changes and GhACNAT expression analysis in transgenic GhACNAT-silenced plants and C312 plants.
(a-d) the stamens and stigmas of C312 (a) and transgenic GhACNAT-silenced plants (b, c, d); (e-i) bolls of C312 (e) and transgenic GhACNAT-silenced plants pollinated with C312 pollen (f, h, i); (g) fibers and seeds of C312 and transgenic GhACNAT-silenced plants from left to right. (j) Relative expression levels of GhACNAT measured by qRT-PCR in leaves of GhACNAT-silenced plants (lines 36-2, 36-5, 36-8, 36-10, 36-11, 36-12, 36-16, 36-21 and 36-23) and in C312 plants. The Ubiquitin7 gene (GhUBQ7) was used as an internal control. The values are the means for three replicates (samples of each line collected on days 20, 35 and 50 post-infection). The asterisks indicate statistically significant differences between the transgenic GhACNAT-silenced and WT C312 plants (Significant *P < 0.05, highly significant **P < 0.01, Student’s t-test).
Figure 4
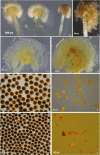
Figure 4. Phenotypic analysis of anther and pollen in WT C312 plants, transgenic GhACNAT-silenced plants and male sterile ms1 plants.
(a) comparison of anther and pollen in C312, transgenic GhACNAT-silenced plants and ms1 plants (from left to right); (b) pollen releasing from the anther in C312; (c) anther of C312 plant dehiscent and full of pollen grains; (d) indehiscent anther of the sterile transgenic GhACNAT-silenced plant, indehiscent and full of pollen grains; (e) 99% of the active pollen of WT C312 was stained with KI-I2; (f, h) the pollen of ms1 plants with no activity stained with KI-I2; (g) 95% of the active pollen of the transgenic GhACNAT-silenced plants were stained with KI-I2.
Figure 5
Figure 5. Functional classification into different categories of differentially expressed fragments from reproductive organs of pCLCrV-empty and transgenic GhACNAT-silenced plants.
Figure 6
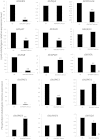
Figure 6. The relative expression of genes related to anther development and JA biosynthesis by qRT-PCR in transgenic GhACNAT-silenced plants and in C312 as a control (CK).
The Ubiquitin7 gene (GhUBQ7) was used as an internal control. The values are the means for three replicates (one flower for each sample of each line). The asterisks indicate statistically significant differences between the transgenic GhACNAT-silenced and the WT plants (*P < 0.05, **P < 0.01, Student’s t-test).
Figure 7
Figure 7. The relative expression of genes participating in the lipid biosynthesis pathway.
(a) The relative expression of the main genes for fatty acid synthesis; (b) the relative expression of genes for glycerolipid biosynthesis. The values are the means for three replicates (one flower for each sample of each line). The asterisks indicate statistically significant differences between the transgenic GhACNAT-silenced and the WT plants (*P < 0.05, **P < 0.01, Student’s t-test).
Figure 8
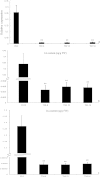
Figure 8
The relative expression of the GhACNAT gene in reproductive organs (a), and JA levels in C312 and transgenic GhACNAT-silenced plants in leaves (b) and in the whole flowers (c). The values are the means±s.ds for three replicates (three leaves for b and three flowers of each line for a and c). The asterisks indicate statistically significant differences between the transgenic GhACNAT-silenced and the WT plants (*P < 0.05, **P < 0.01, Student’s t-test).
Figure 9
Figure 9. The morphologies of stamens and stigmas in C312 and transgenic GhACNAT-silenced plants treated with different concentrations of MeJA.
(a) normal stamens and stigma in C312 plants; (b) stamens and stigma in transgenic GhACNAT-silenced plants treated with 100 μM MeJA; (c) stamens and stigma in transgenic GhACNAT-silenced plants treated with 500 μM MeJA; (d) stamens and stigma in transgenic GhACNAT-silenced plants treated with 1000 μM MeJA.
Figure 10
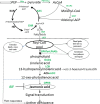
Figure 10. A simple schematic diagram of fatty acid and jasmonic acid biosynthesis.
PEP, phosphoenolpyruvate; PKp, plastidial pyruvate kinase; PDH-E1a, pyruvate dehydrogenase; AcCoA, acetyl-CoA; ACP, acyl carrier protein; BCCP2, biotin carboxyl carrier protein2; MAT, malonyl-CoA: ACP transacylase; KAS, 3-ketoacyl-ACP synthase; KAR, 3-ketoacyl-ACP reducase; HD, 3-hydroxyacyl-ACP dehydratase; ENR, enoyl-ACP reductase; LCFA, long-chain fatty acid; LACS, long-chain acyl-CoA synthetase; FAT, fatty acyl-ACP thioesterase; GPAT, glycerol-3-phosphate acyltransferase; LPAAT, lysophosphaditic acid acyltransferase; LOX, lipoxygenase; AOS, allene oxide synthase; AOC, allene oxide cyclase.

References

    1. Wilkins T. A., Mishra R. & Trolinder N. L. Agrobacterium-mediated transformation and regeneration of cotton. J. Food Agric. Environ. 2, 179–197 (2004).
    1. Wang K. et al.. The draft genome of a diploid cotton Gossypium raimondii. Nat. Genet. 44, 1098–1103 (2012). - PubMed
    1. Paterson A. H. et al.. Repeated polyploidization of Gossypium genomes and the evolution of spinnable cotton fibres. Nature 492, 423–427 (2012). - PubMed
    1. Li F. et al.. Genome sequence of the cultivated cotton Gossypium arboreum. Nat. Genet. 46, 567–572 (2014). - PubMed
    1. Lange M., Aravinda L., Yellina, Svetlana O. & Annette B. Virus-Induced Gene Silencing (VIGS) in plants: an overview of target apecies and the virus-derived vector systems. Methods in Mol. Biol. 975, 1–14 (2013). - PubMed

Publication types

MeSH terms

LinkOut - more resources