

Revealing microbial recognition by specific antibodies
- PMID: 26134992
- PMCID: PMC4489363
- DOI: 10.1186/s12866-015-0456-y
Revealing microbial recognition by specific antibodies
Abstract
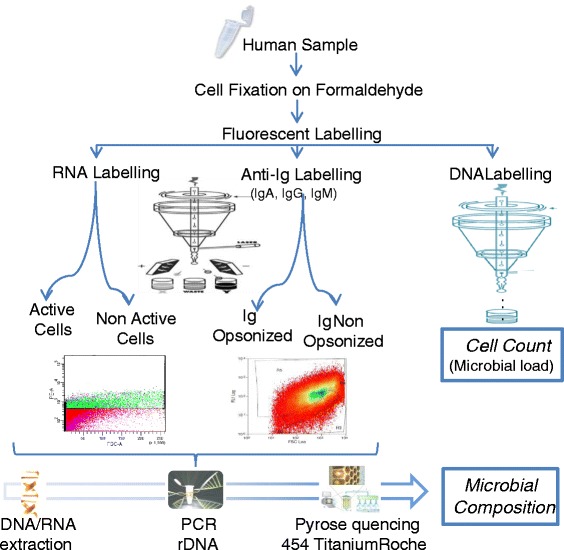
Background: Recognition of microorganisms by antibodies is a vital component of the human immune response. However, there is currently very limited understanding of immune recognition of 50 % of the human microbiome which is made up of as yet un-culturable bacteria. We have combined the use of flow cytometry and pyrosequencing to describe the microbial composition of human samples, and its interaction with the immune system.
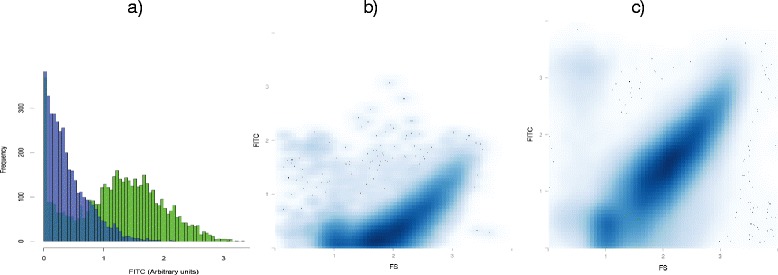
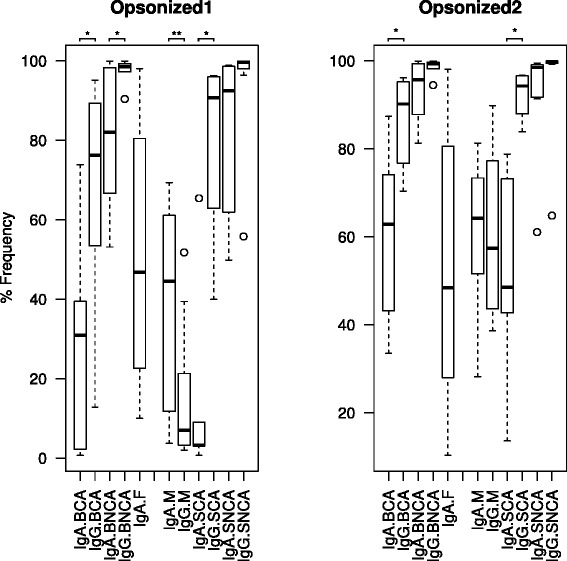
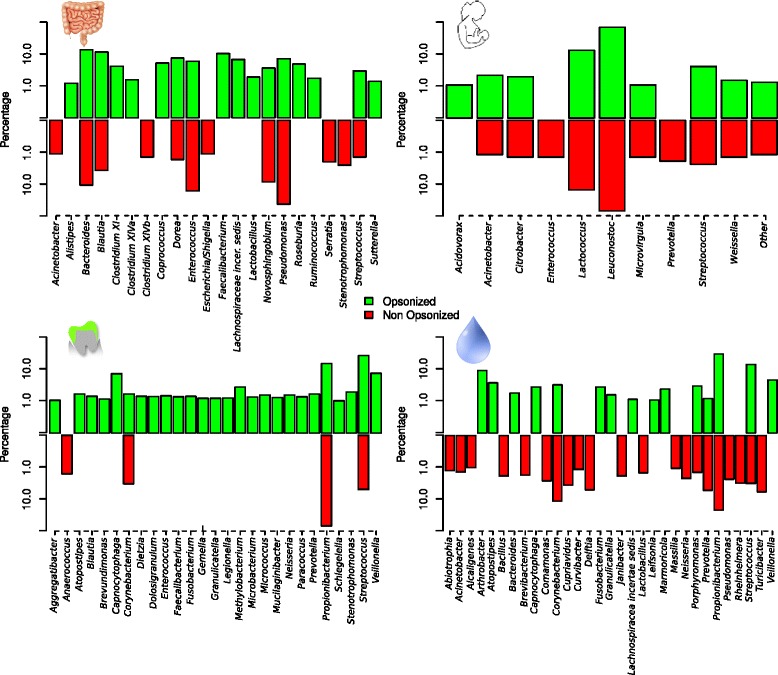
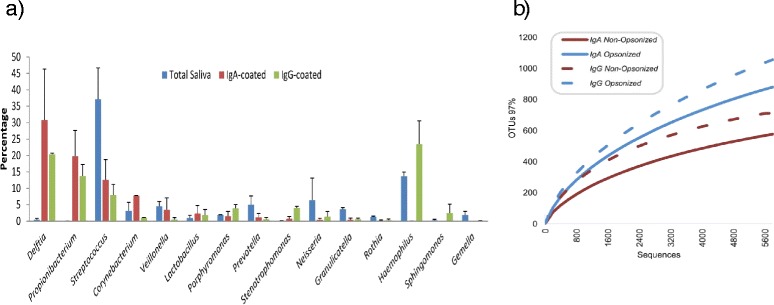
Results: We show the power of the technique in human faecal, saliva, oral biofilm and breast milk samples, labeled with fluorescent anti-IgG or anti-IgA antibodies. Using Fluorescence-Activated Cell Sorting (FACS), bacterial cells were separated depending on whether they are coated with IgA or IgG antibodies. Each bacterial population was PCR-amplified and pyrosequenced, characterizing the microorganisms which evade the immune system and those which were recognized by each immunoglobulin.
Conclusions: The application of the technique to healthy and diseased individuals may unravel the contribution of the immune response to microbial infections and polymicrobial diseases.
Figures
Similar articles
-
The Application of Magnetic Bead Selection to Investigate Interactions between the Oral Microbiota and Salivary Immunoglobulins.PLoS One. 2016 Aug 2;11(8):e0158288. doi: 10.1371/journal.pone.0158288. eCollection 2016. PLoS One. 2016. PMID: 27483159 Free PMC article.
-
Healthy individuals possess circulating antibodies against their indigenous faecal microflora as well as against allogenous faecal microflora: an immunomorphometrical study.Epidemiol Infect. 1993 Oct;111(2):273-85. doi: 10.1017/s0950268800056983. Epidemiol Infect. 1993. PMID: 8405154 Free PMC article.
-
Oral microbiome composition changes in mouse models of colitis.J Gastroenterol Hepatol. 2015 Mar;30(3):521-7. doi: 10.1111/jgh.12713. J Gastroenterol Hepatol. 2015. PMID: 25180790
-
Immunoglobulin recognition of fecal bacteria in stunted and non-stunted children: findings from the Afribiota study.Microbiome. 2020 Jul 27;8(1):113. doi: 10.1186/s40168-020-00890-1. Microbiome. 2020. PMID: 32718353 Free PMC article.
-
Human Breast Milk Bacteriome in Health and Disease.Nutrients. 2018 Nov 3;10(11):1643. doi: 10.3390/nu10111643. Nutrients. 2018. PMID: 30400268 Free PMC article. Review.
Cited by
-
Active and Secretory IgA-Coated Bacterial Fractions Elucidate Dysbiosis in Clostridium difficile Infection.mSphere. 2016 May 25;1(3):e00101-16. doi: 10.1128/mSphere.00101-16. eCollection 2016 May-Jun. mSphere. 2016. PMID: 27303742 Free PMC article.
-
Multiple Approaches Detect the Presence of Fungi in Human Breastmilk Samples from Healthy Mothers.Sci Rep. 2017 Oct 12;7(1):13016. doi: 10.1038/s41598-017-13270-x. Sci Rep. 2017. PMID: 29026146 Free PMC article.
-
Novel antibody assessment method for microbial compositional alteration in the oral cavity.Biochem Biophys Rep. 2022 Apr 29;30:101269. doi: 10.1016/j.bbrep.2022.101269. eCollection 2022 Jul. Biochem Biophys Rep. 2022. PMID: 35518198 Free PMC article.
-
Accurate identification and quantification of commensal microbiota bound by host immunoglobulins.Microbiome. 2021 Jan 30;9(1):33. doi: 10.1186/s40168-020-00992-w. Microbiome. 2021. PMID: 33516266 Free PMC article.
-
Unfolding the Human Milk Microbiome Landscape in the Omics Era.Front Microbiol. 2019 Jun 25;10:1378. doi: 10.3389/fmicb.2019.01378. eCollection 2019. Front Microbiol. 2019. PMID: 31293535 Free PMC article. Review.
References
Publication types
MeSH terms
Substances
LinkOut - more resources
Full Text Sources
Other Literature Sources
Miscellaneous
