. 2015 Jul 2:5:11802.
doi: 10.1038/srep11802.

QiShenYiQi Pills, a compound in Chinese medicine, protects against pressure overload-induced cardiac hypertrophy through a multi-component and multi-target mode

Affiliations

QiShenYiQi Pills, a compound in Chinese medicine, protects against pressure overload-induced cardiac hypertrophy through a multi-component and multi-target mode

Yuan-Yuan Chen et al. Sci Rep. .

Abstract

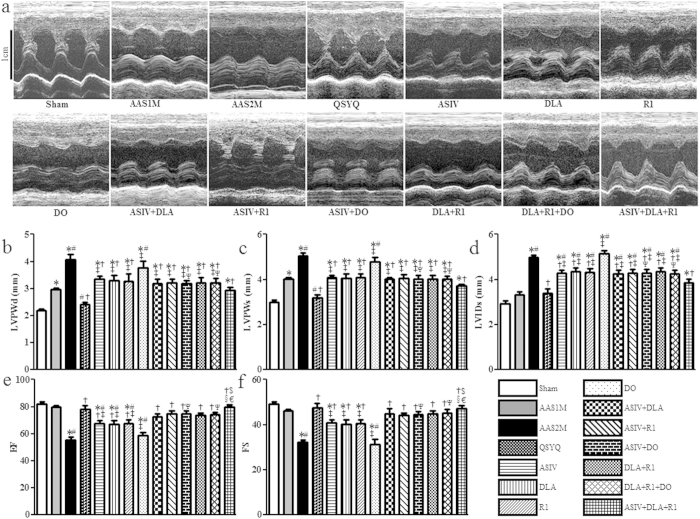
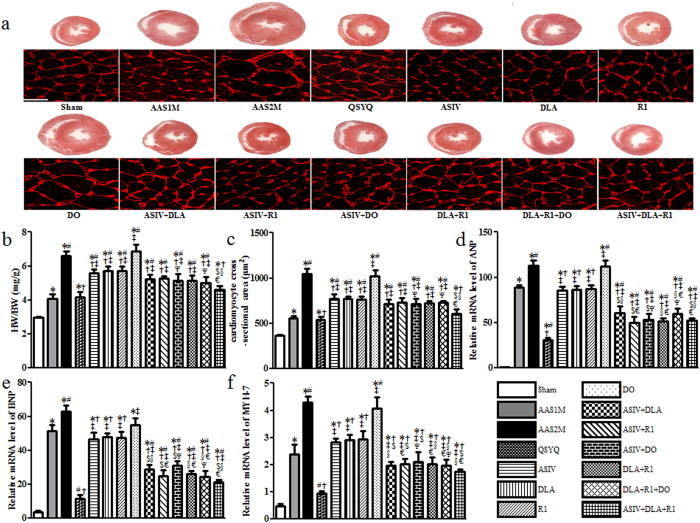
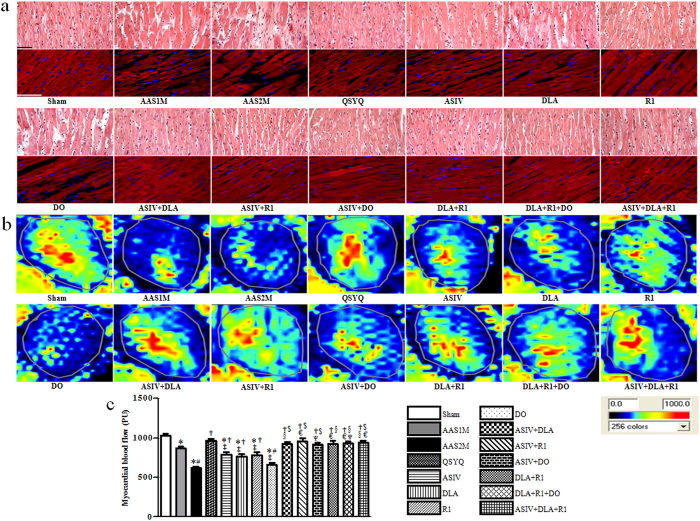
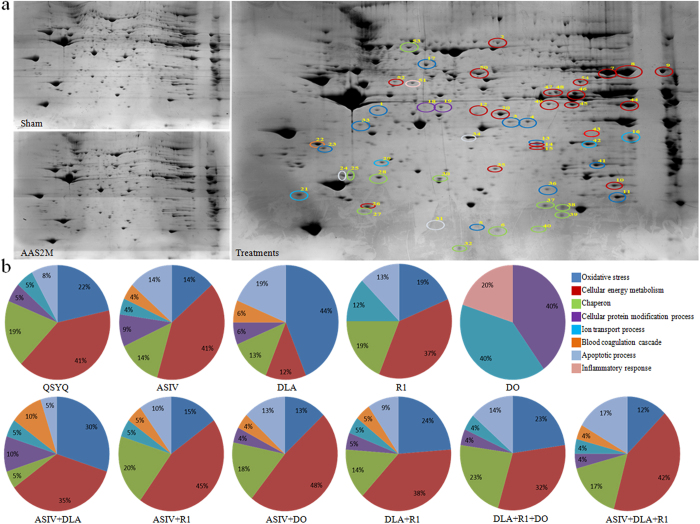
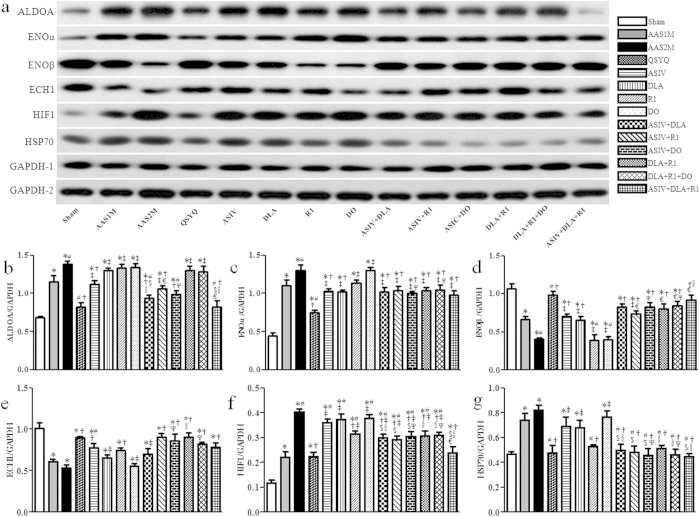
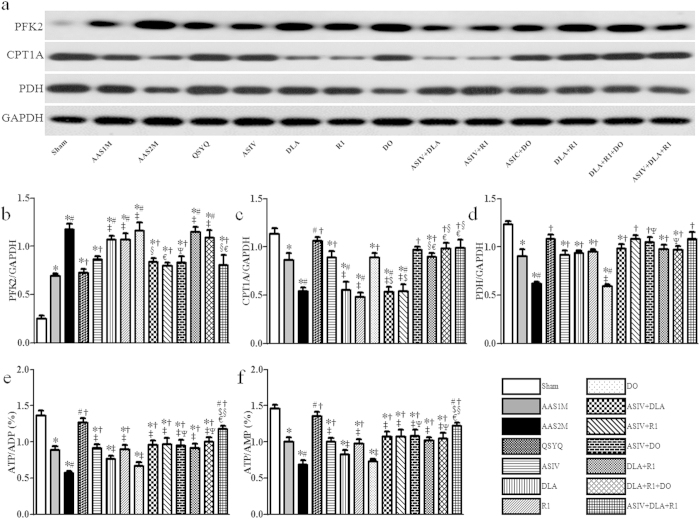
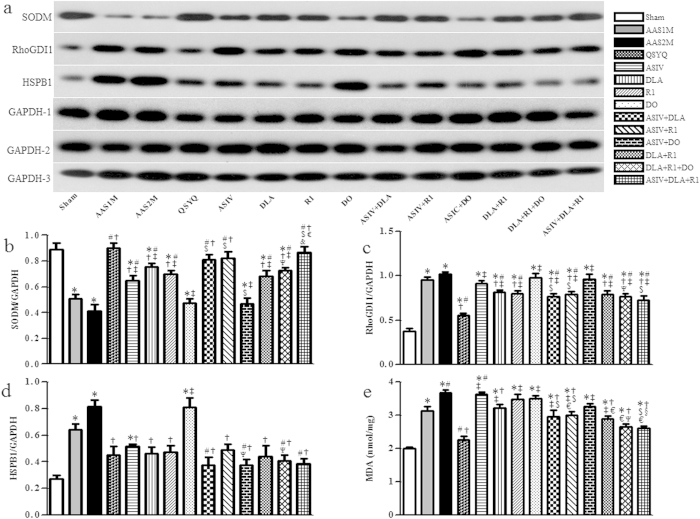
The present study aimed to explore the holistic mechanism for the antihypertrophic effect of a compound in Chinese medicine, QiShenYiQi Pills (QSYQ) and the contributions of its components to the effect in rats with cardiac hypertrophy (CH). After induction of CH by ascending aortic stenosis, rats were treated with QSYQ, each identified active ingredient (astragaloside IV, 3, 4-dihydroxy-phenyl lactic acid or notoginsenoside R1) from its 3 major herb components or dalbergia odorifera, either alone or combinations, for 1 month. QSYQ markedly attenuated CH, as evidenced by echocardiography, morphology and biochemistry. Proteomic analysis and western blot showed that the majority of differentially expressed proteins in the heart of QSYQ-treated rats were associated with energy metabolism or oxidative stress. Each ingredient alone or their combinations exhibited similar effects as QSYQ but to a lesser extent and differently with astragaloside IV and notoginsenoside R1 being more effective for enhancing energy metabolism, 3, 4-dihydroxy-phenyl lactic acid more effective for counteracting oxidative stress while dalbergia odorifera having little effect on the variables evaluated. In conclusion, QSYQ exerts a more potent antihypertrophic effect than any of its ingredients or their combinations, due to the interaction of its active components through a multi-component and multi-target mode.


Figures

Figure 1
Figure 1. The effect of different drug treatments on echocardiographic parameters.
a Representative rat echocardiograms in various conditions for determination of the ventricle wall thickness during cardiac cycles. b-f Quantitative measurement of LVPWd (b), LVPWs (c), LVIDs (d), EF (e), and FS (f). The data are presented as mean ± S.E. *p < 0.05 vs. Sham, #p < 0.05 vs. AAS1M, p < 0.05 vs. AAS2M, p < 0.05 vs. QSYQ, $p < 0.05 vs. ASIV, §p < 0.05 vs. DLA, p < 0.05 vs. R1, Ψp < 0.05 vs. DO. n = 6.
Figure 2
Figure 2. The effect of different drug treatments on CH.
a Representative rat heart cross sections in different conditions with sections stained by WGA showing below demarcating cell boundaries (Bar = 25 μm). The heart sections were cut across the middle of heart vertical axis. b Quantitative evaluation of HW/BW. c Quantitative measurement of cardiomyocyte cross-sectional area. d–f Semi-quantitative analysis of ANP (d), BNP (e) and MYH-7 (f) mRNA level. The data are presented as mean ± S.E. *p < 0.05 vs. Sham, #p < 0.05 vs. AAS1M, p < 0.05 vs. AAS2M, p < 0.05 vs. QSYQ, $p < 0.05 vs. ASIV, §p < 0.05 vs. DLA, p < 0.05 vs. R1, Ψp < 0.05 vs. DO. n = 6.
Figure 3
Figure 3. The effect of different drug treatments on myocardium histology and MBF.
a Representative myocardium sections stained by HE showing cadiomyocyte hypertrophy (Bar = 50 μm) with sections stained for F-actin by rhodamine phalloidin showing below to illustrate cardiomyocyte rupture (Bar = 100  m) in different groups. b Representative images of MBF acquired by Laser Scanning Doppler Perfusion Imager in each group. c Statistical results of MBF in each group. The data are presented as mean ± S.E. *p < 0.05 vs. Sham, #p < 0.05 vs. AAS1M, p < 0.05 vs. AAS2M, p < 0.05 vs. QSYQ, $p < 0.05 vs. ASIV, §p < 0.05 vs. DLA, p < 0.05 vs. R1, Ψp < 0.05 vs. DO. n = 6.
Figure 4
Figure 4. Proteomic analysis of the differentially expressed proteins in each group.
a Representative images of the PhastGel Blue R stained two-dimensional gels of Sham, AAS2M and treatments group. Colorful circles in treatments indicate the differentially expressed spots from all drug treatments groups. b The proportion of various functional category in differentially expressed proteins in each group. n = 3.
Figure 5
Figure 5. Western blot of proteins related to energy metabolism pathway in different groups.
a The representative western blotting bands of each protein in different groups. b–g The semi-quantitative analysis of ALDOA (b), ENOα (c) ENOβ (d), ECH1 (e), HIF1 (f) and HSP70 (g) in various groups. The bands of ALDOA, ENOβ, HIF1 and GAPDH-2 were cropped from one gel, while the bands of ECH1, ENOα, HSP70 and GAPDH-1 were cropped from another gel, as shown in Supplementary Fig. S5a with indication of molecular size. The quantification was based on the data of 3 independent experiments and normalized to GAPDH. The data are presented as mean ± S.E. *p < 0.05 vs. Sham, #p < 0.05 vs. AAS1M, p < 0.05 vs. AAS2M, p < 0.05 vs. QSYQ, $p < 0.05 vs. ASIV, §p < 0.05 vs. DLA, p < 0.05 vs. R1, Ψp < 0.05 vs. DO. n = 4.
Figure 6
Figure 6. The effect of different drug treatments on enzymes related to energy metabolism tested by western blot and ELISA.
a–d The representative western blotting bands and respected semi-quantitative analysis of PFK2 (b), CPT1A (c) and PDH (d), n = 4. e–f Quantitative measurement of ATP/ADP (e) and ATP/AMP (f) by ELISA in each group, n = 6. All bands in figure 6 were cropped from one gel, as shown in Supplementary Fig. S6a with indication of molecular size. The quantification was based on the data of 3 independent experiments and normalized to GAPDH. The data are presented as mean ± S.E. *p < 0.05 vs. Sham, #p < 0.05 vs. AAS1M, p < 0.05 vs. AAS2M, p < 0.05 vs. QSYQ, $p < 0.05 vs. ASIV, §p < 0.05 vs. DLA, p < 0.05 vs. R1, Ψp < 0.05 vs. DO.
Figure 7
Figure 7. The effect of different drug treatments on oxidative stress tested by western blot and ELISA.
a–d The representative western blotting bands and respective semi-quantitative analysis of SODM (b), RhoGDI1 (c) and HSPB1 (d), n = 4. e Quantitative evaluation by ELISA of MDA level in each group, n = 6. The bands of SODM and GAPDH-1 were cropped from one gel, the bands of RhoGDI1 and GAPDH-2 were cropped from one gel, and the bands of HSPB1 and GAPDH-3 were cropped from one gel, as shown in Supplementary Fig. S7a with indication of molecular size. The quantification was based on the data of 3 independent experiments and normalized to GAPDH. The data are presented as mean ± S.E. *p < 0.05 vs. Sham, #p < 0.05 vs. AAS1M, p < 0.05 vs. AAS2M, p < 0.05 vs. QSYQ, $p < 0.05 vs. ASIV, §p < 0.05 vs. DLA, p < 0.05 vs. R1, Ψp < 0.05 vs. DO.

References

    1. Hua Y., Zhang Y. & Ren J. IGF-1 deficiency resists cardiac hypertrophy and myocardial contractile dysfunction: role of microRNA-1 and microRNA-133a. J. Cell. Mol. Med. 16, 83–95, 10.1111/j.1582-4934.2011.01307.x (2012). - DOI - PMC - PubMed
    1. Frohlich E. D. & Susic D. Pressure overload. Heart Fail Clin 8, 21–32, 10.1016/j.hfc.2011.08.005 (2012). - DOI - PubMed
    1. Rosca M. G., Tandler B. & Hoppel C. L. Mitochondria in cardiac hypertrophy and heart failure. J. Mol. Cell. Cardiol. 55, 31–41, 10.1016/j.yjmcc.2012.09.002 (2013). - DOI - PMC - PubMed
    1. Komuro I. Molecular mechanism of cardiac hypertrophy and development. Jpn. Circ. J. 65, 353–358 (2001). - PubMed
    1. Sag C. M., Santos C. X. & Shah A. M. Redox regulation of cardiac hypertrophy. J. Mol. Cell. Cardiol. 73, 103–111, 10.1016/j.yjmcc.2014.02.002 (2014). - DOI - PubMed

Publication types