The wound inflammatory response exacerbates growth of pre-neoplastic cells and progression to cancer
- PMID: 26136213
- PMCID: PMC4585460
- DOI: 10.15252/embj.201490147
The wound inflammatory response exacerbates growth of pre-neoplastic cells and progression to cancer
Abstract
There is a long-standing association between wound healing and cancer, with cancer often described as a "wound that does not heal". However, little is known about how wounding, such as following surgery, biopsy collection or ulceration, might impact on cancer progression. Here, we use a translucent zebrafish larval model of Ras(G12V)-driven neoplasia to image the interactions between inflammatory cells drawn to a wound, and to adjacent pre-neoplastic cells. We show that neutrophils are rapidly diverted from a wound to pre-neoplastic cells and these interactions lead to increased proliferation of the pre-neoplastic cells. One of the wound-inflammation-induced trophic signals is prostaglandin E2 (PGE2). In an adult model of chronic wounding in zebrafish, we show that repeated wounding with subsequent inflammation leads to a greater incidence of local melanoma formation. Our zebrafish studies led us to investigate the innate immune cell associations in ulcerated melanomas in human patients. We find a strong correlation between neutrophil presence at sites of melanoma ulceration and cell proliferation at these sites, which is associated with poor prognostic outcome.
Keywords: cancer inflammation; cancer surgery; live imaging; melanoma; wound healing.
© 2015 The Authors. Published under the terms of the CC BY 4.0 license.
Figures

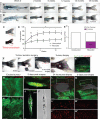
A Unwounded 4-week-old kita:RasG12VeGFP juvenile fish followed over time.
B Juvenile kita:RasG12VeGFP fish wounded by tail-fin resection (red line) every 2 weeks for 12 weeks.
C Pigmentation of the tail fin as quantified by threshold analysis of the tail area (indicated by red dotted line) at each time point.
D Graph illustrating the percent pigmentation over 12 weeks (mean ± SEM).
E Number of tail fin tumours developed in wounded versus unwounded fish (n = 7 fish in unwounded and wounded group, respectively).
F–F’’ An adult kita:RasG12VeGFP fish with a large tail melanoma prior to surgery (F), immediately after (F’) and 3 days post-surgery (F’’); the surgery left a small section of melanoma remaining on the ventral tail fin (highlighted by the red box).
G Whole-mount immunohistochemistry of the excised unwounded tumour stained for LysC (red) to reveal neutrophils.
H Immunohistochemistry of a section of the same excised tumour stained for phospho-histone H3 (pH3, white) to reveal the extent of proliferation.
I Whole-mount immunohistochemistry of the tail with wounded tumour remnant 3 days post-surgery (green) illustrating accumulation of neutrophils (red) within the wounded tumour tissue (arrowhead).
J, J’ A frozen section through the tail with wounded tumour remnant 3 days post-surgery (plane indicated by red dotted line in F’’) stained for phospho-H3 revealing how proliferating cells (white) appear to have increased in number in the remaining tumour. Equivalent bright-field section shown in (J’).
K, K’ An adult kita:RasG12VeGFP; p53+/−; LysC:dsRed fish with an early-stage, flat, tail melanoma just post-punch biopsy at the tumour margin; punch biopsy tissue with green RasG12VeGFP tissue adjacent to healthy tissue is shown in (K’).
L–L’’ Multichannel view of the repairing wound illustrating how, 24 h post-wounding, neutrophils (red) have been drawn to both tumour and healthy tissue wound edge. (L) and (L’’) are magnifications of the wound edges of non-tumour and tumour tissue, respectively.
M–M’’ Multichannel view of the repairing wound at 3 days post-wounding, demonstrating that neutrophils have largely resolved away from the wound site in healthy tissue (M’) but remain highly concentrated in wounded tumour tissue (M’’).

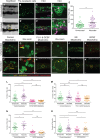
A, A’ Five-days post-fertilisation larva illustrating the region of flank where we image and wound (A). Wounds (yellow circle) are made in the centre of the flank just above the cloaca (arrow) in all larval experiments (A’).
B–B’’ Stills from a time-lapse movie of a larva with RasG12VeGFP pre-neoplastic cell clones but no wound.
C–C’’’ Equivalent time-lapse stills of a control, laser-wounded larva with no pre-neoplastic cell clones at 90 min post-wounding (wound indicated with yellow dotted line).
D–D’’’ Stills from a time-lapse movie of a larva with RasG12VeGFP pre-neoplastic cell clones (green), again wounded 90 min before.
E Graph comparing the number of LysC:dsRed+ neutrophils recruited over a 2-h period to the equivalent flank region of unwounded RasG12VeGFP larvae (n = 11), versus wounded WT larvae (n = 3), wounded RasG12VeGFP larvae (n = 5) and wounded RasG12VeGFP larvae treated with DPI inhibitor (n = 7). ***P ≤ 0.001.
F Graph comparing the percentage of Ras+ pre-neoplastic cells that receive contacts with neutrophils during the 2-h period of the movie in unwounded (n = 11) versus wounded (n = 5) larvae. ***P ≤ 0.001.
G–J Unwounded WT sibling; LysC:dsRed+ larva (n = 10 per time point) for comparison of clone growth with (H) laser-wounded WT sibling: LysC:dsRed+ larva (n = 15 per time point), (I) unwounded Ras+; LysC:dsRed+ larvae (n = 15 per time point) and (J) laser-wounded Ras+; LysC:dsRed+ (n = 20 per time point). Larvae were harvested and fixed between 3 dpf and 7 dpf (i.e. between 3 and 96 h post-wounding), and stained with anti-L-plastin and anti-RFP antibodies to distinguish neutrophils (yellow) and macrophages (red).
K–N Graphs showing the numbers of neutrophils and macrophages in the flanks of unwounded WT siblings (K), unwounded Ras+ larvae (L), wounded WT siblings (M) and wounded Ras+ larvae (N).
O–Q Graphs indicating the total number of innate immune cells (O), macrophages (P) and neutrophils (Q) recruited over time in wounded and unwounded WT and unwounded and wounded Ras+ larvae.
R Graph showing the number of pre-neoplastic cells receiving contact by immune cells in unwounded/wounded larvae over time (P = 0.0052 for 5 days post-wound).

A–D’ RasG12VeGFP larvae were left unwounded (A–D) or laser-wounded (yellow dotted line) at 2 dpf just dorsal to the cloaca (A’–D’). Larvae were left to grow for 3 days before being fixed and analysed for pre-neoplastic cell number (n = 30 larvae in each group). EdU accumulation (purple) is shown at low magnification (C and C’) and a representative pre-neoplastic cell clone is shown (D and D’).
E Graph illustrating pre-neoplastic cell numbers in unwounded versus wounded larvae (n = 27 of each group). Data from three independent experiments showed the same level of significance. ***P ≤ 0.001.
F–G’ Images of larvae injected with control morpholino at the one-cell stage, and either left unwounded (F, high magnification: G) or laser-wounded at 3 dpf (F’, high magnification: G’) and fixed at 5 dpf.
H–J’ Larvae injected with a combination of PU-1 and GCSF morpholinos at the one-cell stage, left unwounded (H, high magnification: I) or laser-wounded at 3 dpf (H’, high magnification: I’) and fixed at 5 dpf. Images of larvae injected with irf8 morpholino, and either unwounded (J) or laser-wounded at 3 dpf (J’) before subsequent fixation at 5 dpf.
K, K’ Larvae injected with GCSF morpholino, and either left unwounded (K) or laser-wounded at 3 dpf (K’) and fixed at 5 dpf.
L, M Graphs to show the total number of Ras+ cells and clones (respectively) at 5 dpf after PU-1 and GCSF morpholinos.
N, O Graphs showing the number of Ras+ cells at 5 dpf after irf8 morpholino (N) or after GCSF morpholino injection (O).

A–B’ Images of Ras+ larval flanks from control fish bathed in Danieau’s solution or with 10 μM NS398 to block Cox-2 enzyme activity, and left unwounded (A, B) or laser-wounded (A’, B’) at 3 dpf before subsequent fixation at 5 dpf.
C Graph showing quantification of pre-neoplastic cell numbers at 5 dpf from (A–B’) (n = 15–20 larvae in each group).
D, D’ Unwounded control Ras+ larvae (D) versus sibling larvae that have been laser-wounded at 2 dpf (D’).
E–F’ Unwounded versus wounded larvae after injection with PU-1 and GCSF morpholinos (E and E’), and addition of 20 μM dmPGE2 (F and F’).
G Graph showing pre-neoplastic cell numbers from (D–F’).

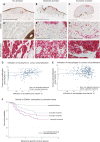
A–C’ Typical non-ulcerated, moderate and excessively ulcerated melanomas, respectively, all immunostained for pan-cytokeratin (brown) to illustrate epidermal wound margins. (A’, B’ and C’) High magnification details from (A, B and C) (highlighted by red boxes) co-stained for CD66b to illustrate neutrophil accumulation.
D–F’ Parallel sections from the same patient blocks as in (A-C’), but stained for CD163 and pan-cytokeratin to illustrate macrophage influx.
G Graph showing the correlation between extent of ulceration and extent of neutrophil influx (P < 0.0001; R2 = 0.19). A, B and C indicate the patient points from whom corresponding neutrophil immunostaining data are shown.
H In contrast to (G), no correlation between extent of ulceration and extent of macrophage influx was observed (P = 0.9; R2 = 0.0004). D, E and F indicate the patient points from whom corresponding macrophage immunostaining data are shown.

A–C’’ Typical non-ulcerated, moderate and excessively ulcerated melanomas, respectively, all immunostained for pan-cytokeratin to illustrate epidermal wound margins. (A’, B’ and C’) High magnification details from (A, B and C) (highlighted by red boxes) co-stained for CD66b to illustrate neutrophil accumulation. (A’’, B’’ and C’’) Parallel sections from the same patient blocks, but stained for MelanA and Ki67 to determine proliferating melanoma cells.
D Graph illustrating the extent of correlation between neutrophil influx and tumour cell proliferation (P = 0.002; R2 = 0.17). Solid dots are from non-ulcerated lesions and show a good correlation, whereas circles represent ulcerated melanomas.
E Graph showing considerably less correlation between macrophage influx and tumour cell proliferation (P = 0.56; R2 = 0.10).
F A series of Kaplan–Meier curves illustrating the link between neutrophil influx (total absence, moderate infiltration (<75 percentile)) and excessive infiltration (>75 percentile) and prognostic outcome in patients with non-ulcerated and ulcerated melanomas, respectively.
Comment in
-
Neutrophils fan cancer's flames.EMBO J. 2015 Sep 2;34(17):2211-2. doi: 10.15252/embj.201592381. Epub 2015 Jul 19. EMBO J. 2015. PMID: 26194723 Free PMC article.
-
Neutrophils, wounds, and cancer progression.Dev Cell. 2015 Jul 27;34(2):134-6. doi: 10.1016/j.devcel.2015.07.005. Dev Cell. 2015. PMID: 26218320
-
Do not scratch that mole!Trends Immunol. 2015 Sep;36(9):503-4. doi: 10.1016/j.it.2015.07.008. Epub 2015 Aug 4. Trends Immunol. 2015. PMID: 26254146 Free PMC article.
References
-
- Balch CM, Gershenwald JE, Soong SJ, Thompson JF, Atkins MB, Byrd DR, Buzaid AC, Cochran AJ, Coit DG, Ding S, Eggermont AM, Flaherty KT, Gimotty PA, Kirkwood JM, McMasters KM, Mihm MC, Jr, Morton DL, Ross MI, Sober AJ, Sondak VK. Final version of 2009 AJCC melanoma staging and classification. J Clin Oncol. 2009;27:6199–6206. - PMC - PubMed
-
- Balch CM, Gershenwald JE, Soong SJ, Thompson JF. Update on the melanoma staging system: the importance of sentinel node staging and primary tumor mitotic rate. J Surg Oncol. 2011;104:379–385. - PubMed
-
- Bald T, Quast T, Landsberg J, Rogava M, Glodde N, Lopez-Ramos D, Kohlmeyer J, Riesenberg S, van den Boorn-Konijnenberg D, Homig-Holzel C, Reuten R, Schadow B, Weighardt H, Wenzel D, Helfrich I, Schadendorf D, Bloch W, Bianchi ME, Lugassy C, Barnhill RL, et al. Ultraviolet-radiation-induced inflammation promotes angiotropism and metastasis in melanoma. Nature. 2014;507:109–113. - PubMed
Publication types
MeSH terms
Substances
Grants and funding
LinkOut - more resources
Full Text Sources
Other Literature Sources
Medical
Molecular Biology Databases

