

Brahma is required for cell cycle arrest and late muscle gene expression during skeletal myogenesis
- PMID: 26136374
- PMCID: PMC4552495
- DOI: 10.15252/embr.201540159
Brahma is required for cell cycle arrest and late muscle gene expression during skeletal myogenesis
Abstract
Although the two catalytic subunits of the SWI/SNF chromatin-remodeling complex--Brahma (Brm) and Brg1--are almost invariably co-expressed, their mutually exclusive incorporation into distinct SWI/SNF complexes predicts that Brg1- and Brm-based SWI/SNF complexes execute specific functions. Here, we show that Brg1 and Brm have distinct functions at discrete stages of muscle differentiation. While Brg1 is required for the activation of muscle gene transcription at early stages of differentiation, Brm is required for Ccnd1 repression and cell cycle arrest prior to the activation of muscle genes. Ccnd1 knockdown rescues the ability to exit the cell cycle in Brm-deficient myoblasts, but does not recover terminal differentiation, revealing a previously unrecognized role of Brm in the activation of late muscle gene expression independent from the control of cell cycle. Consistently, Brm null mice displayed impaired muscle regeneration after injury, with aberrant proliferation of satellite cells and delayed formation of new myofibers. These data reveal stage-specific roles of Brm during skeletal myogenesis, via formation of repressive and activatory SWI/SNF complexes.
Keywords: Brahma; SNF/SWI; cyclin D1; skeletal myogenesis; transcription.
© 2015 The Authors.
Figures
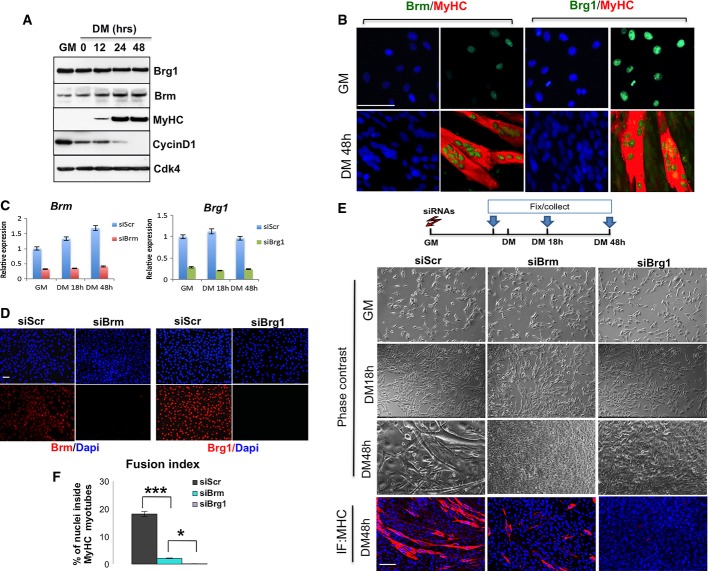
Time course of protein expression during terminal differentiation of C2C12 myoblasts representative of three independent experiments. Myoblasts were cultured in growth medium (GM) until they reached confluence, and then shifted to differentiate in differentiation medium (DM) for 48 h. Cellular extracts were analyzed by Western blot with antibodies against BRG1, Brm, myosin heavy chain (MyHC), and cyclin D1. Cdk4 probing was used to check for equal loading of the samples.
Immunofluorescence analysis of Brm and Brg1 expression in C2C12 cells cultured in GM or DM conditions. Scale bar, 50 μm.
Efficiency of BRM and BRG1 knockdown at 48 h post-transfection performed in C2C12 cells using siRNAs (control interference is a scrambled sequence and referred as siScr) was monitored by qRT–PCR. Data are presented as average ± SEM (n > 3).
Immunofluorescence for Brm or Brg1 performed in proliferating myoblasts upon siRNA against Brg1 (siBrg1), Brm (siBrm) or scrambled (siScr) to check for efficient depletion of the proteins. Scale bar, 50 μm.
Brightfield images and MyHC staining were performed at various time points of differentiation in C2C12 cells in which siRNAs were delivered in GM as depicted in the scheme above. Scale bar, 50 μm.
Quantification of fusion index of three independent experiments calculated as percentage of nuclei within MyHC-expressing myotubes. Data are presented as average ± SEM (n > 3). *P < 0.05; ***P < 0.001 (unpaired Student’s t-test).
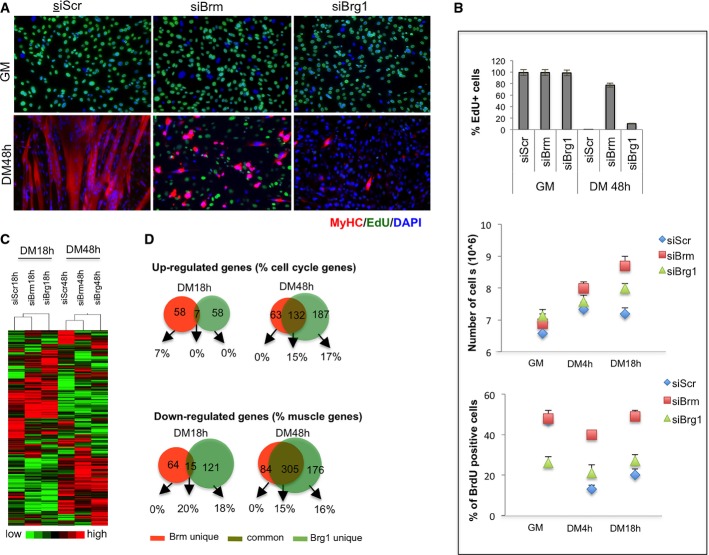
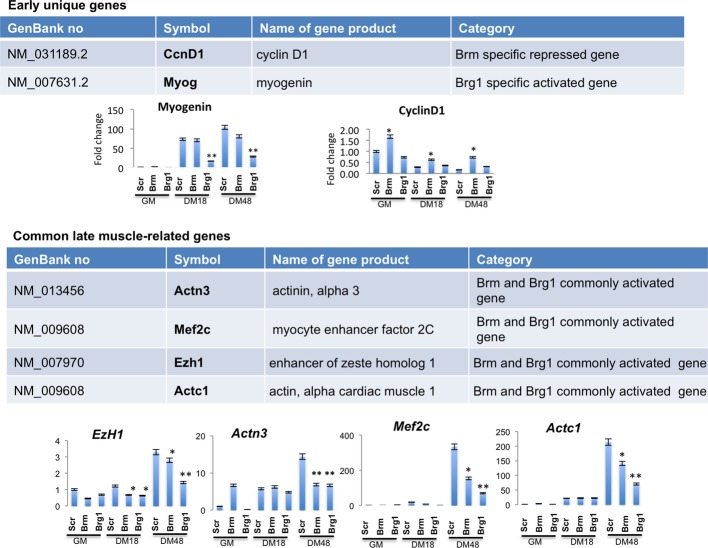
A, B C2C12 were depleted for Brm (siBrm), Brg1 (siBrg1), or a scrambled (siScr) sequence by small interfering RNA (siRNA) during proliferation (GM), and samples were analyzed at different time points during differentiation (DM 18 h and DM 48 h). Double EdU/MyHC staining was performed after incubation of EdU 12 h before fixing the cells (A). Scale bar, 50 μm. Percentage of EdU-positive cells was calculated counting 10 fields of EdU-positive cells (B, top graph). Proliferation analysis was performed by counting the number/field of siRNA-treated C2C12 at the time point indicated (B, middle graph) and by flow cytometry by BrdU incorporation (B, bottom graph) as percentage of BrdU+ cells. Data are presented as average ± SEM (n = 3).
C Heat map showing the expression profiles of transcripts in siRNA-treated C2C12 collected at 18 h and 48 h of differentiation.
D Venn diagram showing overlap between genes downregulated in C2C12 depleted for Brm and Brg1 at early (18 h) and late (48 h) differentiation time points. The percentage of skeletal muscle genes annotated in each category is indicated.
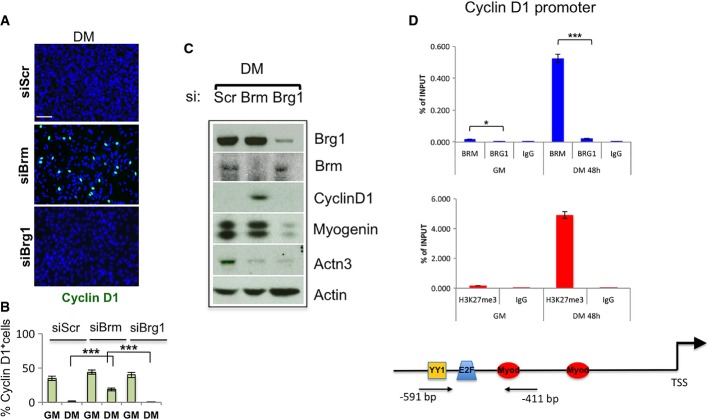
A, B Immunofluorescence analysis of cyclin D1 expression in C2C12 cells depleted for Brm (siBrm) or Brg1 (siBrg1) in DM 48 h (A) and relative quantification reporting the percentage (%) of cyclin D1-positive cells (B). Scale bar, 50 μm. Data are presented as average ± SEM (n > 3). P-value was calculated using unpaired Student’s t-test, ***P < 0.001. Experiments were performed at least three times.
C Western blot analysis performed in siBrm, siBrg1, and siScr C2C12 cells cultured in GM or DM, using antibodies against Brm, Brg1, cyclin D1, myogenin, and Actn3. α-actin was used as a loading control. Experiments were performed at least three times.
D Recruitment of Brg1 and Brm and analysis of H3K27me3 on a promoter sequence of the Ccnd1 gene in GM and DM. Arrows indicate the regions amplified by the primers used. Protein recruitment is expressed as relative enrichment of each factor compared to IgG after normalization for total input control (n = 3, error bars represent SEM). P-value was calculated using unpaired Student’s t-test, *P < 0.05; ***P < 0.001.
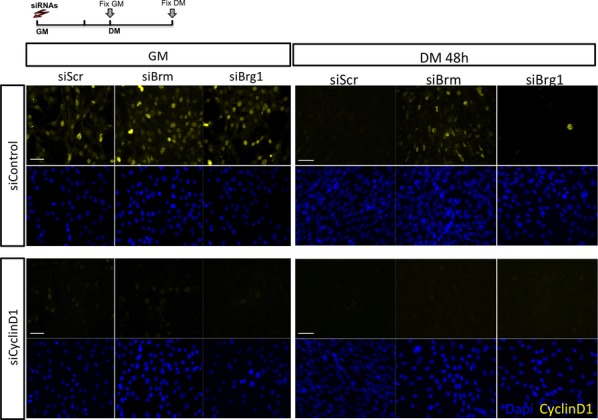
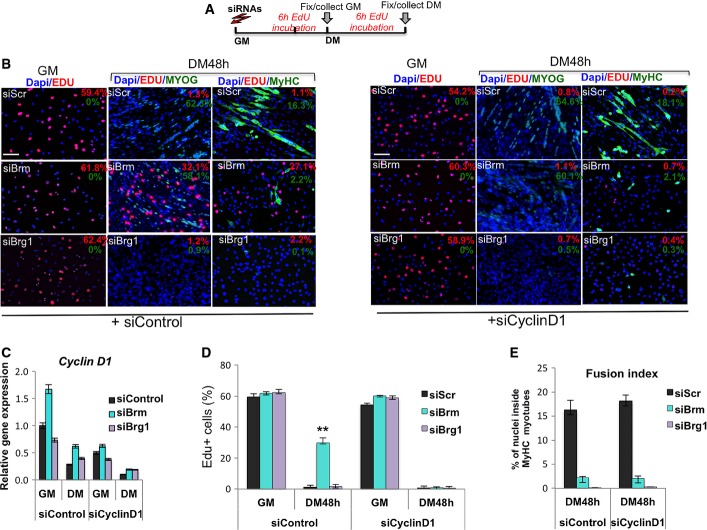
Schematic representation of the experimental setting, with siRNA delivered to C2C12 cells in GM and EdU pulses in GM or DM 6 h before collecting cells. Cyclin D1 (or control Scr) was downregulated by siRNA in C2C12 cells, which were subsequently interfered for Brm, Brg1, or scrambled sequences (siScr) by small interfering RNA (siRNA). Cells were then cultured in DM for 48 h.
Immunofluorescence analysis of EdU incorporation, myogenin and MyHC in C2C12 collected from experimental conditions indicated in (A). Percentages of positive nuclei or cells are indicated in the top right corner of each panel. Nuclei are counterstained with DAPI. The effect of siBrg1, siBrm, or siScr on EdU incorporation, myogenin and MyHC expression was evaluated in siScr (left panels) or siCyclinD1 (right panels) C2C12 cells. Scale bar, 50 μm.
Relative expression levels of Ccnd1 transcripts were monitored by qRT–PCR in siScr, siBrg1, and siBrm C2C12 cells in GM and DM (48 h). Data are presented as average ± SEM (n = 3).
Quantification of EdU incorporation in nuclei, as percentage of EdU-positive nuclei/total nuclei in randomly selected fields, in siScr, siBrg1, and siBrm C2C12 cells in GM and DM (48 h), in the presence or absence of siCyclinD1. Data are presented as average ± SEM (n > 3). ***P < 0.01 (unpaired Student’s t-test).
Fusion index was calculated by immunofluorescence staining, as percentage of nuclei within MyHC-expressing myotubes, performed in siScr, siBrg1, and siBrm C2C12 cells cultured in DM (48 h), in the presence or absence of siCyclinD1. Error bars represent average ± SEM (n = 3).
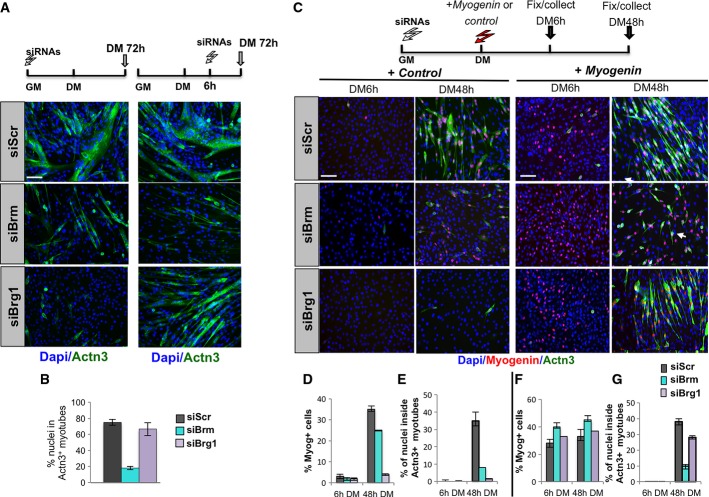
A Immunofluorescence performed in differentiated C2C12 treated with siRNAs at different times as indicated on top of each panel. Terminal differentiation was monitored by using Actn3 (green), and nuclei were visualized by DAPI. Scale bar, 50 μm.
B Quantification of fusion index calculated as percentage of nuclei within Actn3-expressing myotubes.
C Representative immunofluorescence images of siRNA-treated C2C12 cells stained for myogenin and Actn3 at 6 h and 48 h from DM incubation, following overexpression of Myog or control cDNA, as described in the top scheme. Scale bar, 50 μm.
D–G Quantification of myogenin nuclear staining, as percentage of myogenin-positive nuclei/total nuclei in randomly selected fields, in siBrm, siBrg1, or siScr C2C12 cells overexpressing a control cDNA (D) or myogenin vector (F). Fusion index was calculated by immunofluorescence staining, as percentage of nuclei within Actn3-expressing myotubes, in siBrm, siBrg1, or siScr C2C12 cDNA cells overexpressing a control cDNA (E) or myogenin vector (G).
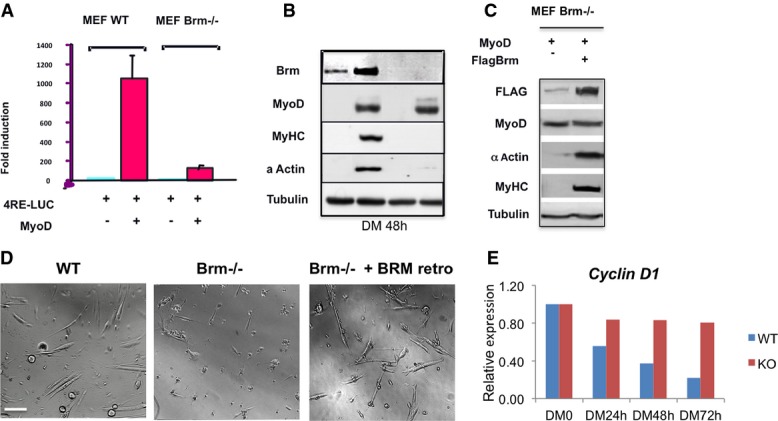
Luciferase assay in WT or Brm−/− mouse embryonic fibroblasts (MEFs) that were transfected with 4RELuc reporter and infected with MyoD. MEFs were transfected with the indicated constructs in GM. 24 h after transfection, the cells were shifted in differentiation medium, and harvested 48 h later for luciferase assay. Luciferase values are expressed as fold induction relative to the activity measured in the absence of MyoD. Data are shown as average ± SEM (n = 3).
Western blot revealing the expression levels of the indicated proteins in WT or Brm−/− MEFs under the conditions used for luciferase assay in (A).
Western blot of the indicated proteins after reintroduction of FLAG-tagged Brm in Brm−/− MEFs. After 2 days in growing medium, cells were transferred to differentiation medium and harvested 48 h later.
Brightfield images of satellite cells isolated from muscles of WT and Brm−/− mice, after reintroduction of Brm by retroviral expression vector. Scale bar, 50 μm.
Relative expression analysis in WT and Brm−/− MEFs infected with MyoD and induced to differentiate by switch with DM medium. Samples were collected at the time points indicated from the onset of differentiation induction (DM0). The expression levels are shown as relative to DM0, and the graph is representative of three independent experiments.
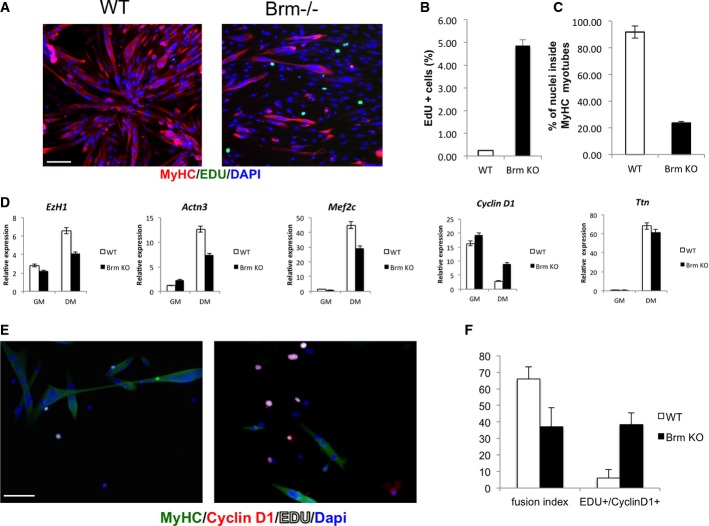
A Immunofluorescence staining of MyHC and EdU. Scale bar, 50 μm.
B Percentage of EdU-positive cells was calculated counting 10 fields of EdU-positive cells.
C Quantification of fusion index calculated as percentage of nuclei within MyHC-expressing myotubes.
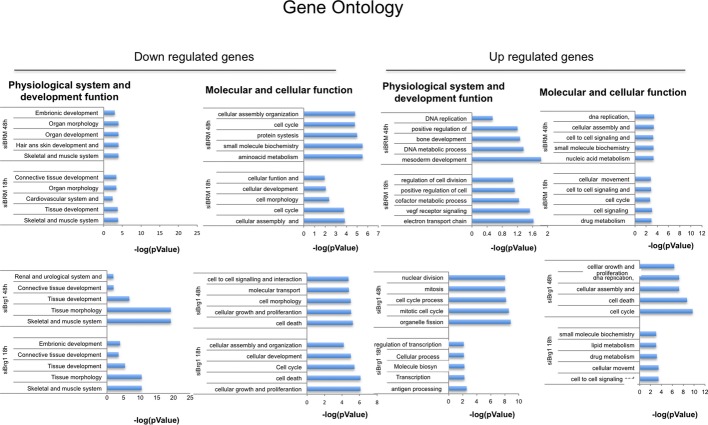
D Analysis of expression levels of transcripts of genes selected from microarray analysis.
E, F Immunofluorescence staining of WT (left)- and Brm−/− (right)-derived satellite cells for MyHC, EDU, and cyclin D1 (E); relative quantification of fusion index; and number of EDU+/cyclin D1+ cells (F). Scale bar, 50 μm. Data are shown as average ± SEM (n = 3).
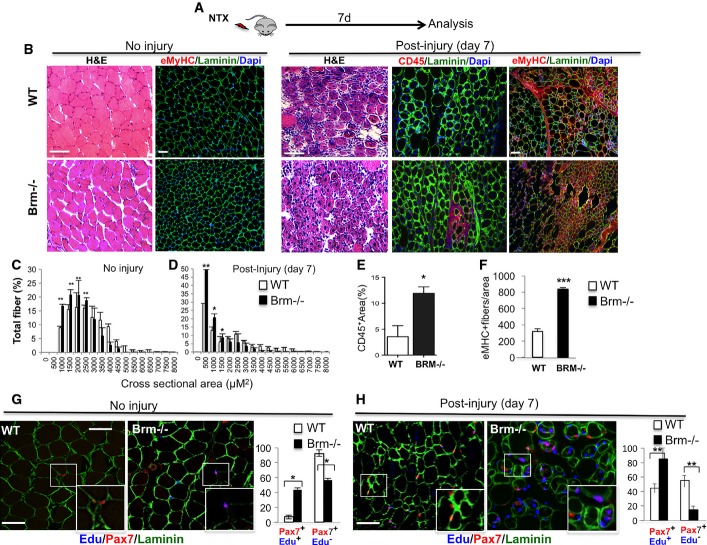
A Schematic representation of the experimental setting, showing the time of notexin-mediated muscle injury and tissue analysis (n = 4).
B Regeneration of tibialis anterior (TA) muscles from wild-type (WT) and Brm null (Brm−/−) 2.5-month-old mice was evaluated by morphological criteria (hematoxylin and eosin (H&E) staining), the presence of regenerating myofibers (laminin/embryonic MyHC) and the presence of inflammatory infiltration (laminin/CD45) 7 days after notexin injury. Scale bar, 50 μm.
C, D Analysis of cross-sectional area (CSA) of muscles represented as mean of CSA in WT and Brm−/− mice uninjured or post-injury.
E Quantification of % of area occupied by CD45-positive cells in randomly selected fields.
F Quantification of MyHC-positive fibers in randomly selected fields.
G, H In addition to notexin injury, as indicated in (A), WT and Brm−/− mice (2.5 months old) received intraperitoneal injection of EdU. Immunohistochemistry for Pax7, laminin and EdU were performed in sections from TA muscles to detect proliferating satellite cells (Pax7/EdU double-positive cells within laminin-positive fibers), and its relative quantification. Scale bar, 50 μm.
References
-
- Puri PL, Sartorelli V. Regulation of muscle regulatory factors by DNA-binding, interacting proteins, and post-transcriptional modifications. J Cell Physiol. 2000;185:155–173. - PubMed
-
- de la Serna IL, Ohkawa Y, Imbalzano AN. Chromatin remodelling in mammalian differentiation: lessons from ATP-dependent remodellers. Nat Rev Genet. 2006;7:461–473. - PubMed
Publication types
MeSH terms
Substances
Grants and funding
LinkOut - more resources
Full Text Sources
Other Literature Sources
Molecular Biology Databases
Research Materials
Miscellaneous
