Review
. 2015 Aug 3;54(32):9162-85.
doi: 10.1002/anie.201410653. Epub 2015 Jul 1.

Facing and Overcoming Sensitivity Challenges in Biomolecular NMR Spectroscopy

Affiliations
Review

Facing and Overcoming Sensitivity Challenges in Biomolecular NMR Spectroscopy

Jan-Henrik Ardenkjaer-Larsen et al. Angew Chem Int Ed Engl. .

Abstract

In the Spring of 2013, NMR spectroscopists convened at the Weizmann Institute in Israel to brainstorm on approaches to improve the sensitivity of NMR experiments, particularly when applied in biomolecular settings. This multi-author interdisciplinary Review presents a state-of-the-art description of the primary approaches that were considered. Topics discussed included the future of ultrahigh-field NMR systems, emerging NMR detection technologies, new approaches to nuclear hyperpolarization, and progress in sample preparation. All of these are orthogonal efforts, whose gains could multiply and thereby enhance the sensitivity of solid- and liquid-state experiments. While substantial advances have been made in all these areas, numerous challenges remain in the quest of endowing NMR spectroscopy with the sensitivity that has characterized forms of spectroscopies based on electrical or optical measurements. These challenges, and the ways by which scientists and engineers are striving to solve them, are also addressed.

Keywords: NMR probeheads; NMR spectroscopy; nuclear hyperpolarization; sensitivity enhancement; ultrahigh magnetic fields.


Figures

Figure 1
Figure 1
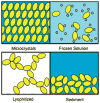
Different techniques of sample preparation for solid-state NMR experiments: crystallization, freezing with cryoprotectants, freeze-drying, and sedimentation.
Figure 2
Figure 2
Common NMR coil geometries: A) solenoid, B) saddle coil, C) inductively coupled HTS coils (drawings by Jason Kitchen, NHMFL).
Figure 3
Figure 3
Distribution of electric (E(t)) and magnetic fields (H(t)) for the most commonly used mode of a cylindrical dielectric resonator, the TE01 mode.
Figure 4
Figure 4
Increases in the maximum magnetic field strength used in high-resolution NMR spectroscopy over the past 40 years, with emphasis placed on the appearance of the first commercially available field.
Figure 5
Figure 5
Superconducting critical current density versus applied magnetic field for state-of-the-art Nb3Sn round wire (red arrow), isotropic Bi-2212 round wire (blue), anisotropic Bi-2223 tape (green), and anisotropic YBCO (REBCO) tape (yellow), for which the upper arrow corresponds to the magnetic field in the Cu-O planes and the lower arrow corresponds to the magnetic field perpendicular to the Cu-O planes. Recent experiments on Bi-2212 round wire have shown dramatic increases in the conductor critical current density following annealing in high-pressure oxygen[80] (plot by Peter Lee, NHMFL).
Figure 6
Figure 6
Homonuclear 13C cross-correlation spectrum for L-alanine at 30 T in a standard 33 T Bitter magnet at the HFML in Nijmegen with a 32 mm room-temperature bore with ferroshim and without electrical shims. A 1D digital frequency lock on a 2H reference was used, with feeding hardware controlled phase increments in the indirect dimension. The MAS spinning speed was 45 kHz, and recoupling was achieved by a rotor-synchronized SR62 sequence. Total measurement time about 30 min.
Figure 7
Figure 7
Schematic representation of a DNP experiment: The microwave irradiation drives electronic transitions that, in turn, cause enhancements of the nuclear polarization.
Figure 8
Figure 8
Interplay between the solid effect and the cross-effect mechanisms in solid-state 13C DNP.[123]
Figure 9
Figure 9
Solid-effect DNP enhancement profiles simulated for a model system of eight nuclei coupled to a single electron inside a “core” region (shown on the left). The small spheres demonstrate the relative positions of the spins. The curves on the left show their progressive polarization by microwave irradiation.[124]
Figure 10
Figure 10
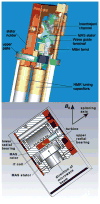
Top: Computer drawing of the interior of a DNP MAS probe with the waveguide terminal and the MAS stator. Bottom: Cross-section through the MAS stator showing the NMR radiofrequency solenoidal coil, the MAS rotor, and the sample space. The coordinate system y direction is parallel to the MAS rotor and coil axis, the z direction indicates the direction of the incident millimeter wave beam.
Figure 11
Figure 11
Forward scattering of a millimeter wave beam (Gaussian intensity distribution, hybrid mode HE11, linearly polarized) by a 3.2 mm outside diameter MAS rotor made of zirconia ceramics at a frequency of 263 GHz (wavelength 1.13 mm) in the plane of the incident beam orthogonal to the rotor axis. The rotor is outside of the field of view (below the lower edge of the field plot plane) and the beam propagates from the bottom to the top (along the z axis). Left: Plot of the magnitude of the electric field determined experimentally. Right: Simulated field distribution (magnitude of the Poynting vector field). Measurements and COMSOL simulations by E. de Rijk (EPFL) and SWISSto12, Lausanne.
Figure 12
Figure 12
Schematic diagram of the DNP system with the transfer line to the 400 MHz spectrometer. The position of the dissolution stick is shown before (A) and after dissolution (B). The frozen sample is irradiated in the 3.35 T magnet shown on the left, and shuttled rapidly using hot solvent and He chase gas after DNP at low temperature into the high-field system for NMR spectroscopy. Reproduced from Ref. [165] with permission.
Figure 13
Figure 13
Enhancement at 3.4 T as a function of the microwave power (94 GHz, power given in W) for water and TEMPOL with a concentration of 20 mM (A) and 100 mM (B). The solid line is a prediction from theory with all parameters determined independently from EPR and relaxometery measurements (see van Bentum et al.).[186] C) DNP enhancement achieved at 9.2 T plotted against the incident microwave power for 1M 14N-TEMPOL in water for three capillary sizes: 50 (▲), 30 (□), and 20 μm (★) internal diameter. The temperature increase is indicated by the dashed horizontal lines, crossing the curves at the indicated temperatures. Adapted from Ref. [191].
Figure 14
Figure 14
Double resonance structure used by Annino et al. for simultaneous in situ NMR and DNP using a high conversion factor nonradiative resonator.[193]
Figure 15
Figure 15
Setup of the shuttle DNP spectrometer, indicating the low-field position (LF, 0.34 T), 47 cm above the high-field position (HF, 14.1 T). The former includes microwave irradiation for DNP and the latter an RF coil for NMR detection. The sample transfers in 60 ms by pneumatic shuttling, with an accurate sample positioning (less than 50 μm). Detection of 1H and 13C signals with a 2H lock and occurs after the container is shuttled.
Figure 16
Figure 16
A) 1H Enhancement of 10 mM tryptophan in 4.5 μL D2O in the presence of 10 mM [D16,15N]-TEMPONE, polarization time of 3 s, T = 52°C. 64 scans. B) 13C Enhancement of 50 mM [2H8,13C11,15N2]-tryptophan in 4.5 μL D2O in the presence of 10 mM [D16,15N]-TEMPONE, polarization time of 3 s, T = 52°C, 4096 scans. All signals now show negative enhancement.
Figure 17
Figure 17
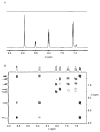
A) Bottom: 1D 1H NMR spectrum of nicotinamide that was hyperpolarized under SABRE. Top: the analogous spectrum collected under Boltzmann controlled populations. B) 2D 1H-COSY spectrum of hyperpolarized quinolone collected using the SABRE method and the automated polarizer described in Ref. [213].

References

    1. Ding Y, Yao Y, Marassi FM. Acc Chem Res. 2013;46:2182–2190. - PMC - PubMed
    1. Opella SJ. Acc Chem Res. 2013;46:2145–2153. - PMC - PubMed
    1. Murray DT, Das N, Cross TA. Acc Chem Res. 2013;46:2172–2181. - PMC - PubMed
    1. Tycko R. Annu Rev Phys Chem. 2011;62:279–299. - PMC - PubMed
    1. Williamson MP, Havel TF, Wüthrich K. J Mol Biol. 1985;182:295–315. - PubMed

Publication types

MeSH terms