. 2015 Aug 1;195(3):901-23.
doi: 10.4049/jimmunol.1403189. Epub 2015 Jul 1.

TLR-9 and IL-15 Synergy Promotes the In Vitro Clonal Expansion of Chronic Lymphocytic Leukemia B Cells

Affiliations

TLR-9 and IL-15 Synergy Promotes the In Vitro Clonal Expansion of Chronic Lymphocytic Leukemia B Cells

Patricia K A Mongini et al. J Immunol. .

Abstract

Clinical progression of B cell chronic lymphocytic leukemia (B-CLL) reflects the clone's Ag receptor (BCR) and involves stroma-dependent B-CLL growth within lymphoid tissue. Uniformly elevated expression of TLR-9, occasional MYD88 mutations, and BCR specificity for DNA or Ags physically linked to DNA together suggest that TLR-9 signaling is important in driving B-CLL growth in patients. Nevertheless, reports of apoptosis after B-CLL exposure to CpG oligodeoxynucleotide (ODN) raised questions about a central role for TLR-9. Because normal memory B cells proliferate vigorously to ODN+IL-15, a cytokine found in stromal cells of bone marrow, lymph nodes, and spleen, we examined whether this was true for B-CLL cells. Through a CFSE-based assay for quantitatively monitoring in vitro clonal proliferation/survival, we show that IL-15 precludes TLR-9-induced apoptosis and permits significant B-CLL clonal expansion regardless of the clone's BCR mutation status. A robust response to ODN+IL-15 was positively linked to presence of chromosomal anomalies (trisomy-12 or ataxia telangiectasia mutated anomaly + del13q14) and negatively linked to a very high proportion of CD38(+) cells within the blood-derived B-CLL population. Furthermore, a clone's intrinsic potential for in vitro growth correlated directly with doubling time in blood, in the case of B-CLL with Ig H chain V region-unmutated BCR and <30% CD38(+) cells in blood. Finally, in vitro high-proliferator status was statistically linked to diminished patient survival. These findings, together with immunohistochemical evidence of apoptotic cells and IL-15-producing cells proximal to B-CLL pseudofollicles in patient spleens, suggest that collaborative ODN and IL-15 signaling may promote in vivo B-CLL growth.


Figures

FIGURE 1.
FIGURE 1.
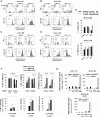
ODN+IL-15 signaling induces M-CLL and U-CLL clonal expansion. (AD) Plots showing viability gating and CFSE division histograms (for viable cells) in IGHV U-CLL 430 and 996 (A and C) and IGHV M-CLL 693 and 1031 (B and D) clones at day 6 after culture with IL-15 alone, ODN alone, or both ODN+IL-15. Plots in (A) and (B) reveal the presence of calibration beads (upper left gate) added for quantification of absolute yield of viable cells (as for G) and as a means of discerning the threshold between debris and intact (via or dead) cells (see Supplemental Fig. 1). (E) Pan-caspase inhibitor (Z-VAD-FMK) inhibits ODN-induced death in M-CLL, consistent with an apoptotic mechanism. Immediately after B-CLL culture with the indicated stimuli, sets of parallel cultures were pulsed with Z-VAD-FMK (40 μM) or vehicle control (DMSO). Cells were harvested at day 3, stained with viable cell exclusion Dye 450, and fixed and analyzed by flow cytometry for viable/dead cells. Data are expressed as mean ± SEM values of triplicate cultures. Asterisks indicate that differences between DMSO versus Z-VAD–treated cultures were statistically significant (p < 0.01) on the basis of a two-sided, unpaired Student t test. (F, top panels) Pooled analysis (mean ± SD) of experiments with six IGHV U and six IGHV M B-CLL clones showing (top left panel) % viability in undivided gate of total viable+apoptotic CFSE-labeled cells, (top middle panel) % viability in DIV gate of total viable+apoptotic cells, and (top right panel) % DIV cells within all gated viable cells after 6–7 d of culture with stimulants shown. The p values for two-sided significance are indicated. Bottom panels, Similar analysis of the ODN ± IL-15 responses of purified normal human PB B cells (determined to be 98% CD19+ with 27% CD27+ memory B cells before culture). Values represent the mean ± SEM of quadruplicate cultures; asterisks indicate statistically significant differences. (G) Absolute yield of viable B-CLL cells (undivided or DIV) from representative experiments with IGHV U-CLL 770, IGHV M-CLL 922, or normal PB B cells. Each was cultured with the indicated stimuli for 6 d before addition of calibration beads and harvest. Bars represent mean ± SEM values from three to four replicate cultures.
FIGURE 2.
FIGURE 2.
Photomicrographs of M-CLL 1031 (AC), U-CLL 996 (DF), and normal B cells from PB (GI) after 6 d of culture in IL-15 alone (A, D, and G), ODN alone (B, E, and H), or both ODN+IL-15 (C, F, and I). Culture of M-CLL with ODN alone (B) typically induces prominent loss of cell volume and formation of debris, not seen with similarly cultured U-CLL (E) or normal B cells (F). Stimulation with ODN+IL-15 induces notable cell enlargement, larger clump formation, and significant cell proliferation in M-CLL (C), U-CLL (F), and normal B cell (I) cultures. Photographs were taken at original magnification ×200 using an Olympus BX40 phase-contrast microscope equipped with an Olympus DP20 camera.
FIGURE 3.
FIGURE 3.
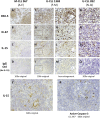
IL-15–producing cells are present, proximal to pseudofollicles, in B-CLL–infiltrated spleens harboring apoptotic cells. Serial sections of fixed and embedded splenic tissue from three B-CLL patients (M-CLL 967 with negative FISH and both U-CLL 1369 and 852, positive for del17p) were stained for the B cell–specific transcription factor, PAX-5 (A, F, J, and N), proliferation marker Ki-67 (B, G, K, and O); or IL-15 (C, E, H, L, and P). A separate section of the same tissue stained for IL-15 was stained with goat IgG control on the same slide (D, I, M, and Q). In addition, a section of the U-CLL 967–infiltrated spleen was stained for active (cleaved) caspase-3 (Asp175), a marker for apoptotic cells (R). (E and R) Represent higher magnification (600×) photographs of differing sections of CLL-967 from (A) to (D), whereas (J)–(M) represent enlargements of the boxed pseudofollicle section in (F)–(I), respectively (from U-CLL 1369–infiltrated spleen). The surgical pathology report (case number: FS08-8095; Genzyme specimen number: 08-50886842-MH) for the M-CLL 967 spleen noted: “A markedly enlarged spleen (>2 kg) in a patient with a history of CLL/SLL. Infiltrated lymphocytes are small to medium with round to oval to nuclear contours and inconspicuous nucleoli. Cells are located in both white pulp and red pulp. They are positive for CD20, PAX5, CD5, CD43, Bcl-2, with kappa l.c. restriction and negative for CD10, CD23, Bcl-1, Bcl-6, MUM-1 and T cell markers.” The pathology reports for U-CLL 1369/U-CLL 852 were not available, but it was evident that little normal splenic architecture remained in U-CLL 852. Photographs were taken from an Olympus BX40 microscope using 10×, 20× and 60× UPLanFl oil immersion objectives and an Olympus DP20 camera. The images involving thicker sections of U-CLL852 spleen were brightened to better distinguish the specific brown staining from the very dark hematoxylin staining of nuclei.
FIGURE 4.
FIGURE 4.
FDCs colocalize with IL-15–producing cells in pseudofollicles of a B-CLL–infiltrated spleen. Serial sections of CLL-967–infiltrated spleen harboring numerous PAX-5+ (A) and Ki-67+ (B) pseudofollicles (stained as in Fig. 3) were stained for IL-15 (D and F) or for a carbohydrate Ag unique to human FDCs (CNA.42) (67) (C and E). A region of the spleen with clearly identifiable landmarks was selected for the visualization of these respective molecules. (A–D) Panels represent original magnifications ×100 of the region of interest. (E and F) Panels represent original magnifications ×600 of the boxed regions shown in (C) and (D) for FDC-specific CNA.42 and IL-15, respectively. (F) Image was hue-enhanced to convert yellow-brown stained cells to red, which is better visualized against a background of blue nuclei.
FIGURE 5.
FIGURE 5.
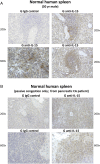
IL-15–producing cells can be detected within the white pulp of normal human spleens. Tissue sections were derived from two human spleens (A and B), determined to be normal upon pathological examination (see Materials and Methods). They were stained and examined for human IL-15, as described for Fig. 3. Cells positive for cytoplasmic IL-15 were found scattered throughout the white pulp of each spleen, in patterns similar to those shown in the present images. A rim of more dense IL-15+ cells often appeared to encircle follicles [as in the lower right panel in (A)], suggesting possible marginal zone localization. In addition, cells with more intense IL-15 expression were sometimes found proximal to the splenic artery [as in the upper right panel in (A)].
FIGURE 6.
FIGURE 6.
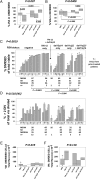
Membrane expression of CD38 rises in replicating blasts during ODN+IL–15-induced B-CLL clonal expansion. (A and B) Cell-surface CD38 levels were assessed on gated viable cells at time 0 and after 3–6 d of CFSE-labeled B-CLL culture with stimulant: IL-15 only, ODN only, or both ODN+IL-15. U-CLL 675 and U-CLL 430 represented B-CLL with relatively high and low proportions, respectively, of CD38+ cells in blood (anti-CD38 = darker shading; IgG control = light). Both populations appear to notably upregulate CD38 expression during divisions triggered by ODN+IL-15. (C) ODN+IL-15–stimulated U-CLL 430 cells were stained for CD38 and gated for viability and division status (on the basis of CFSE fluorescence). Histograms represent the fluorescence intensity of CD38-stained (or IgG control-stained) cells within each division subset and show definitively that CD38 expression rises with each incremental division. (D) Summary of experiments monitoring CD38 expression in ODN+IL-15–stimulated B-CLL cultures (n = total of 5 CLL; top panels represent % CD38+ cells in each division subset; bottom panels represent CD38 level, represented by the ratio of allophycocyanin anti-CD38 fluorescence intensity/allophycocyanin-IgG control fluorescence intensity).
FIGURE 7.
FIGURE 7.
IGHV unmutated and mutated B-CLL subsets both display notable interclonal diversity in ODN+IL-15–induced growth. CFSE-labeled (A) U-CLL cells (n = 20) and (B) M-CLL cells (n = 18), each at 105 cells/culture, were stimulated for 6–7 d with ODN+IL-15 before harvest with standardization beads, fixation, and FACS analysis for division status and viability (as in Supplemental Figs. 1, 3). A few cultures manifesting earlier peak division were harvested at day 5 to prevent death from nutrient deprivation. Experimental data shown represent the absolute recovery of gated viable or dead cells within the designated categories: undivided, total DIV, or DIV with more than two divisions. The data are shown in stacked bar format for each B-CLL clone (indicated by ID on the abscissa). (Note: M-CLL 1258 and M-CLL 1260 are not represented because experiments with the latter B-CLL did not include standardization beads). SEM of triplicate/quadruplicate cultures was nearly always <15% of the mean value, and most typically <5% (as in Fig. 1G). On rare occasions when the calculated absolute cell yield in one replicate varied >2-fold from the others, it was determined to be an outlier and excluded. Mann–Whitney rank sum tests were performed to evaluate whether the U-CLL and M-CLL subgroups varied in their responses within any one measurement category. No statistically significant differences were noted.
FIGURE 8.
FIGURE 8.
Effect of common B-CLL genetic anomalies on survival/growth properties of ODN+IL-15–stimulated B-CLL clones. B-CLL clones in Table I were subdivided on the basis of FISH analyses for TRI-12, del13q14, and del11q22 (ATM). B-CLL849 was the only TRI-12+ population additionally positive for del13q14. It was considered independent of the group expressing TRI-12 alone (n = 5) and not included in any of the statistical evaluations. *CLL770 was placed in the group with both del13q14 and del11q22 on the basis of harboring two ATM mutations. *CLL430 possessed both del11q22 and del13q14 and one ATM mutation. B-CLL subgroups were compared for % viability in the (A) undivided and (B) DIV cell gates; (C) % of viable-gated cells showing evidence of division; (D) % of DIV viable cells with more than two divisions; (E) absolute recovery of viable, undivided cells per culture; and (F) absolute recovery of viable DIV blasts per culture. (C and D) The responses of B-CLL evaluated in a single experiment are shown by bars representing the intraexperimental mean ± SD of triplicate cultures; values for other B-CLL in bold (ID 346, 1300, 624, 321, 1013, 945, 1086, 940, 1328, 1380, 922, 675, 430, 887, and 770) represent the mean ± SD value from two to four separate experiments with the same B-CLL. The T atop certain bars indicates that this B-CLL population derived from a patient who received treatment at ≥8 mo prior to acquisition of leukemic B cells from blood (see Table I). The p values placed above each plot are derived from the Kruskal–Wallis test for differences within the multiple groups and represent Monte Carlo estimates for the exact test. The p values within (or below) the plots are derived from Wilcoxon rank sum test for differences between paired groups, as indicated in Materials and Methods.
FIGURE 9.
FIGURE 9.
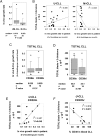
B-CLL intrinsic potential for ODN+IL-15–induced growth versus in vivo GR and expression of CD38+ cells in blood. (A) The in vivo GR of U-CLL (n = 16) and M-CLL (n = 20) clones are compared in box-plot format; they were statistically different (p = 0.03). These clones represent those from which serial blood lymphocyte counts at or near the time of blood acquisition for functional study were available. (B) Potential for in vitro clonal expansion, as indicated by the absolute yield of total lymphoblasts (viable + dead) in ODN+IL-15–stimulated cultures (y-axis) was compared with the in vivo B-CLL GR (x-axis), calculated from the lymphocyte doubling time in blood (see Materials and Methods). No statistically significant relationship was observed, although the suggestion of a positive relationship was seen in some U-CLL clones. (C and D) B-CLL clones, whose blood leukemic cells had been assayed for CD38 expression at or near the time of blood acquisition for these studies, were subdivided into CD38high and CD38low subsets and compared for (C) in vivo GR and (D) ODN+IL-15–induced in vitro clonal expansion. These comparisons show a trend (albeit not of statistical significance) for CD38high B-CLL to show greater in vivo GR and lesser in vitro growth, as compared with CD38low B-CLL. We note that when the total CLL cohort was first subdivided into U-CLL and M-CLL subsets and then examined in a similar manner, similar trends were observed: 1) in vivo GR: for U-CLL, medians = 0.025 and 0.063 for CD38low and CD38high, respectively; for M-CLL, medians = 0.018 and 0.027, respectively; and 2) in vitro yield of highly DIV cells: for U-CLL, medians = 119,400 and 68,900 for CD38low and CD38high, respectively; for M-CLL, medians = 137,000 and 37,200, respectively. No statistical significance was reached with the limiting sample size. (E) Regression analysis showing the relationship between in vitro and in vivo growth within CD38low U-CLL. A statistically significant relationship was seen (p = 0.046). (F) Regression analysis showing the relationship between absolute frequency of CD38+ cells within CD38high U-CLL and ODN+IL-15–induced clonal expansion. A highly significant inverse relationship was found (p < 0.001).
FIGURE 10.
FIGURE 10.
In vitro high-proliferator status of U-CLL, but not M-CLL, is statistically linked to overall patient survival. The 40 B-CLL clones tested for in vitro clonal expansion in response to ODN+IL-15 were analyzed for clinical progression using (A) TFT and (B) OS as indicators. The total cohort and U-CLL and M-CLL subsets were each subdivided into high-proliferator clones (>50% of total viable cells with more than two DIV) or low-proliferator clones (≤50% of total with more than two DIV). For OS, the differing groups were distributed in the following manner: total B-CLL: low = 21 censored, 1 death; high = 13 censored, 5 deaths; U-CLL: low = 10 censored, 0 deaths; high = 5 censored, 5 deaths; M-CLL: low = 11 censored, 1 death; high = 8 censored, 0 deaths. The U-CLL populations with diminished OS included CLL 1013 (TRI-12), CLL 430 (del11q22 + del13q14 + ATM mutation), CLL 675 (del11q22 + del13q14), CLL 1158 (del11q22 + del13q14), and CLL 996 (negative for tested FISH anomalies). Kaplan–Meier analysis was performed to discern whether the high-proliferator subgroup significantly differed from the low-proliferator subgroup regarding TFT or OS. No significant difference between subgroups was noted for TFT. Nonetheless, patients with high proliferator clones (total cohort and U-CLL cohort) appeared to have shortened OS as compared with those that did not (p = 0.015 for total clones was statistically significant; p = 0.083 for U-CLL clones approached significance). There was no significant difference in the OS of M-CLL clones with high- or low-proliferator status (p = 1.00).
FIGURE 11.
FIGURE 11.
Schematic illustrating hypothesized role for TLR and IL-15 signaling and genomic aberrations that mitigate p53 axis function for B-CLL growth within lymphoid tissue pseudofollicles. Synergy between CpG DNA from microbes and/or apoptotic cells and IL-15 bound to membranes of IL-15–producing cells (43, 103) and/or in the form of cleaved IL-15Rα/IL-15 complexes (71) may constitute an important external stimulus for promoting the growth of B-CLL leukemic cells within tissue pseudofollicles. B-CLL clonal expansion is likely strongly influenced by factors intrinsic to the leukemic cells themselves, for example, presence of genomic aberrations that counteract activation-linked, lymphocyte apoptosis and cell-cycle control. In addition, interactions with PECAM-expressing endothelial cells may protect recently proliferated CD38high cells from functional senescence and/or help sustain their survival (150).

Similar articles

Cited by

References

    1. Redaelli A., Laskin B. L., Stephens J. M., Botteman M. F., Pashos C. L. 2004. The clinical and epidemiological burden of chronic lymphocytic leukaemia. Eur. J. Cancer Care (Engl.) 13: 279–287. - PubMed
    1. Byrd J. C., Furman R. R., Coutre S. E., Flinn I. W., Burger J. A., Blum K. A., Grant B., Sharman J. P., Coleman M., Wierda W. G., et al. 2013. Targeting BTK with ibrutinib in relapsed chronic lymphocytic leukemia. N. Engl. J. Med. 369: 32–42. - PMC - PubMed
    1. Furman R. R., Sharman J. P., Coutre S. E., Cheson B. D., Pagel J. M., Hillmen P., Barrientos J. C., Zelenetz A. D., Kipps T. J., Flinn I., et al. 2014. Idelalisib and rituximab in relapsed chronic lymphocytic leukemia. N. Engl. J. Med. 370: 997–1007. - PMC - PubMed
    1. Messmer B. T., Messmer D., Allen S. L., Kolitz J. E., Kudalkar P., Cesar D., Murphy E. J., Koduru P., Ferrarini M., Zupo S., et al. 2005. In vivo measurements document the dynamic cellular kinetics of chronic lymphocytic leukemia B cells. J. Clin. Invest. 115: 755–764. - PMC - PubMed
    1. van Gent R., Kater A. P., Otto S. A., Jaspers A., Borghans J. A., Vrisekoop N., Ackermans M. A., Ruiter A. F., Wittebol S., Eldering E., et al. 2008. In vivo dynamics of stable chronic lymphocytic leukemia inversely correlate with somatic hypermutation levels and suggest no major leukemic turnover in bone marrow. Cancer Res. 68: 10137–10144. - PubMed

Publication types

MeSH terms