. 2015 Sep;89(18):9440-53.
doi: 10.1128/JVI.01087-15. Epub 2015 Jul 1.

Host Cell Plasma Membrane Phosphatidylserine Regulates the Assembly and Budding of Ebola Virus

Affiliations

Host Cell Plasma Membrane Phosphatidylserine Regulates the Assembly and Budding of Ebola Virus

Emmanuel Adu-Gyamfi et al. J Virol. 2015 Sep.

Abstract

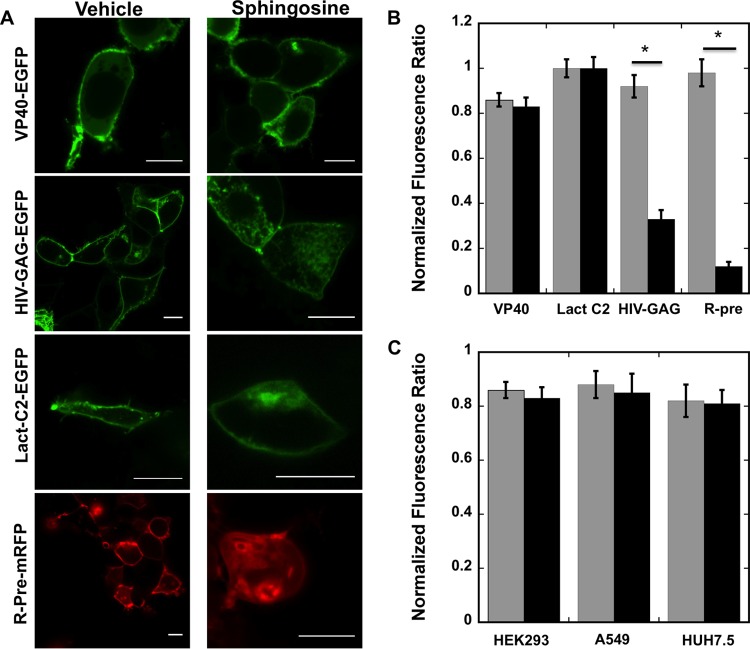
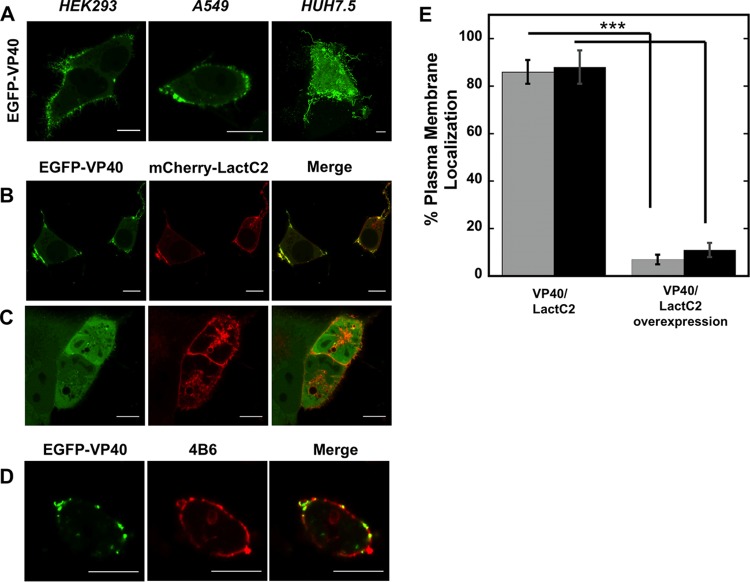
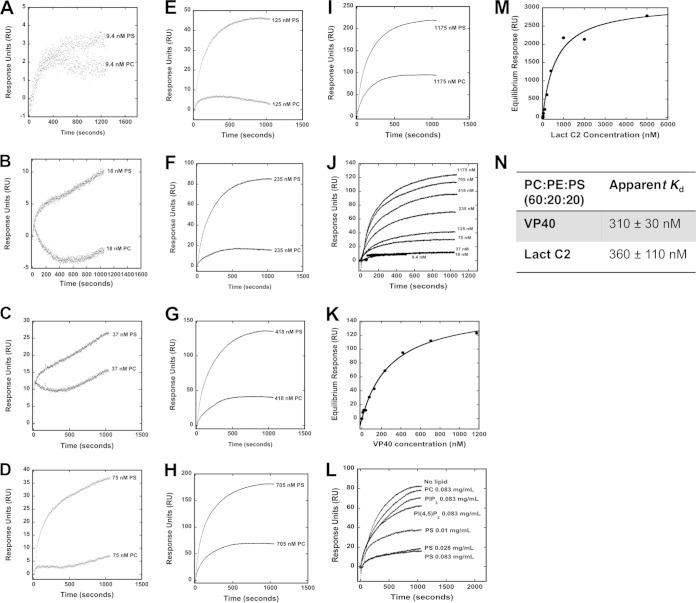
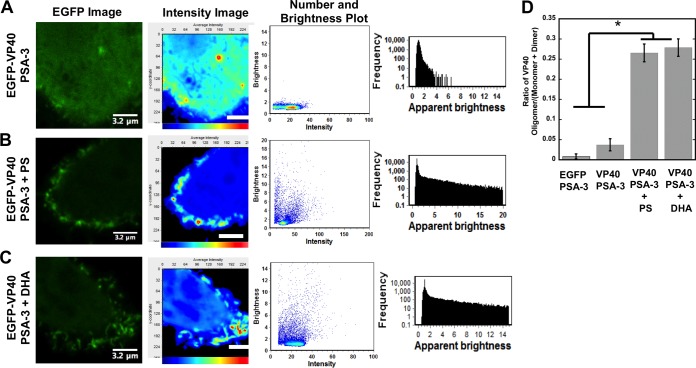
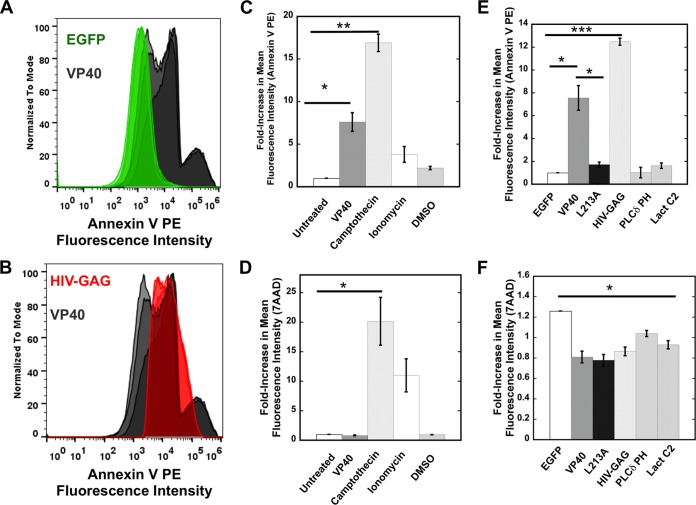
Lipid-enveloped viruses replicate and bud from the host cell where they acquire their lipid coat. Ebola virus, which buds from the plasma membrane of the host cell, causes viral hemorrhagic fever and has a high fatality rate. To date, little has been known about how budding and egress of Ebola virus are mediated at the plasma membrane. We have found that the lipid phosphatidylserine (PS) regulates the assembly of Ebola virus matrix protein VP40. VP40 binds PS-containing membranes with nanomolar affinity, and binding of PS regulates VP40 localization and oligomerization on the plasma membrane inner leaflet. Further, alteration of PS levels in mammalian cells inhibits assembly and egress of VP40. Notably, interactions of VP40 with the plasma membrane induced exposure of PS on the outer leaflet of the plasma membrane at sites of egress, whereas PS is typically found only on the inner leaflet. Taking the data together, we present a model accounting for the role of plasma membrane PS in assembly of Ebola virus-like particles.

Importance: The lipid-enveloped Ebola virus causes severe infection with a high mortality rate and currently lacks FDA-approved therapeutics or vaccines. Ebola virus harbors just seven genes in its genome, and there is a critical requirement for acquisition of its lipid envelope from the plasma membrane of the human cell that it infects during the replication process. There is, however, a dearth of information available on the required contents of this envelope for egress and subsequent attachment and entry. Here we demonstrate that plasma membrane phosphatidylserine is critical for Ebola virus budding from the host cell plasma membrane. This report, to our knowledge, is the first to highlight the role of lipids in human cell membranes in the Ebola virus replication cycle and draws a clear link between selective binding and transport of a lipid across the membrane of the human cell and use of that lipid for subsequent viral entry.


Figures

FIG 1
FIG 1
Cellular imaging and distribution change with and without sphingosine treatment. (A) HEK293 cells expressing fluorescent fusion constructs of VP40, HIV-1 gag, Lact C2, or Rpre are shown after 1 h of treatment with vehicle (dimethyl sulfoxide [DMSO]) or 75 μM sphingosine. Bars, 10 μm. (B) HEK293 cells displaying detectable PM localization were quantified for the respective constructs following treatment with vehicle (gray bars) or 75 μM sphingosine (black bars). Three independent experiments were performed to determine the standard deviation (SD) for each measurement. *, P < 0.002. (C) HEK293, A549, or HUH7.5 cells displaying detectable plasma membrane localization were quantified with vehicle (gray bars) or 75 μM sphingosine (black bars). Three independent experiments were performed to determine the SD for each measurement.
FIG 2
FIG 2
Cellular localization of VP40. (A) EGFP-VP40 robustly localizes and induces filamentous plasma membrane assembly in HEK293, A549, and HUH7.5 cells. Bars, 10 μm. (B) EGFP-VP40 cotransfected with an equimolar concentration of mCherry-Lact C2 displays colocalization signal with Lact C2 at regions of VP40 plasma membrane localization in HEK293 cells. One limitation of the colocalization analysis is local folding of the plasma membrane, which cannot be ruled out for the colocalization signals as shown. Bars, 10 μm. (C) A 5-fold difference in the mCherry-Lact C2/EGFP-VP40 transfection ratio significantly reduces VP40 plasma membrane localization in A549 cells. Bars, 10 μm. (D) EGFP-VP40 exhibits colocalization signal with the anti-phosphatidylserine antibody 4B6. CHOK-1 cells are shown. Bars, 10 μm. (E) Quantification of plasma membrane localization of VP40 plasma membrane localization in HEK293 cells (gray bars) and A549 cells (black bars) at an equimolar transfection ratio (left column) and a 5-fold increase in the Lact C2/VP40 transfection ratio. n = 3 independent experiments, with 500 cells assessed per experiment to determine SD. ***, P < 0.001.
FIG 3
FIG 3
SPR binding measurements of VP40 and Lact C2 with PS-containing vesicles. (A to I) Different concentrations of VP40 were injected into the Biacore X instrument, where flow cell 1 contained POPC:POPE (80:20) vesicles and flow cell 2 contained POPC:POPE:POPS (60:20:20). A flow rate of 5 μl/min was used for each injection. Flow cell 1 and flow cell 2 response unit (RU) values before VP40 injections were normalized to zero to present VP40 binding sensorgrams as shown. (J) Increasing concentrations (9.4 to 1,175 nM) of VP40 were assessed for binding to POPC:POPE:POPS (60:20:20) vesicles to determine the saturation response at each concentration to determine the apparent Kd. POPC:POPE (80:20) vesicles were used on a different flow channel for the control and subtracted to yield the respective curves (as derived from panels A to I). (K) The saturation response values determined from the data in panel J were plotted against the VP40 concentration to determine the apparent Kd value for PS-containing vesicles. (L) A SPR competition assay indicates that PS-containing vesicles but not PC-, PI(4,5)P2-, or PI(3,4,5)P3-containing vesicles preincubated with VP40 are able to compete for VP40 binding to a sensor surface coated with PS-containing vesicles. (M) The saturation response values determined for Lact C2 at increasing protein concentrations were plotted to determine the apparent Kd value for PS-containing vesicles. (N) Apparent Kd values determined for VP40 and Lact C2 binding to POPS-containing vesicles. n = 3 for VP40 and n = 4 for Lact C2 to determine the standard deviation (SD).
FIG 4
FIG 4
Plasma membrane PS content regulates VP40 localization, assembly, and viral egress. (A) VP40 lacked significant plasma membrane localization and evidence of egress from the PS-deficient PSA-3 cell line compared to the parent CHOK-1 cell line. VP40 plasma membrane localization and evidence of egress could be restored with the supplementation of POPS in the media. VP40 WEA and HIV-GAG images of CHOK-1 cells, PSA cells, and PSA-plus-PS cells are also shown. Bars, 10 μm. (B) Cells were counted for detectable plasma membrane localization. Experiments were repeated in triplicate to calculate the standard errors of the means (SEM) as indicated. n = 3 independent experiments to determine the SD. Plasma membrane localization of WT VP40 was significantly increased when PSA-3 cells were supplemented with PS compared to PSA-3 cells without PS. (C) The PM PS content was assessed using the enzymatic assay described in Materials and Methods. PSA-3 cells display a nearly 30% reduction in PM PS content, whereas supplementing the cellular media with either PS or DHA restores and increases the PM PS content. (D) Cell lysates (CL) and purified plasma membranes (M) from CHOK-1, PSA-3, and PSA-3 cells treated with either PS or DHA were analyzed via Western blotting using an anticalnexin antibody to assess for ER contamination of the purified plasma membrane. CL, cell lysate; M, plasma membrane. (E) An ELISA demonstrates that PSA-3 cells have a 10-fold reduction in VP40 egress. n = 3 independent experiments to determine the standard errors of the means (SEM). (F) Western blot analysis was performed in triplicate to detect VLPs from CHOK-1 and PSA-3 cells using an anti-EGFP antibody. Cell lysate and GAPDH were also monitored for VP40 expression and a loading control, respectively. *, P < 0.01; **, P < 0.001; ***, P < 0.0001.
FIG 5
FIG 5
Plasma membrane PS content regulates VP40 plasma membrane oligomerization. (A to C) VP40 oligomerization was assessed using confocal microscopy with N&B analysis in PSA-3 cells without supplementation (A), PSA-3 cells supplemented with PS (B), or PSA-3 cells supplemented with DHA (C). The EGFP image acquired is shown in the first column; the cellular average-intensity map (second column; scale bars are 3.2 μm) demonstrates the lack of EGFP-VP40 plasma membrane signal in PSA-3 cells and lack of enriched intensity characteristic of oligomerization. The second column of each panel shows a brightness-versus-intensity plot demonstrating the lack of VP40 oligomerization in PSA-3 cells. A frequency-versus-apparent-brightness plot (third column of each) demonstrates significant oligomerization of VP40 at or near the PM of PSA-3 cells upon PS supplementation. n = 4 independent experiments for each condition. y-coordinate, pixels. (D) Histogram plot of the VP40 oligomer/VP40 (monomer-plus-dimer) ratio to demonstrate the reduction in VP40 oligomerization in PSA-3 cells without supplementation compared to PSA-3 cells supplemented with PS or DHA. n = 4 independent experiments. One-way analysis of variance (ANOVA) was used to calculate the SEM and P values. *, P < 0.001.
FIG 6
FIG 6
Flow cytometry analysis of PS exposure. (A) HEK293 cells expressing EGFP or EGFP-VP40 were stained with annexin V PE according to the protocol detailed in Materials and Methods. The fluorescence intensity was normalized to the mode; data represent the results of independent experiments performed in triplicate. (B) HEK293 cells expressing EGFP–HIV-1 gag or EGFP-VP40 were stained with annexin V PE according to the protocol detailed in Materials and Methods. Note that the VP40 signals shown in panels A and B are the same to facilitate comparisons. (C) Annexin V staining was performed for HEK293 cells with or without VP40 expression. The median value of fluorescent intensity was measured for each sample to calculate the fold increase in mean fluorescence intensity for each sample normalized to untreated HEK293 cells. (D) 7-AAD staining was used to determine cell viability under the conditions indicated in panel A and to determine the median value of fluorescent intensity for each sample as described for panel A. This was used to calculate the fold increase in mean fluorescence intensity for each sample normalized to untreated HEK293 cells. (E) Annexin V staining, performed as described for panel A, was used to compare HEK293 cells expressing EGFP-VP40, EGFP, HIV-1 gag, and other fluorescent constructs. Note that the VP40 signals shown in panels C and E are the same to facilitate comparisons. (F) 7-AAD staining, performed as described for panel B, was used to determine the viability of HEK293 cells expressing EGFP-VP40, EGFP, HIV-1 gag, and other fluorescent constructs. Note that the VP40 signals shown in panels D and F are the same to facilitate comparisons. n = 3 for each condition; results were used to determine the SEM. *, P < 0.05; **, P < 0.01; ***, P < 0.001.
FIG 7
FIG 7
Imaging of PS exposure on live cells. (A) Cartoon representation of PS exposure imaging experiment where annexin V-APC was bound to extracellular PS exposed on a virus-like particle induced by an EGFP-viral matrix protein transfected into HEK293 cells. (B) Representative cells treated with ionomycin as directed by the manufacturer and with annexin V-APC stain in 1× annexin V binding buffer for 15 to 20 min. (C) Representative images of HEK293 cells transfected for 18 to 24 h with HIV-1 gag-EGFP, VP40-WT-EGFP, Lact C2-EGFP, PLCδPH-EGFP, and EGFP. Transfected cells were treated with annexin V-APC stain in 1× annexin V binding buffer for 15 to 20 min. All scale bars are 10 μM. (D) Quantification of PS exposure detected by annexin V-APC stain with EGFP constructs. A total of 25 to 40 cells per construct were imaged for each experiment, and four or more independent experiments were performed. Percent intensity and percent area overlap of annexin V-APC and EGFP at the plasma membrane were determined in MATLAB for each cell (see Materials and Methods). The results are displayed ± SEM, and significant (P < 0.05) increases in PS exposure from controls Lact C2, PLCδPH, and EGFP are marked with a star (*).

References

    1. Bale S, Liu T, Li S, Wang Y, Abelson D, Fusco M, Woods VL Jr, Saphire EO. 2011. Ebola virus glycoprotein needs an additional trigger, beyond proteolytic priming for membrane fusion. PLoS Negl Trop Dis 5:e1395. doi:10.1371/journal.pntd.0001395. - DOI - PMC - PubMed
    1. Lee JE, Fusco ML, Hessell AJ, Oswald WB, Burton DR, Saphire EO. 2008. Structure of the Ebola virus glycoprotein bound to an antibody from a human survivor. Nature 454:177–182. doi:10.1038/nature07082. - DOI - PMC - PubMed
    1. Moller-Tank S, Albritton LM, Rennert PD, Maury W. 2014. Characterizing functional domains for TIM-mediated enveloped virus entry. J Virol 88:6702–6713. doi:10.1128/JVI.00300-14. - DOI - PMC - PubMed
    1. Moller-Tank S, Kondratowicz AS, Davey RA, Rennert PD, Maury W. 2013. Role of the phosphatidylserine receptor TIM-1 in enveloped-virus entry. J Virol 87:8327–8341. doi:10.1128/JVI.01025-13. - DOI - PMC - PubMed
    1. Moller-Tank S, Maury W. 2014. Phosphatidylserine receptors: enhancers of enveloped virus entry and infection. Virology 468–470:565–580. - PMC - PubMed

Publication types