. 2015 Jun 17:6:124.
doi: 10.3389/fphar.2015.00124. eCollection 2015.

Different toxic effects of YTX in tumor K-562 and lymphoblastoid cell lines

Affiliations

Different toxic effects of YTX in tumor K-562 and lymphoblastoid cell lines

Andrea Fernández-Araujo et al. Front Pharmacol. .

Abstract

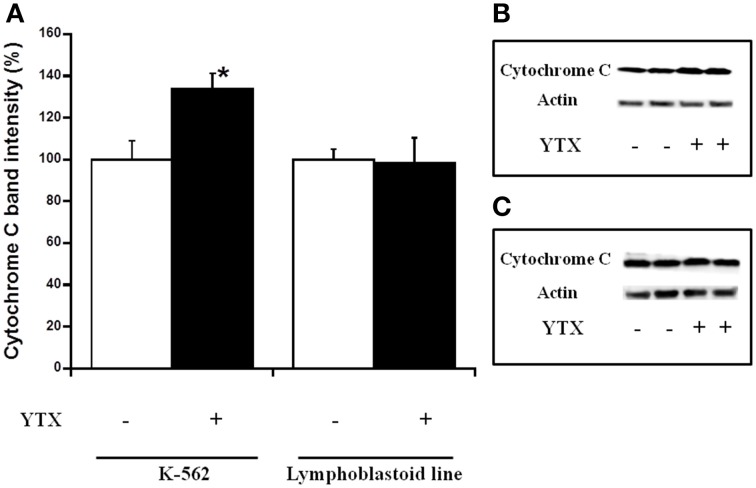
Yessotoxin (YTX) modulates cellular phosphodiesterases (PDEs). In this regard, opposite effects had been described in the tumor model K-562 cell line and fresh human lymphocytes in terms of cell viability, cyclic adenosine 3',5'-cyclic monophosphate (cAMP) production and protein expression after YTX treatment. Studies in depth of the pathways activated by YTX in K-562 cell line, have demonstrated the activation of two different cell death types, apoptosis, and autophagy after 24 and 48 h of treatment, respectively. Furthermore, the key role of type 4A PDE (PDE4A) in both pathways activated by YTX was demonstrated. Therefore, taking into account the differences between cellular lines and fresh cells, a study of cell death pathways activated by YTX in a non-tumor cell line with mitotic activity, was performed. The cellular model used was the lymphoblastoid cell line that represents a non-tumor model with normal apoptotic and mitotic machinery. In this context, cell viability and cell proliferation, expression of proteins involved in cell death activated by YTX and mitochondrial mass, were studied after the incubation with the toxin. Opposite to the tumor model, no cell death activation was observed in lymphoblastoid cell line in the presence of YTX. In this sense, variations in apoptosis hallmarks were not detected in the lymphoblastoid cell line after YTX incubation, whereas this type I of programmed cell death was observed in K-562 cells. On the other hand, autophagy cell death was triggered in this cellular line, while other autophagic process is suggested in lymphoblastoid cells. These YTX effects are related to PDE4A in both cellular lines. In addition, while cell death is triggered in K-562 cells after YTX treatment, in lymphoblastoid cells the toxin stops cellular proliferation. These results point to YTX as a specific toxic compound of tumor cells, since in the non-tumor lymphoblastoid cell line, no cell death hallmarks are observed.

Keywords: K-562; Yessotoxin; apoptosis; autophagy; lymphoblastoid line.


Figures

Figure 1
Figure 1
Effect of YTX on cellular MTT signal and LDH release in K-562 and lymphoblastoid cell lines. Cells were incubated with 30 nM YTX for 24 and 48 h (37°C and 5% CO2 atmosphere). (A) Percentage of cellular proliferation measured by MTT assay in K-562 and lymphoblastoid cell lines after 24 and 48 h of YTX incubation. (B) Percentage of LDH release of K-562 and lymphoblastoid cell lines after 24 and 48 h of YTX incubation. Mean ± SEM of three experiments. *Significant differences between untreated and YTX-treated cells in each case by ANOVA test.
Figure 2
Figure 2
Effect of YTX on total mitochondrial mass of K-562 and lymphoblastoid cell lines. Representative cellular images and histograms of the mitochondrial mass intensities in K-562 and lymphoblastoid cell lines after 48 h (A,B, respectively) of YTX incubation (37°C and 5% CO2 atmosphere). Brightfield images and red channel images with MitoTracker®Deep Reed FM intensity are represented to each cell model on the right of the histograms. (C) Percentage of cells with mitochondrial mass intensities selected of K-562 and lymphoblastoid cell lines after 48 h of YTX treatment. Data referred to untreated cells. Mean ± SEM of three experiments (5000 cells were analyzed in each experiment). *Significant differences between YTX-treated and untreated cells by ANOVA test.
Figure 3
Figure 3
Effect of YTX on cytosolic PDE4A expression in K-562 and lymphoblastoid cell. Cells were incubated for 24 and 48 h with 30 nM YTX (37°C and 5% CO2 atmosphere). (A,D) Percentage of cytosolic PDE4A levels in K-562 and lymphoblastoid cell lines after 24 and 48 h of YTX incubation, respectively. Mean ± SEM of three experiments. Cytosolic PDE4A values were calculated respect to β-actin band intensity. 3 × 10⁶ cells per condition were lysed and 20 μg of total protein per condition was charged in the electrophoresis gel. *Significant differences between untreated and YTX-treated cells by ANOVA test. (B,C) Representative experiments of western blot band intensity of cytosolic PDE4A in K-562 (~80 KDa) and lymphoblastoid (~98 KDa) cell lines after 24 h of treatment, respectively. (E,F) Representative experiments of western blot band intensity of cytosolic PDE4A in K-562 (~80 KDa) and lymphoblastoid (~98 KDa) cell lines after 48 h of treatment, respectively. (G) PDE4A band of K-562 and lymphoblastoid cell lines in western blot membranes. PDE4A antibody targets to a PDE4A protein with a molecular weight of 98 KDa.
Figure 4
Figure 4
Effect of YTX on cytosolic cytochrome c expression in K-562 and lymphoblastoid cell lines after 24 h of incubation. Cells were incubated for 24 h with 30 nM YTX (37°C and 5% CO2 atmosphere). (A) Percentage of cytosolic cytochrome c levels in K-562 and lymphoblastoid cell lines after 24 h of YTX incubation. Mean ± SEM of three experiments. Cytosolic cytochrome c values were calculated respect to β-actin band intensity. 3 × 10⁶ cells per condition were lysed and 20 μg of total protein per condition was charged in the electrophoresis gel. *Significant differences between untreated and YTX-treated cells by ANOVA test. (B,C) Representative experiments of western blot band intensity of cytosolic cytochrome c in K-562 and lymphoblastoid cell lines after 24 h of treatment, respectively.
Figure 5
Figure 5
Effect of YTX on cytosolic caspase 8 expression in K-562 and lymphoblastoid cell lines after 24 h of incubation. Cells were incubated for 24 h with 30 nM YTX (37°C and 5% CO2 atmosphere). (A) Percentage of cytosolic caspase 8 levels in K-562 and lymphoblastoid cell lines after 24 h of YTX incubation. Mean ± SEM of three experiments. Cytosolic caspase 8 values were calculated respect to β-actin band intensity. 3 × 10⁶ cells per condition were lysed and 20 μg of total protein per condition was charged in the electrophoresis gel. *Significant differences between untreated and YTX-treated cells by ANOVA test. (B,C) Representative experiments of western blot band intensity of cytosolic caspase 8 in K-562 and lymphoblastoid cell lines after 24 h of treatment, respectively.
Figure 6
Figure 6
Effect of YTX on cytosolic pmTOR expression in K-562 and lymphoblastoid cell lines after 48 h of incubation. Cells were incubated for 48 h with 30 nM YTX (37°C and 5% CO2 atmosphere). (A) Percentage of cytosolic pmTOR levels in K-562 and lymphoblastoid cell lines after 48 h of YTX incubation. Mean ± SEM of three experiments. Cytosolic pmTOR values were calculated respect to β-actin band intensity. 3 × 10⁶ cells per condition were lysed and 20 μg of total protein per condition was charged in the electrophoresis gel. *Significant differences between untreated and YTX-treated cells by ANOVA test. (B,C) Representative experiments of western blot band intensity of cytosolic pmTOR in K-562 and lymphoblastoid cell lines after 48 h of treatment, respectively.
Figure 7
Figure 7
Effect of YTX on cytosolic LC3B-II/LC3B-I expression in K-562 and lymphoblastoid cell lines after 48 h of incubation. Cells were incubated for 48 h with 30 nM YTX (37°C and 5% CO2 atmosphere). (A) Percentage of cytosolic LC3B-II/LC3B-I levels in K-562 and lymphoblastoid cell lines after 48 h of YTX incubation. Mean ± SEM of three experiments. Cytosolic LC3B-I and LC3B-II values were calculated respect to β-actin band intensity and the ratio between LC3B-II and LC3B-I was calculated in order to quantify the autophagosomal LC3B-II isotype 3 × 10⁶ cells per condition were lysed and 20 μg of total protein per condition was charged in the electrophoresis gel. *Significant differences between untreated and YTX-treated cells by ANOVA test. (B,C) Representative experiments of western blot band intensity of cytosolic LC3B-I and LC3B-II in K-562 and lymphoblastoid cell lines after 48 h of treatment, respectively.
Figure 8
Figure 8
Effect of YTX on cellular proliferation in K-562 and lymphoblastoid cell lines. Cells were incubated with 30 nM YTX for 24 and 48 h (37°C and 5% CO2 atmosphere). Cells were counted with the Scepter™ Handheld automated cell counter and confirmed as final concentration of protein by Direct Detect™ and Bradford assay. (A) Number of K-562 cells after 24 and 48 h of YTX incubation. (B) Number of lymphoblastoid cells after 24 and 48 h of YTX incubation. Mean ± SEM of four experiments. *Significant differences between untreated and YTX-treated cells in each case by ANOVA test.

Similar articles

Cited by

References

    1. Alfonso A., de la Rosa L., Vieytes M. R., Yasumoto T., Botana L. M. (2003). Yessotoxin, a novel phycotoxin, activates phosphodiesterase activity. Effect of yessotoxin on cAMP levels in human lymphocytes. Biochem. Pharmacol. 65, 193–208. 10.1016/S0006-2952(02)01454-5 - DOI - PubMed
    1. Alfonso A., Vieytes M. R., Yasumoto T., Botana L. M. (2004). A rapid microplate fluorescence method to detect yessotoxins based on their capacity to activate phosphodiesterases. Anal. Biochem. 326, 93–99. 10.1016/j.ab.2003.11.022 - DOI - PubMed
    1. Alfonso C., Alfonso A., Vieytes M. R., Yasumoto T., Botana L. M. (2005). Quantification of yessotoxin using the fluorescence polarization technique and study of the adequate extraction procedure. Anal. Biochem. 344, 266–274. 10.1016/j.ab.2005.06.044 - DOI - PubMed
    1. Asirvatham A. L., Galligan S. G., Schillace R. V., Davey M. P., Vasta V., Beavo J. A., et al. . (2004). A-kinase anchoring proteins interact with phosphodiesterases in T lymphocyte cell lines. J. Immunol. 173, 4806–4814. 10.4049/jimmunol.173.8.4806 - DOI - PubMed
    1. Bae-Jump V. L., Zhou C., Boggess J. F., Whang Y. E., Barroilhet L., Gehrig P. A. (2010). Rapamycin inhibits cell proliferation in type I and type II endometrial carcinomas: a search for biomarkers of sensitivity to treatment. Gynecol. Oncol. 119, 579–585. 10.1016/j.ygyno.2010.08.025 - DOI - PMC - PubMed

LinkOut - more resources