. 2015 Jun 17:6:180.
doi: 10.3389/fphys.2015.00180. eCollection 2015.

Cloning, expression analysis, and RNA interference study of a HORMA domain containing autophagy-related gene 13 (ATG13) from the coleopteran beetle, Tenebrio molitor

Affiliations

Cloning, expression analysis, and RNA interference study of a HORMA domain containing autophagy-related gene 13 (ATG13) from the coleopteran beetle, Tenebrio molitor

Jung Hee Lee et al. Front Physiol. .

Abstract

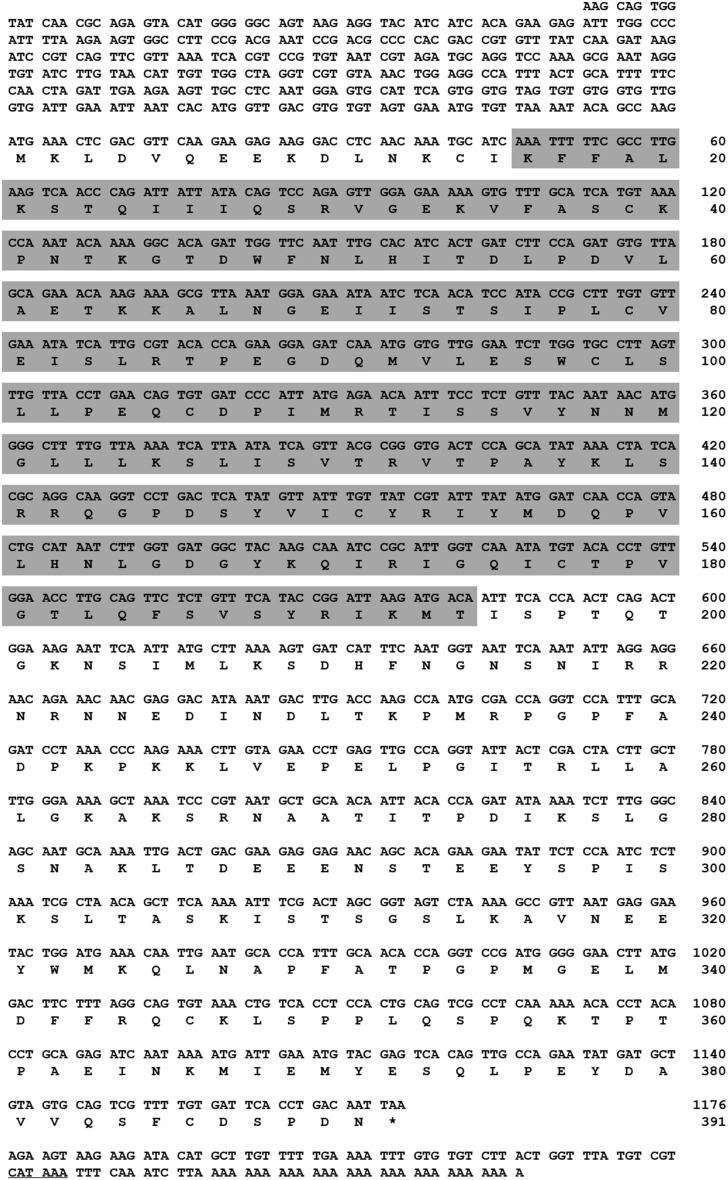
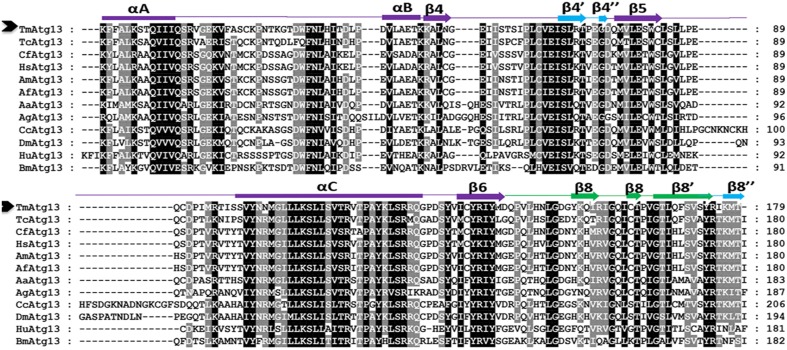
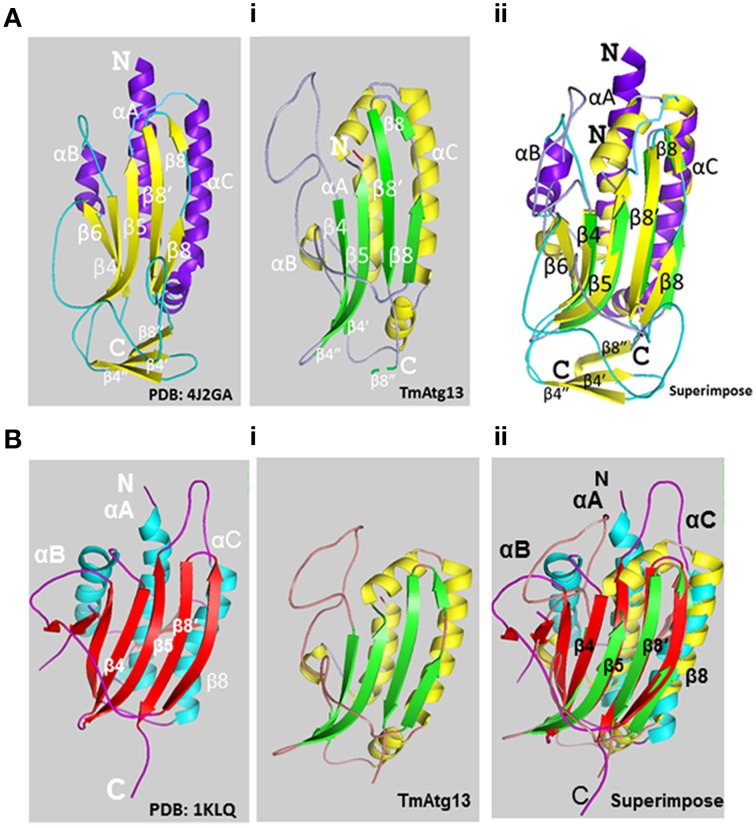
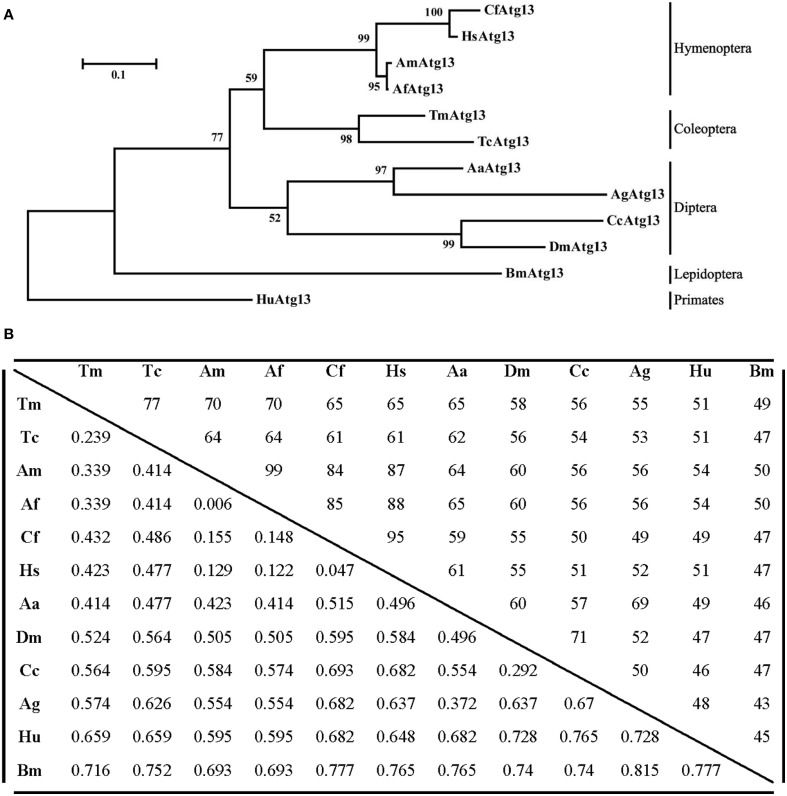
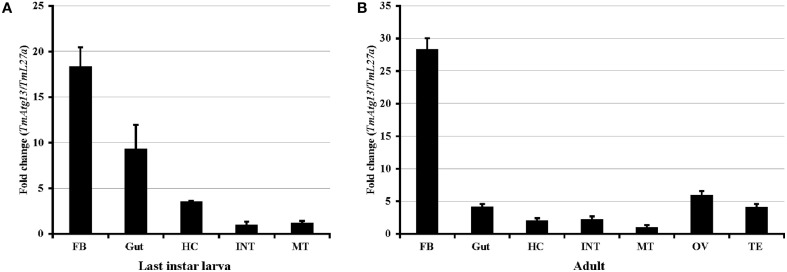
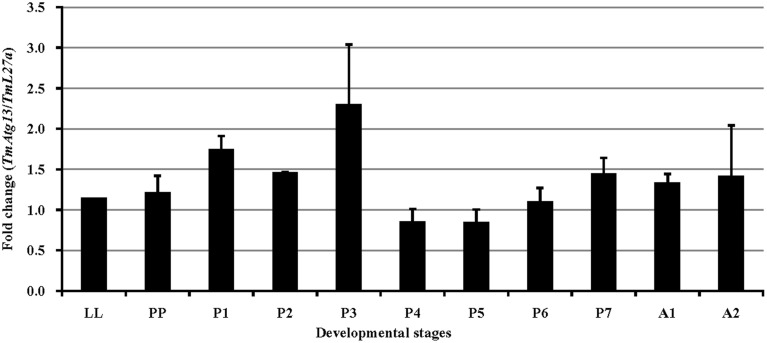
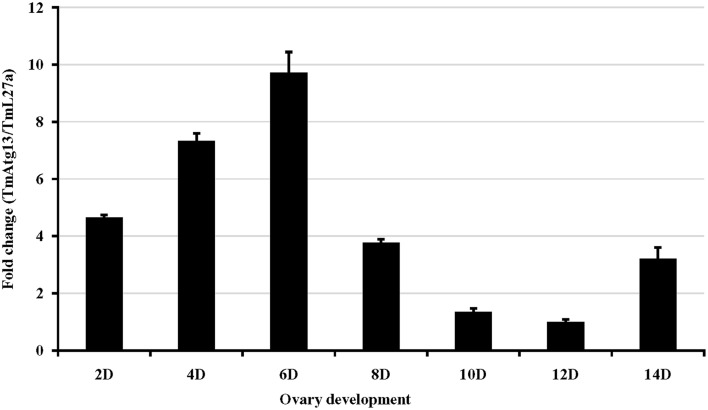
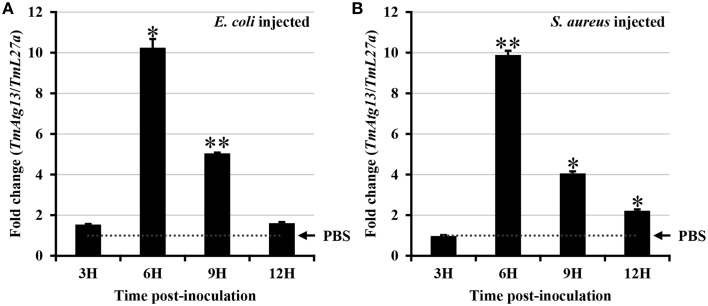
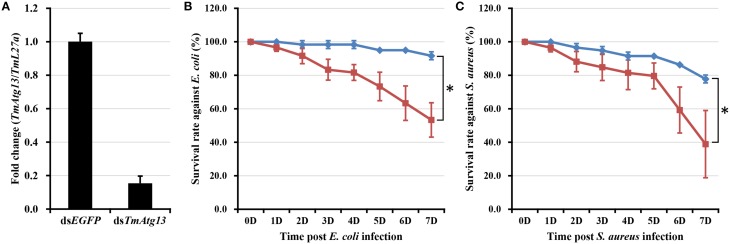
Autophagy is a process that is necessary during starvation, as it replenishes metabolic precursors by eliminating damaged organelles. Autophagy is mediated by more than 35 autophagy-related (Atg) proteins that participate in the nucleation, elongation, and curving of the autophagosome membrane. In a pursuit to address the role of autophagy during development and immune resistance of the mealworm beetle, Tenebrio molitor, we screened ATG gene sequences from the whole-larva transcriptome database. We identified a homolog of ATG13 gene in T. molitor (designated as TmATG13) that comprises a cDNA of 1176 bp open reading frame (ORF) encoding a protein of 391 amino acids. Analyses of the structure-specific features of TmAtg13 showed an intrinsically disordered middle and C-terminal region that was rich in regulatory phosphorylation sites. The N-terminal Atg13 domain had a HORMA (Hop1, Rev7, and Mad2) fold containing amino acid residues conserved across the Atg13 insect orthologs. A quantitative reverse-transcription-polymerase chain reaction analysis revealed that TmATG13 was expressed ubiquitously during all developmental stages of the insect. TmATG13 mRNA expression was high in the fat body and gut of the larval and adult stages of the insect. The TmATG13 transcripts were expressed at a high level until 6 days of ovarian development, followed by a significant decline. Silencing of ATG13 transcripts in T. molitor larvae showed a reduced survivability of 39 and 38% in response to Escherichia coli and Staphylococcus aureus infection. Furthermore, the role of TmAtg13 in initiating autophagy as a part of the host cell autophagic complex of the host cells against the intracellular pathogen Listeria monocytogenes is currently under study and will be critical to unfold the structure-function relationships.

Keywords: ATG13; HORMA domain; RNA interference; Tenebrio molitor; autophagy; expression analysis.


Figures

Figure 1
Figure 1
Nucleotide and deduced amino acid sequence of TmAtg13 cDNA. The full-length ORF sequence was derived from the Tenebrio molitor transcriptome database. The 5′/3′-UTR region was obtained by RACE-PCR methods. Asterisk denotes the stop codon. The polyadenylation domain in the 3′-UTR is underlined. Gray box indicates the N-terminal HORMA domain.
Figure 2
Figure 2
Multiple alignment of the deduced amino acid sequence of the TmAtg13 protein HORMA domain with its orthologs. The secondary structural elements predicted by a homology model (reference template PDB id: 4j2gA) and DaliLite ver. 3.0 are represented on the top of the sequence. Regions structurally similar to MAD2 are colored in purple except the safety belt region, which is highlighted in green. The Atg13 HORMA domain (β4′, β4″, andβ8″), which is unique to TmAtg13, is colored in blue. The amino acid residues that are identical or similar in all sequences are shaded black, gray sequences indicate identical or similar amino acids in most sequences. Dashes indicate gaps to optimize the alignment.
Figure 3
Figure 3
Molecular structure of the TmAtg13 HORMA domain. (Ai) The predicted structural model of TmAtg13 N-terminal HORMA domain is shown in parallel to the reference 3D-model of Lachancea thermotolerans Atg13 (PDB id: 4J2GA). (Aii) Superposed 3D-image of the N-terminal HORMA domain of TmAtg13 over the reference Atg13 model of Lachancea thermotolerans (PDB: 4J2GA). The alpha-helices and beta-sheets for the reference model and TmAtg13 HORMA domain are represented in purple and yellow, and yellow and green, respectively. (Bi) The predicted structural model of TmAtg13 N-terminal HORMA domain is shown in parallel to the 3D-model of Human mitotic assembly check-point protein MAD2 (PDB id: 1KLQ). (Bii) Superposed image of TmAtg13 HORMA domain with the Human MAD2 protein. The alpha-helices and beta-sheets are represented in cyan and red, and red and yellow, respectively for the reference Human MAD2 protein and TmAtg13 N-terminal HORMA domain.
Figure 4
Figure 4
Molecular phylogenetic analysis and percentage identity matrix for the TmAtg13 HORMA domain. (A) An evolutionary tree for the TmAtg13 HORMA domain was constructed by using the maximum likelihood method and was based on the Jones- Thornton- Taylor matrix model. Bootstrap replications of 1000 were assigned and analyzed using the MEGA 6.06 program. The amino acid sequences with the GenBank accession numbers were as follows: TmAtg13; Tenebrio molitor Atg13, TcAtg13; Tribolium castaneum Atg13 (XP_968716.2), CfAtg13; Camponotus floridanus Atg13 (EFN61542.1), AmAtg13; Apis mellifera Atg13 (XP_623782.1), AfAtg13; Apis florea Atg13 (XP_003690771.1), HsAtg13; Harpegnathos saltator Atg13 (EFN82266.1), BmAtg13; Bombyx mori Atg13 (XP_004924339.1), AaAtg13; Aedes aegypti Atg13 (XP_001664333.1), AgAtg13; Anopheles gambiae Atg13 (XP_315727.4), CcAtg13; Ceratitis capitata Atg13 (XP_004523373.1), DmAtg13; Drosophila melanogaster Atg13 (NP_649796.1), and the outgroup HuAtg13; Homo sapiens Atg13 (AAH06191.1). (B) Percentage identity and distance matrix of TmAtg13 with its orthologs as analyzed using the ClustalX2 and MEGA 6.06 programs.
Figure 5
Figure 5
TmAtg13 larval and adult-tissue specific expression profiles. (A) TmAtg13 in the last instar larval tissues. (B) The distribution of the transcript in 2-day old adult tissues. Ribosomal protein L27a (Tenebrio molitor) was used as an endogenous control. Data are presented as mean ± standard error (n = 3). Abbreviations are as follows: FB, fat body; HC, hemocytes; INT, integument; MT, Malphigian tubules; OV, ovary; TE, Testis.
Figure 6
Figure 6
Developmental expression patterns of TmAtg13 in the beetle, T. molitor. Ribosomal protein L27a (T. molitor) was used as an endogenous control. Data are presented as mean ± standard error (n = 3). Abbreviations are as follows: LL, last instar larva; PP, pre-pupa; P1–P7, 1–7 day old pupa, and A1–A2, 1–2 day old adult.
Figure 7
Figure 7
Temporal expression of TmAtg13 during the maturation of adult ovary in the beetle, T. molitor. TmAtg13 mRNA expression levels are expressed as fold changes with respect to the endogenous control (ribosomal protein L27a). Expression of the mRNA transcripts was analyzed on alternate days (day 2, 4, 6, 8, 10, 12, and 14) of ovarian development. Data are presented as mean ± standard error (n = 3).
Figure 8
Figure 8
Induction patterns of TmAtg13 in response to bacterial inoculation. E. coli (A), and S. aureus (B) were injected into T. molitor larvae and total RNAs were isolated at 3, 6, 9, and 12 h post-injection of microorganisms. Primers for ribosomal protein L27a from T. molitor (TmL27a) were used as endogenous control. Results of triplicate experiments have been provided with standard errors. * P < 0.05; ** P < 0.01 (SAS, ANOVA).
Figure 9
Figure 9
RNAi-based silencing of TmAtg13 transcripts and survival assay. (A) RNAi efficiency of TmAtg13 mRNA in dsTmAtg13 injected larvae compared with dsEGFP-treated T. molitor. Survival rate against E. coli (B) and S. aureus (C) measured in TmAtg13 silenced T. molitor larvae compared with dsEGFP-treated T. molitor larvae. Data are presented as mean ± SE. *, significant (P < 0.05; Wilcoxon-Mann-Whitney test) change in the larval survivability was observed in between the dsEGFP and dsTmAtg13 silenced larvae.

Similar articles

Cited by

References

    1. Alers S., Loffler A. S., Paasch F., Dieterle A. M., Keppeler H., Lauber K., et al. . (2011). Atg13 and FIP200 act independently of Ulk1 and Ulk2 in autophagy induction. Autophagy 7, 1423–1433. 10.4161/auto.7.12.18027 - DOI - PMC - PubMed
    1. Aravind L., Koonin E. V. (1998). The HORMA domain: a common structural denominator in mitotic checkpoints, chromosome synapsis and DNA repair. Trends Biochem. Sci. 23, 284–286. 10.1016/S0968-0004(98)01257-2 - DOI - PubMed
    1. Birmingham C. L., Smith A. C., Bakowski M. A., Yoshimori T., Brumell J. H. (2006). Autophagy controls Salmonella infection in response to damage to the Salmonella-containing vacuole. J. Biol. Chem. 281, 11374–11383. 10.1074/jbc.M509157200 - DOI - PubMed
    1. Chan E. Y. W., Longatti A., McKnight N. C., Tooze S. A. (2009). Kinase-inactivated ULK proteins inhibit autophagy via their conserved C-terminal domains using an Atg13-independent mechanism. Mol. Cell. Biol. 29, 157–171. 10.1128/MCB.01082-08 - DOI - PMC - PubMed
    1. Chang Y. Y., Neufeld T. P. (2009). An Atg1/Atg13 complex with multiple roles in TOR-mediated autophagy regulation. Mol. Biol. Cell 20, 2004–2014. 10.1091/mbc.E08-12-1250 - DOI - PMC - PubMed

LinkOut - more resources