

Resveratrol inhibits the hedgehog signaling pathway and epithelial-mesenchymal transition and suppresses gastric cancer invasion and metastasis
- PMID: 26137075
- PMCID: PMC4467343
- DOI: 10.3892/ol.2015.2988
Resveratrol inhibits the hedgehog signaling pathway and epithelial-mesenchymal transition and suppresses gastric cancer invasion and metastasis
Abstract
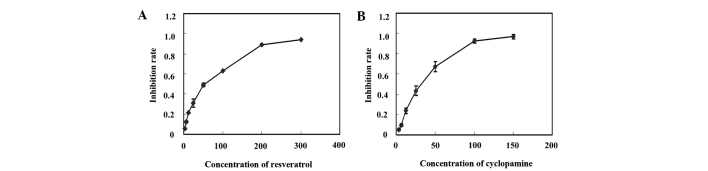
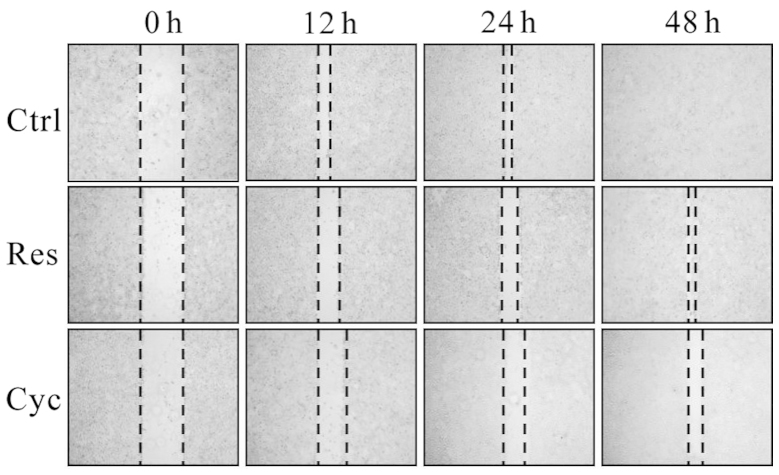
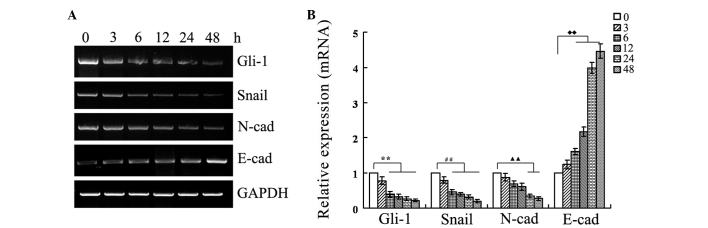
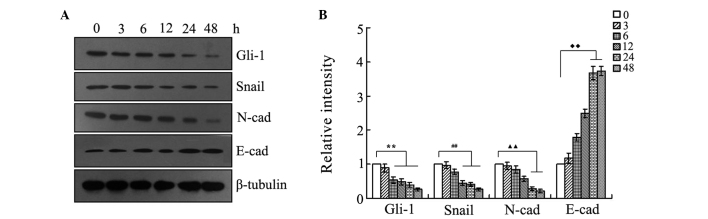
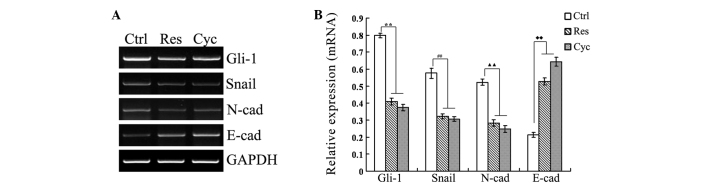
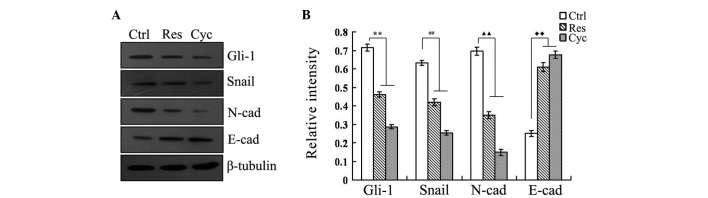
The hedgehog (Hh) signaling pathway is vital to vertebrate development, the homeostatic process and tumorigenesis. Epithelial-mesenchymal transition (EMT) is a cellular process during which epithelial cells become mesenchymal-appearing cells, which in turn promotes cancer metastasis and invasion. Resveratrol is a natural polyphenolic compound found in grapes, a variety of berries, peanuts and other plants. Numerous studies have demonstrated that the Hh signaling pathway is able to regulate the EMT, and that resveratrol can suppress carcinoma invasion and metastasis. In addition, certain studies have indicated that resveratrol can inhibit the Hh signaling pathway and EMT in cancers other than gastric cancer. The purpose of the present study was to investigate the inhibitory effect of resveratrol on the Hh signaling pathway and EMT in gastric cancer in vitro. Gastric cancer SGC-7901 cells were treated with resveratrol or cyclopamine at different concentrations. The viability of the cells was assessed using an MTT assay. The expression of Gli-1, a key component of the Hh signaling pathway, and Snail, E-cadherin and N-cadherin, key components of EMT, was detected by reverse transcription polymerase chain reaction (RT-PCR) and western blotting. The invasion and metastasis of the cells were observed by performing a cell scratch test. The RT-PCR and western blotting showed a decrease in Gli-1, Snail and N-cadherin expression, and an increase in E-cadherin expression in the resveratrol and cyclopamine group compared with the control group, suggesting that resveratrol inhibited the Hh pathway and EMT, as did cyclopamine. The MTT assay indicated that the viability of the SGC-7901 cells was significantly decreased in a concentration-dependent manner following resveratrol and cyclopamine treatment. The cell scratch test showed slower cell invasion and metastasis in the resveratrol and cyclopamine groups. These findings indicated that resveratrol was able to inhibit the Hh signaling pathway and EMT, and suppress invasion and metastasis in gastric cancer in vitro.
Keywords: cyclopamine; gastric cancer epithelial-mesenchymal transition; hedgehog signaling pathway; resveratrol.
Figures
Similar articles
-
Casticin inhibits the epithelial-mesenchymal transition in ovarian carcinoma via the hedgehog signaling pathway.Oncol Lett. 2018 Apr;15(4):4495-4502. doi: 10.3892/ol.2018.7880. Epub 2018 Jan 26. Oncol Lett. 2018. PMID: 29541219 Free PMC article.
-
Resveratrol suppresses epithelial-to-mesenchymal transition in colorectal cancer through TGF-β1/Smads signaling pathway mediated Snail/E-cadherin expression.BMC Cancer. 2015 Mar 5;15:97. doi: 10.1186/s12885-015-1119-y. BMC Cancer. 2015. PMID: 25884904 Free PMC article.
-
Resveratrol inhibits TGF-β1-induced epithelial-to-mesenchymal transition and suppresses lung cancer invasion and metastasis.Toxicology. 2013 Jan 7;303:139-46. doi: 10.1016/j.tox.2012.09.017. Epub 2012 Nov 9. Toxicology. 2013. PMID: 23146760
-
Anti-metastatic potential of resveratrol and its metabolites by the inhibition of epithelial-mesenchymal transition, migration, and invasion of malignant cancer cells.Phytomedicine. 2016 Dec 15;23(14):1787-1796. doi: 10.1016/j.phymed.2016.10.016. Epub 2016 Oct 27. Phytomedicine. 2016. PMID: 27912881 Review.
-
Roles of Dietary Phytoestrogens on the Regulation of Epithelial-Mesenchymal Transition in Diverse Cancer Metastasis.Toxins (Basel). 2016 May 24;8(6):162. doi: 10.3390/toxins8060162. Toxins (Basel). 2016. PMID: 27231938 Free PMC article. Review.
Cited by
-
Natural Plants Compounds as Modulators of Epithelial-to-Mesenchymal Transition.Front Pharmacol. 2019 Jul 30;10:715. doi: 10.3389/fphar.2019.00715. eCollection 2019. Front Pharmacol. 2019. PMID: 31417401 Free PMC article. Review.
-
Effective inhibition of MERS-CoV infection by resveratrol.BMC Infect Dis. 2017 Feb 13;17(1):144. doi: 10.1186/s12879-017-2253-8. BMC Infect Dis. 2017. PMID: 28193191 Free PMC article.
-
Cancer chemoprevention: signaling pathways and strategic approaches.Signal Transduct Target Ther. 2025 Apr 18;10(1):113. doi: 10.1038/s41392-025-02167-1. Signal Transduct Target Ther. 2025. PMID: 40246868 Free PMC article. Review.
-
Exploring resveratrol's inhibitory potential on lung cancer stem cells: a scoping review of mechanistic pathways across cancer models.Med Oncol. 2025 Jul 10;42(8):318. doi: 10.1007/s12032-025-02879-y. Med Oncol. 2025. PMID: 40637827 Free PMC article.
-
Role of extra cellular proteins in gastric cancer progression and metastasis: an update.Genes Environ. 2020 May 15;42:18. doi: 10.1186/s41021-020-00157-z. eCollection 2020. Genes Environ. 2020. PMID: 32467737 Free PMC article. Review.
References
LinkOut - more resources
Full Text Sources
Other Literature Sources
Research Materials