. 2015 Apr 22;6(5):1812-27.
doi: 10.1364/BOE.6.001812. eCollection 2015 May 1.

Localization of cortical tissue optical changes during seizure activity in vivo with optical coherence tomography

Affiliations

Localization of cortical tissue optical changes during seizure activity in vivo with optical coherence tomography

Melissa M Eberle et al. Biomed Opt Express. .

Abstract

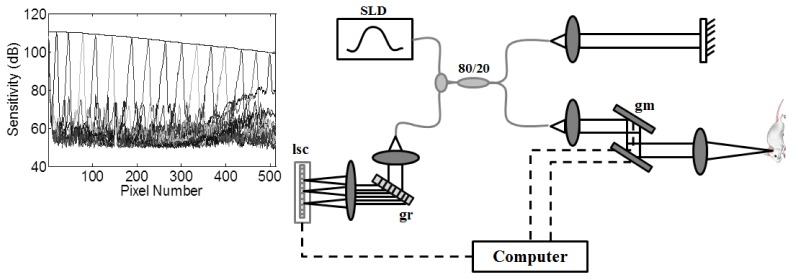
Optical coherence tomography (OCT) is a high resolution, minimally invasive imaging technique, which can produce depth-resolved cross-sectional images. In this study, OCT was used to detect changes in the optical properties of cortical tissue in vivo in mice during the induction of global (pentylenetetrazol) and focal (4-aminopyridine) seizures. Through the use of a confidence interval statistical method on depth-resolved volumes of attenuation coefficient, we demonstrated localization of regions exhibiting both significant positive and negative changes in attenuation coefficient, as well as differentiating between global and focal seizure propagation.

Keywords: (100.2960) Image analysis; (110.4500) Optical coherence tomography; (170.3880) Medical and biological imaging.


Figures

Fig. 1
Fig. 1
Schematic of the SD-OCT system. SLD: superluminescent diode, lsc: line scan camera, gm: galvanometer, gr: grating. Graph inset is the spectrometer roll-off demonstrating an 11 dB loss over the maximum imaging depth.
Fig. 2
Fig. 2
Intensity (left) and the corresponding attenuation coefficient (right) sagittal image of mouse brain tissue. Color bar represents µ in units of mm−1. S: skull, CTX: cerebral cortex and CC: corpus callosum. Bar: 1mm
Fig. 3
Fig. 3
Percent change in average intensity for (A) Global and (B) Focal controls 0.5 x 0.5 x 0.5 mm ROIs. Global ROIs are separated 1 mm laterally outlined on the en face intensity image. Focal ROIs are located at the injection site (ROI 2) and 2 mm from the injection site (ROI 1) outlined on the en face intensity image. Arrows represent time of injection. Red horizontal bars: 2SD of the baseline mean. En face insets of a reference intensity volume. Top of image: Bregma, left of image: Rostral.
Fig. 4
Fig. 4
Volumes of change in intensity for the global seizure model. Volumes are 4 x 2 x 2 mm. Color bar: percent change from baseline (0%) saturating at ± 50%. Time is min post-PTZ injection. Top of image: Bregma, left of image: Rostral. Scale bar: 1 mm. (see Media 1).
Fig. 5
Fig. 5
Volumes of change in intensity for the focal seizure model. Volumes are 3 x 3 x 2 mm. Location of pipette injections is outlined in the first frame. Color bar: percent change from baseline (0%) saturating at ± 50%. Time is min post 4-AP injections. Top of image: Bregma, left of image: Rostral. Scale bar: 1 mm. (see Media 2).
Fig. 6
Fig. 6
Global (A) and focal (B) seizure ROI analysis with the location of ROIs within the imaged volume and the intensity percent change plotted vs. time (A) post-PTZ and (B) post 4-AP injections along with each baseline 2SD as red, dashed, horizontal lines. (A) The first arrow is the time of PTZ injection the second is the anesthesia overdose. (B) Arrow is time of last 4-AP injection. The vertical dashed lines indicate stage-2 (green) and stage-5 (blue) seizures respectively. All ROIs are 0.5 x 0.5 x 0.5 mm.
Fig. 7
Fig. 7
Percent change in average attenuation for (A) Global and (B) Focal controls 0.5 x 0.5 x 0.5 mm ROIs. Global ROIs are separated 1 mm laterally. Focal ROIs are located at the injection site (solid gray) and 2 mm from the injection site (dashed black). Arrows represent time of injection. Red horizontal bars: 2SD of the baseline mean.
Fig. 8
Fig. 8
Histograms of the attenuation value distribution in three layers of the cortical tissue in a global model experiment for baseline (Left) and post seizure onset (Right). The black line is the baseline attenuation values that formed the 0.95 confidence level. Layer (A) top 65 μm, layer (B) following 52 μm, and layer (C) following 130 μm.
Fig. 9
Fig. 9
Histograms of the attenuation value distribution in three layers of the cortical tissue in a focal model experiment for baseline (Left) and post seizure onset (Right). The black line is the baseline attenuation values that formed the 0.90 confidence level. Layer (A) top 65 μm, layer (B) following 52 μm, and layer (C) following 130 μm.
Fig. 10
Fig. 10
fOCT volumes of the global seizure 4 x 2 x 2 mm. Color is scaled from black to color saturation at −80% Δµ for blue and 80% Δµ for red representing decreased and increased Δµ respectively. fOCT volumes are combined with corresponding attenuation coefficient volumes. Time is min post PTZ injection. Top of image: Bregma, left of image: Rostral. Bar: 1 mm. (see Media 3).
Fig. 11
Fig. 11
fOCT volumes of the focal seizure 3 x 3 x 2 mm. Color is scaled from black to color saturation at −50% Δµ for blue and 80% Δµ for red representing decreased and increased Δµ respectively. fOCT volumes are combined with corresponding attenuation volumes. Time is min post 4-AP injections. Left-back of image: Rostral, right-back of image: Bregma. Dashed line in first frame indicates location of injection pipette. Bar: 1 mm. (see Media 4).
Fig. 12
Fig. 12
fOCT volume 30 min. post 4-AP injections showing 0.2 x 0.2 x 0.2 mm ROIs for three regions exhibiting increasing (solid), no change (dotted), and decreasing (dashed) Δµ plotted vs. time through focal seizure progression. Error bars are standard error.
Fig. 13
Fig. 13
fOCT volumes of focal seizure 5 x 4 x 2 mm. Color is scaled from black to color saturation at −30% Δµ for blue and 30% Δµ for red representing decreased and increased Δµ respectively. fOCT volumes are combined with corresponding attenuation volumes. Time is min post 4-AP injections. Dashed line in frame one indicates location of injection pipette. Right back of image: Bregma, front of image: Rostral Bar: 1 mm. (see Media 5).
Fig. 14
Fig. 14
MIP layered fOCT data minutes post 4-AP injections. Layer (A) top 65 μm, layer (B) following 52 μm, and layer (C) following 130 μm. Dashed line in frame one of each layer indicates location of injection pipette. Color spans from white to color saturation at ± 30% Bar: 1mm. (see Media 6).
Fig. 15
Fig. 15
Consecutive ROIs of average Δµ in front of and lateral of the site of 4-AP injections. Six 0.5 x 0.5 mm ROIs (a-f) were averaged for three layers (A-C). The letter next to the ROI in the top frame refers to the plot with the corresponding letter plotted vs. time post 4-AP injections. Layer A (Red line in plots): top 65 μm, layer B (Black line in plots): following 52 μm, and layer C (Blue line in plots): following 130 μm. Dashed line in each layer indicates location of pipette. MIPs are of the fOCT volume 45 min post injections.

References

    1. Hillman E. M. C., “Optical brain imaging in vivo: techniques and applications from animal to man,” J. Biomed. Opt. 12(5), 051402 (2007).10.1117/1.2789693 - DOI - PMC - PubMed
    1. Lenkov D. N., Volnova A. B., Pope A. R. D., Tsytsarev V., “Advantages and limitations of brain imaging methods in the research of absence epilepsy in humans and animal models,” J. Neurosci. Methods 212(2), 195–202 (2013).10.1016/j.jneumeth.2012.10.018 - DOI - PubMed
    1. Boppart S. A., “Optical coherence tomography: technology and applications for neuroimaging,” Psychophysiology 40(4), 529–541 (2003).10.1111/1469-8986.00055 - DOI - PubMed
    1. Aitken P. G., Fayuk D., Somjen G. G., Turner D. A., “Use of intrinsic optical signals to monitor physiological changes in brain tissue slices,” Methods 18(2), 91–103 (1999).10.1006/meth.1999.0762 - DOI - PubMed
    1. Bahar S., Suh M., Zhao M., Schwartz T. H., “Intrinsic optical signal imaging of neocortical seizures: the ‘epileptic dip’,” Neuroreport 17(5), 499–503 (2006).10.1097/01.wnr.0000209010.78599.f5 - DOI - PubMed