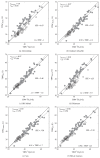
Mean Expected Error in Prediction of Total Body Water: A True Accuracy Comparison between Bioimpedance Spectroscopy and Single Frequency Regression Equations
- PMID: 26137489
- PMCID: PMC4468285
- DOI: 10.1155/2015/656323
Mean Expected Error in Prediction of Total Body Water: A True Accuracy Comparison between Bioimpedance Spectroscopy and Single Frequency Regression Equations
Abstract
For several decades electrical bioimpedance (EBI) has been used to assess body fluid distribution and body composition. Despite the development of several different approaches for assessing total body water (TBW), it remains uncertain whether bioimpedance spectroscopic (BIS) approaches are more accurate than single frequency regression equations. The main objective of this study was to answer this question by calculating the expected accuracy of a single measurement for different EBI methods. The results of this study showed that all methods produced similarly high correlation and concordance coefficients, indicating good accuracy as a method. Even the limits of agreement produced from the Bland-Altman analysis indicated that the performance of single frequency, Sun's prediction equations, at population level was close to the performance of both BIS methods; however, when comparing the Mean Absolute Percentage Error value between the single frequency prediction equations and the BIS methods, a significant difference was obtained, indicating slightly better accuracy for the BIS methods. Despite the higher accuracy of BIS methods over 50 kHz prediction equations at both population and individual level, the magnitude of the improvement was small. Such slight improvement in accuracy of BIS methods is suggested insufficient to warrant their clinical use where the most accurate predictions of TBW are required, for example, when assessing over-fluidic status on dialysis. To reach expected errors below 4-5%, novel and individualized approaches must be developed to improve the accuracy of bioimpedance-based methods for the advent of innovative personalized health monitoring applications.
Figures


References
-
- Thomasset M. A. Bioelectric properties of tissue. Impedance measurement in clinical medicine. Significance of curves obtained. Lyon Médical. 1962;94:107–118. - PubMed
-
- Lukaski H. C., Johnson P. E., Bolonchuk W. W., Lykken G. I. Assessment of fat-free mass using bioelectrical impedance measurements of the human body. American Journal of Clinical Nutrition. 1985;41(4):810–817. - PubMed
-
- Segal K. R., Van Loan M., Fitzgerald P. I., Hodgdon J. A., Van Itallie T. B. Lean body mass estimation by bioelectrical impedance analysis: a four-site cross-validation study. American Journal of Clinical Nutrition. 1988;47(1):7–14. - PubMed
-
- Cornish B. H., Ward L. C., Thomas B. J., Jebb S. A., Elia M. Evaluation of multiple frequency bioelectrical impedance and Cole-Cole analysis for the assessment of body water volumes in healthy humans. European Journal of Clinical Nutrition. 1996;50(3):159–164. - PubMed
Publication types
MeSH terms
LinkOut - more resources
Full Text Sources
Other Literature Sources
Medical
Miscellaneous

