. 2015 Mar 6;2(5):456-66.
doi: 10.1016/j.ebiom.2015.03.003. eCollection 2015 May.

Mitochondrial-dependent Autoimmunity in Membranous Nephropathy of IgG4-related Disease

Affiliations

Mitochondrial-dependent Autoimmunity in Membranous Nephropathy of IgG4-related Disease

Simona Buelli et al. EBioMedicine. .

Abstract

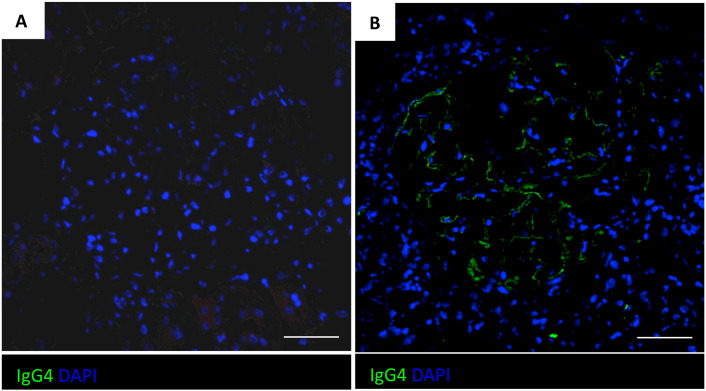
The pathophysiology of glomerular lesions of membranous nephropathy (MN), including seldom-reported IgG4-related disease, is still elusive. Unlike in idiopathic MN where IgG4 prevails, in this patient IgG3 was predominant in glomerular deposits in the absence of circulating anti-phospholipase A2 receptor antibodies, suggesting a distinct pathologic process. Here we documented that IgG4 retrieved from the serum of our propositus reacted against carbonic anhydrase II (CAII) at the podocyte surface. In patient's biopsy, glomerular CAII staining increased and co-localized with subepithelial IgG4 deposits along the capillary walls. Patient's IgG4 caused a drop in cell pH followed by mitochondrial dysfunction, excessive ROS production and cytoskeletal reorganization in cultured podocytes. These events promoted mitochondrial superoxide-dismutase-2 (SOD2) externalization on the plasma membrane, becoming recognizable by complement-binding IgG3 anti-SOD2. Among patients with IgG4-related disease only sera of those with IgG4 anti-CAII antibodies caused low intracellular pH and mitochondrial alterations underlying SOD2 externalization. Circulating IgG4 anti-CAII can cause podocyte injury through processes of intracellular acidification, mitochondrial oxidative stress and neoantigen induction in patients with IgG4 related disease. The onset of MN in a subset of patients could be due to IgG4 antibodies recognizing CAII with consequent exposure of mitochondrial neoantigen in the context of multifactorial pathogenesis of disease.

Keywords: Carbonic anhydrase II; IgG4-related disease; Membranous nephropathy; Podocyte; Superoxide dismutase 2.


Figures

Supplementary Fig. 1
CAII/PDX co-localization area (yellow) at different levels along the biopsy's z-axis in a patient's glomerulus. Scale bar 50 μm.
Supplementary Fig. 2
CAII/lgG4 co-localization area (yellow) at different levels along the biopsy's z-axis in a patient's glomerulus. Scale bar 50 μm.
Supplementary Fig. 3
Representative images of lgG4 (green) deposited in controls' (A) and patient's (B) glomeruli. Nuclei were stained with DAPI. Magnification is specified by bars. Scale bars 50 μm.
Supplementary Fig. 4
Mitochondrial oxidative stress assessed as O2 generation using MitoSOX flow cytometry measuring percentage of fluorescent cells. Results are mean ± SE. °p < 0.05, °°p < 0.01 vs control's lgG4; *p < 0.05 vs medium (n = 3 experiments).
Supplementary Fig. 5
Quantification of SOD2 expression on the surface of cultured human podocytes exposed 15 h to patient's lgG4 (100 μg/ml) in the presence or absence of 1 μM Cyclosporin A (CsA).
Supplementary Fig. 6
Representative images of SOD2 expression (red) on the surface of cultured human podocytes exposed 15 h to control's or patient's serum with (bottom panel) or without (top panel) pre-incubation with purified CAII (pCAII, 100 μg/ml). Clustered SOD2 is indicated with arrows in insets. Nuclei were stained with DAPI (blue). Scale bars 50 μm (n = 3 experiments).
Fig. 1
Fig. 1
Patient's IgG4 recognized CAII on podocytes. (A) Western blotting of the 55 kDa recombinant human GST-tagged CAII (rhCAII, 0.5 μg) or human podocyte extracts (HPE, 20 μg) with patient's (first and second lanes) or control's serum (fourth lane). IgG-subclass specificity was evaluated using an anti-human IgG4-HRP antibody. The HPE membrane was stripped and reprobed with a specific anti-human CAII antibody (third lane). Molecular weights (kDa) shown on the left side. (B) Western blotting of purified CAII (pCAII, 0.5 μg) and the recombinant human GST-tagged SOD2 (rSOD2, 0.6 μg) with patient's serum. IgG-subclass specificity was evaluated using an anti-human IgG1-HRP antibody, anti-human IgG2-HRP antibody, anti-human IgG3-HRP antibody or anti-human IgG4-HRP antibody. (C) CAII expression evaluated using immunofluorescence analysis (left) or Western blotting (right) of podocyte crude plasma membranes (CPM, 20 μg). Scale bars 20 μm. (D) CAII immunogold staining in normal human kidney.
Fig. 2
Fig. 2
Glomerular CAII increased and co-localized with IgG4 deposits in podocytes in patient's biopsy. (A and B) Representative images of CAII immunofluorescence in controls' (A) and patient's (B) glomeruli. (C) Co-localization between CAII (red) and PDX (white) in patient's sample. (D) Co-localization between CAII (red) and IgG4 (green) in patient's sample. (E) Triple immunostaining for CAII, IgG4 and PDX in patient's glomerulus. The details of the co-localization areas highlighted in insets are shown enlarged below, and indicated by arrows. Nuclei were stained with DAPI. Scale bars 50 μm.
Fig. 3
Fig. 3
Cell acidification, mitochondrial alterations and ROS-dependent cytoskeletal dysfunction induced by patient's IgG4. (A) Fluorimetric assay detecting intracellular pH in podocytes exposed to control's or patient's IgG4 (100 μg/ml), control medium (medium) or acetazolamide (ACZT, 500 nM). °°p < 0.01 vs control's IgG4; *p < 0.05, **p < 0.01 vs medium (n = 4 experiments). (B) Representative images of mitochondria labeled with MitoTracker (left panel) or the mitochondrial membrane potential sensor JC-1 (right panel) in podocytes exposed 6 h to control's or patient's IgG4 (100 μg/ml), control medium (medium) or H2O2 (150 μM). JC-1 accumulates in intact mitochondria resulting in a red emission, while it presents diffuse cytosolic green fluorescence in cells with depolarized mitochondria. Nuclei were stained with DAPI (blue). Scale bars 20 μm. (C) Electron micrographs of mitochondria (arrows) in podocyte from control's and our propositus' biopsy, showing reduced density of matrix and loss of cristae. P, podocyte; GBM, glomerular basement membrane; d, subepithelial electron-dense deposit. (D) Mitochondrial oxidative stress assessed as O2 generation using MitoSOX flow cytometry measuring mean fluorescence intensity (MFI). Results are mean ± SE. °p < 0.05, °°p < 0.01 vs control's IgG4; *p < 0.05, **p < 0.01 vs medium (n = 3 experiments). (E) Representative images and quantification of F-actin (red) rearrangement in podocytes exposed 15 h to control's or patient's IgG4 (100 μg/ml), control medium (medium), or H2O2 (150 μM). Nuclei were stained with DAPI (blue). Scale bars 50 μm. In additional experiments, MnTBAP (100 μM) was used. Results (mean ± SE) are expressed as percentage of cells with F-actin rearrangement. °°p < 0.01 vs control's IgG4; *p < 0.05 vs medium; ##p < 0.01 vs patient's IgG4 (n = 4 experiments).
Fig. 4
Fig. 4
Patient's IgG4 leads to SOD2 externalization to podocyte plasma membrane. (A) Representative images of SOD2 expression (red) on the surface of cultured human podocytes exposed 15 h to control's or patient's IgG4 (100 μg/ml), control medium (medium) or H2O2 (150 μM). Clustered SOD2 is indicated with arrowhead. Nuclei were stained with DAPI (blue). Scale bars 50 μm. (B, C) Histograms show quantification of surface staining (B) and mean average size (C) of SOD2 clusters on podocyte plasma membrane expressed as mean ± SE. °p < 0.01 vs control's serum; *p < 0.01 vs medium (n = 8 experiments). (D) Representative images of SOD2 expression (red) on the surface of cultured human podocytes exposed for 15 h to control medium (medium), commercially available anti-CAII antibody (5 μg/ml), or normal IgG (5 μg/ml). Nuclei were stained with DAPI (blue). Scale bars 50 μm. (n = 3 experiments).
Fig. 5
Fig. 5
Patient's IgG3, by binding externalized SOD2, favored complement activation. (A, upper panel) Co-localization (yellow) of SOD2 (red) and IgG3 (green) on non-permeabilized podocytes exposed to total IgG fraction (1 mg/ml) immunopurified from control's or patient's serum. Nuclei were stained with DAPI (blue). Scale bars 50 μm. (A, lower panel) Representative electron micrographs of immunogold labeling of SOD2 in podocytes exposed to control's or patient's total IgG fraction. Gold particles localized on the plasma membrane in patient's IgG-treated cells (arrowheads). (B) Co-localization (yellow) of SOD2 (red) and complement C3 (green) on non-permeabilized podocytes exposed to control's or patient's serum. Nuclei were stained with DAPI (blue). Scale bars 50 μm. (C) Immunofluorescence analysis of SOD2 (red) renal expression in control's and in our IgG4-related disease patient's biopsy. Nuclei were stained with DAPI (blue). Scale bars 50 μm.
Fig. 6
Fig. 6
Effect of IgG4 anti-CAII in sera of untreated IgG4-related disease patients. (A) Western blotting of purified CAII (pCAII, 0.6 μg). IgG-subclass specificity against CAII was evaluated using an anti-human IgG4-HRP antibody. (B) Intracellular pH detected using fluorimetric assay in podocytes exposed 6 h to IgG4 anti-CAII positive sera (CAII + sera), IgG4 anti-CAII negative serum (CAII − sera), control's serum (control's serum) or control medium (medium). °°p < 0.01 vs control's IgG4; *p < 0.05, **p < 0.01 vs medium (n = 4 experiments). (C) Histograms show the quantification of surface staining (left) and the mean average size of the SOD2 clusters (right) expressed as mean ± SE. °p < 0.01 vs control's serum; *p < 0.01 vs medium (n = 8 experiments). (D) Western blotting of recombinant SOD2 (rSOD2, 0.6 μg). IgG-subclass specificity against SOD2 was evaluated using an anti-human IgG3-HRP antibody. (E) Schematic representation of the proposed mechanism by which IgG4 promotes podocyte dysfunction, SOD2 externalization on the plasma membrane and C3-fixing IgG3 deposition. CAII, carbonic-anhydrase-II; C3, complement component 3; GBM, glomerular basement membrane; kAE1, kidney anion exchanger 1; ROS, reactive oxygen species.

Comment in

References

    1. Stone J.H., Zen Y., Deshpande V. IgG4-related disease. N. Engl. J. Med. 2012;366:539–551. - PubMed
    1. Saeki T., Nishi S., Imai N. Clinicopathological characteristics of patients with IgG4-related tubulointerstitial nephritis. Kidney Int. 2010;78:1016–1023. - PubMed
    1. Alexander M.P., Larsen C.P., Gibson I.W. Membranous glomerulonephritis is a manifestation of IgG4-related disease. Kidney Int. 2013;83:455–462. - PubMed
    1. Cravedi P., Abbate M., Gagliardini E. Membranous nephropathy associated with IgG4-related disease. Am. J. Kidney Dis. 2011;58:272–275. - PubMed
    1. Prunotto M., Carnevali M.L., Candiano G. Autoimmunity in membranous nephropathy targets aldose reductase and SOD2. J. Am. Soc. Nephrol. 2010;21:507–519. - PMC - PubMed

Publication types

MeSH terms