

Patient-Level Discordance in Population Percentiles of the Total Cholesterol to High-Density Lipoprotein Cholesterol Ratio in Comparison With Low-Density Lipoprotein Cholesterol and Non-High-Density Lipoprotein Cholesterol: The Very Large Database of Lipids Study (VLDL-2B)
- PMID: 26137953
- PMCID: PMC4550508
- DOI: 10.1161/CIRCULATIONAHA.115.016163
Patient-Level Discordance in Population Percentiles of the Total Cholesterol to High-Density Lipoprotein Cholesterol Ratio in Comparison With Low-Density Lipoprotein Cholesterol and Non-High-Density Lipoprotein Cholesterol: The Very Large Database of Lipids Study (VLDL-2B)
Abstract
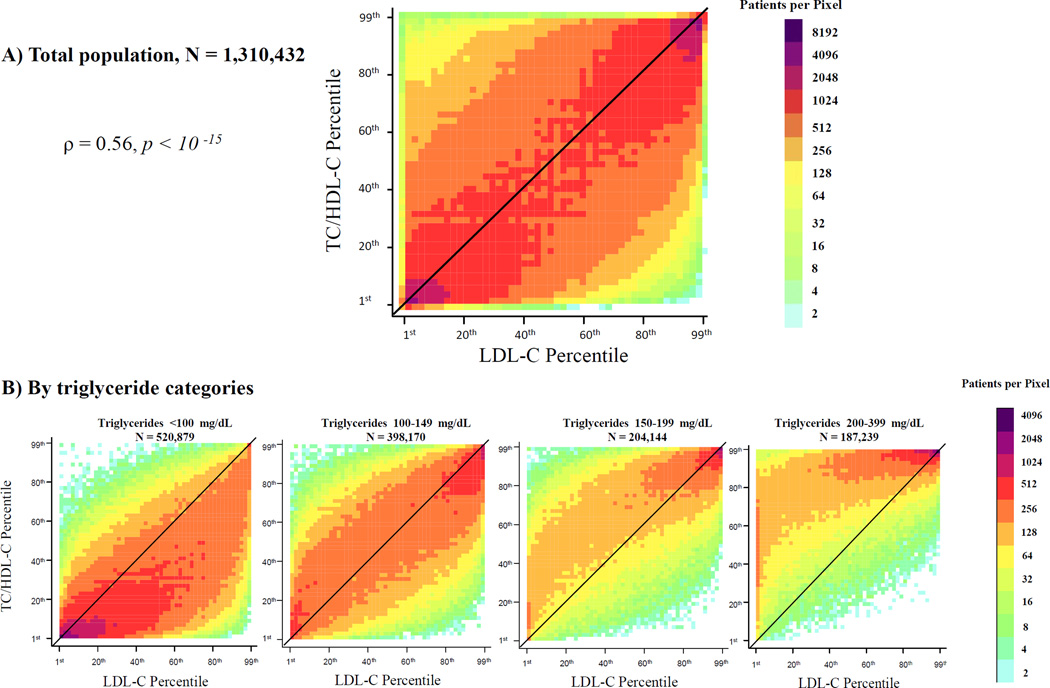
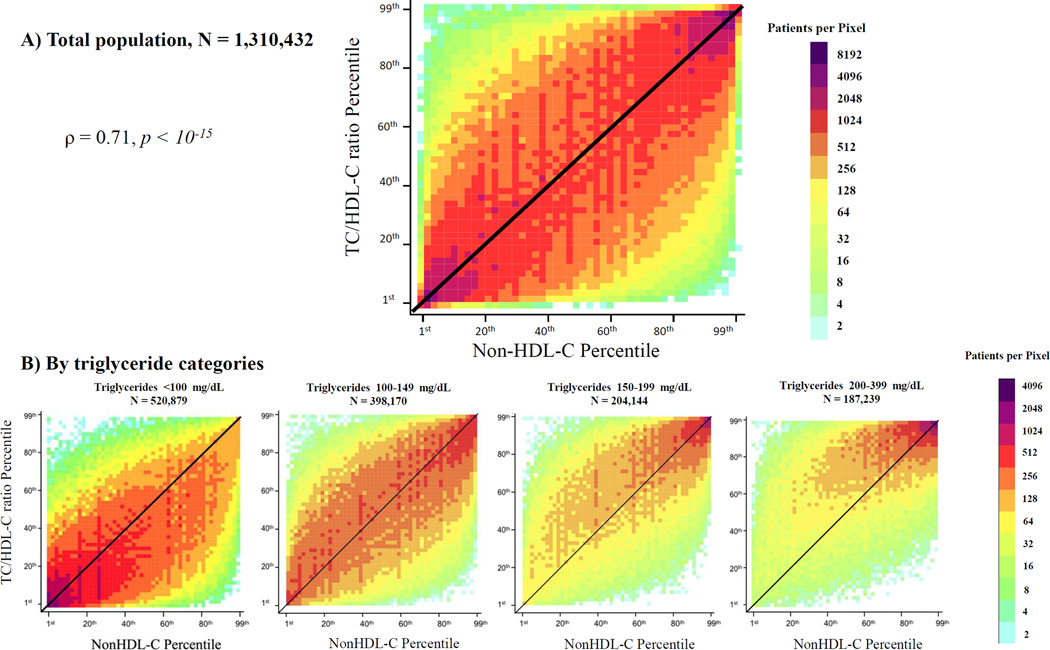
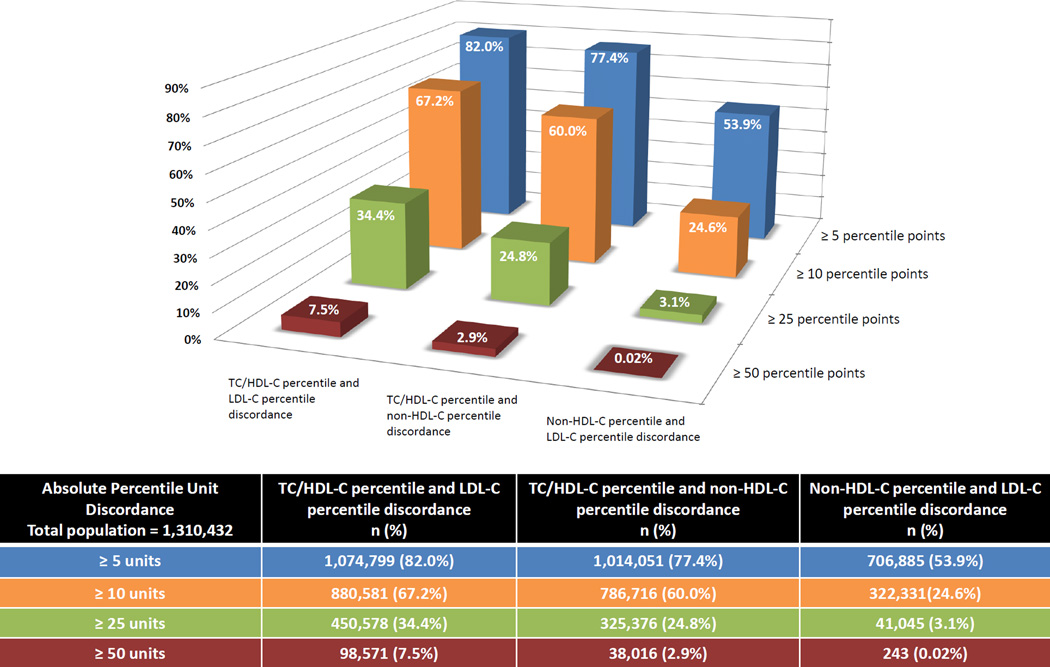
Background: The total cholesterol to high-density lipoprotein cholesterol (TC/HDL-C) ratio, estimated low-density lipoprotein cholesterol (LDL-C), and non-HDL-C are routinely available from the standard lipid profile. We aimed to assess the extent of patient-level discordance of TC/HDL-C with LDL-C and non-HDL-C, because discordance suggests the possibility of additional information.
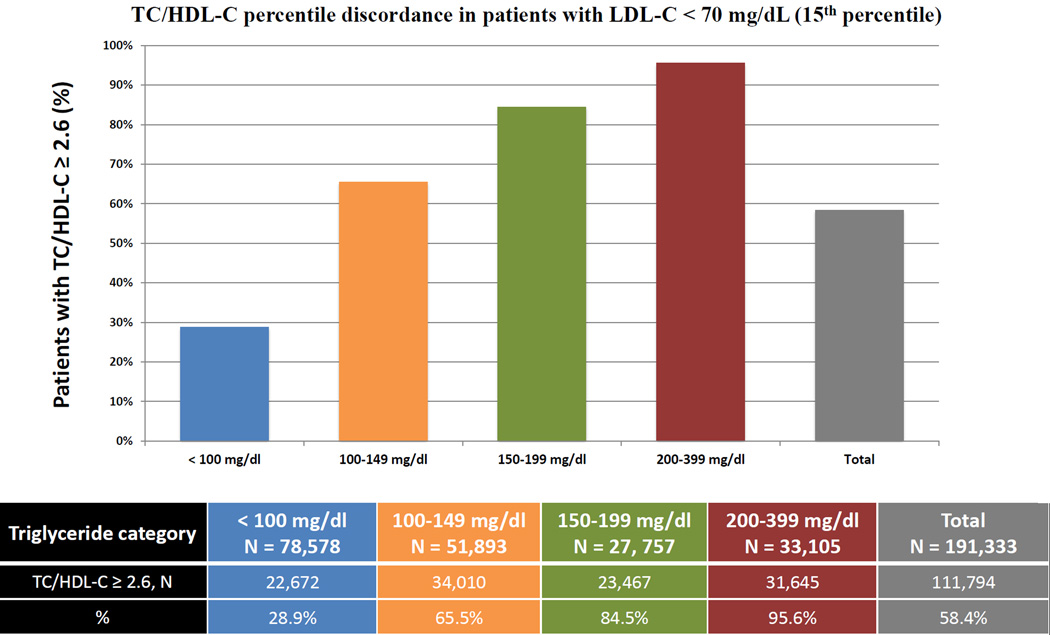
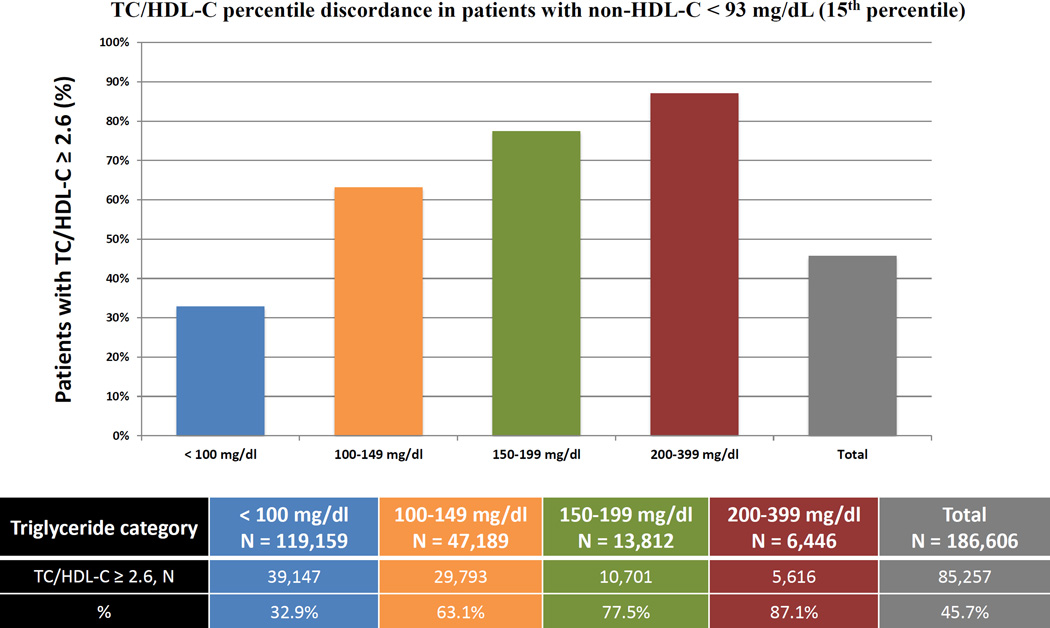
Methods and results: We compared population percentiles of TC/HDL-C, Friedewald-estimated LDL-C, and non-HDL-C in 1 310 432 US adults from the Very Large Database of Lipids. Lipid testing was performed by ultracentrifugation (Vertical Auto Profile, Atherotech, AL). One in 3 patients had ≥25 percentile units discordance between TC/HDL-C and LDL-C, whereas 1 in 4 had ≥25 percentile units discordance between TC/HDL-C and non-HDL-C. The proportion of patients with TC/HDL-C > LDL-C by ≥25 percentile units increased from 3% at triglycerides <100 mg/dL to 51% at triglycerides 200 to 399 mg/dL. On a smaller scale, TC/HDL-C > non-HDL-C discordance by ≥25 percentile units increased from 6% to 21%. In those with <15th percentile levels of LDL-C (<70 mg/dL) or non-HDL-C (<93 mg/dL), a respective 58% and 46% were above the percentile-equivalent TC/HDL-C of 2.6. Age, sex, and directly measured components of the standard lipid profile explained >86% of the variance in percentile discordance between TC/HDL-C versus LDL-C and non-HDL-C.
Conclusions: In this contemporary, cross-sectional, big data analysis of US adults who underwent advanced lipid testing, the extent of patient-level discordance suggests that TC/HDL-C may offer potential additional information to LDL-C and non-HDL-C. Future studies are required to determine the clinical implications of this observation.
Clinical trial registration: URL: http://www.clinicaltrials.gov. Unique identifier: NCT01698489.
Keywords: cholesterol; lipids; lipoproteins; primary prevention.
© 2015 American Heart Association, Inc.
Figures
References
-
- National Ambulatory Medical Care Survey. 2009 Summary Tables. [Accessed February 2, 2015]; http://www.cdc.gov/nchs/data/ahcd/namcs_summary/2009_namcs_web_tables.pdf. Published in December 2009.
-
- Lloyd-Jones DM, Hong Y, Labarthe D, Mozaffarian D, Appel LJ, Van Horn L, Greenlund K, Daniels S, Nichol G, Tomaselli GF, Arnett DK, Fonarow GC, Ho PM, Lauer MS, Masoudi FA, Robertson RM, Roger V, Schwamm LH, Sorlie P, Yancy CW, Rosamond WD American Heart Association Strategic Planning Task Force and Statistics Committee. Defining and setting national goals for cardiovascular health promotion and disease reduction: the American Heart Association's strategic Impact Goal through 2020 and beyond. Circulation. 2010;12:586–613. - PubMed
-
- Stone NJ, Robinson JG, Lichtenstein AH, Bairey Merz CN, Blum CB, Eckel RH, Goldberg AC, Gordon D, Levy D, Lloyd-Jones DM, McBride P, Schwartz JS, Shero ST, Smith SC, Watson K, Wilson PWF, Eddleman KM, Jarrett NM, LaBresh K, Nevo L, Wnek J, Anderson JL, Halperin JL, Albert NM, Bozkurt B, Brindis RG, Curtis LH, DeMets D, Hochman JS, Kovacs RJ, Ohman EM, Pressler SJ, Sellke FW, Shen W-K, Smith SC, Tomaselli GF American College of Cardiology/American Heart Association Task Force on Practice Guidelines. 2013 ACC/AHA guideline on the treatment of blood cholesterol to reduce atherosclerotic cardiovascular risk in adults: a report of the American College of Cardiology/American Heart Association Task Force on Practice Guidelines. Circulation. 2014;129:S1–S45. - PubMed
-
- Reiner Z, Catapano AL, De Backer G, Graham I, Taskinen MR, Wiklund O, Agewall S, Alegria E, Chapman MJ, Durrington P, Erdine S, Halcox J, Hobbs R, Kjekshus J, Filardi PP, Riccardi G, Storey RF, Wood D, ESC Committee for Practice Guidelines (CPG) 2008–2010 and 2010–2012 Committees. Bax J, Vahanian A, Auricchio A, Baumgartner H, Ceconi C, Dean V, Deaton C, Fagard R, Filippatos G, Funck-Brentano C, Hasdai D, Hobbs R, Hoes A, Kearney P, Knuuti J, Kolh P, McDonagh T, Moulin C, Poldermans D, Popescu BA, Reiner Z, Sechtem U, Sirnes PA, Tendera M, Torbicki A, Vardas P, Widimsky P, Windecker S, Reviewers D, Funck-Brentano C, Poldermans D, Berkenboom G, de Graaf J, Descamps O, Gotcheva N, Griffith K, Guida GF, Gulec S, Henkin Y, Huber K, Kesaniemi YA, Lekakis J, Manolis AJ, Marques-Vidal P, Masana L, McMurray J, Mendes M, Pagava Z, Pedersen T, Prescott E, Rato Q, Rosano G, Sans S, Stalenhoef A, Tokgozoglu L, Viigimaa M, Wittekoek ME, Zamorano JL. ESC/EAS Guidelines for the management of dyslipidaemias: The Task Force for the management of dyslipidaemias of the European Society of Cardiology (ESC) and the European Atherosclerosis Society (EAS) Eur Heart J. 2011;32:1769–1818. - PubMed
-
- Anderson TJ, Grégoire J, Hegele RA, Couture P, Mancini GBJ, McPherson R, Francis GA, Poirier P, Lau DC, Grover S, Genest J, Jr, Carpentier AC, Dufour R, Gupta M, Ward R, Leiter LA, Lonn E, Ng DS, Pearson GJ, Yates GM, Stone JA, Ur E. 2012 Update of the Canadian Cardiovascular Society Guidelines for the Diagnosis and Treatment of Dyslipidemia for the Prevention of Cardiovascular Disease in the Adult. Can J Cardiol. 2013;29:151–167. - PubMed
Publication types
MeSH terms
Substances
Associated data
Grants and funding
LinkOut - more resources
Full Text Sources
Medical
