Longitudinal assessment of neuroimaging and clinical markers in autosomal dominant Alzheimer's disease: a prospective cohort study
- PMID: 26139022
- PMCID: PMC4519011
- DOI: 10.1016/S1474-4422(15)00135-0
Longitudinal assessment of neuroimaging and clinical markers in autosomal dominant Alzheimer's disease: a prospective cohort study
Abstract
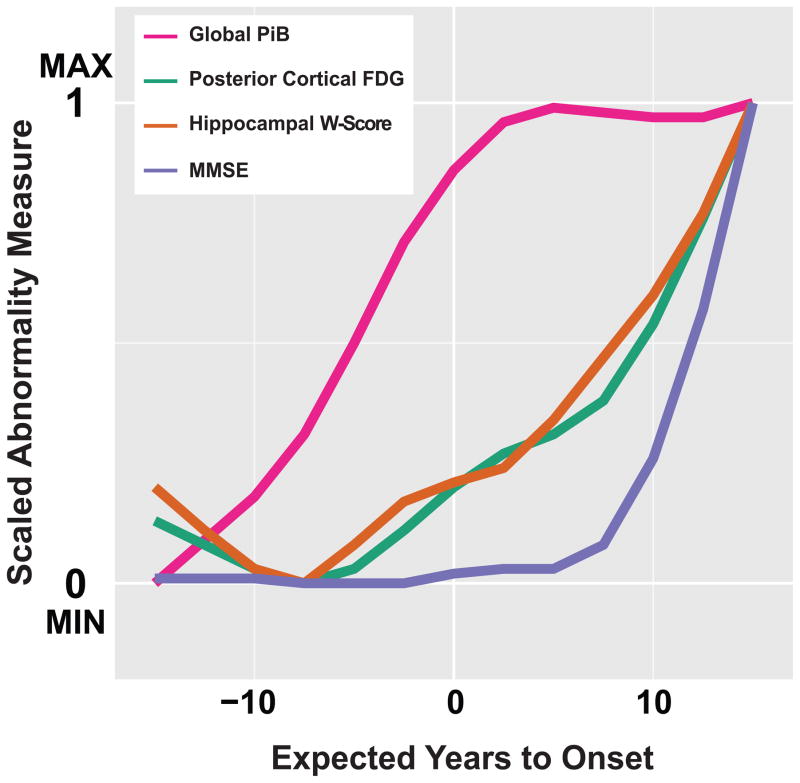
Background: The biomarker model of Alzheimer's disease postulates a dynamic sequence of amyloidosis, neurodegeneration, and cognitive decline as an individual progresses from preclinical Alzheimer's disease to dementia. Despite supportive evidence from cross-sectional studies, verification with long-term within-individual data is needed.
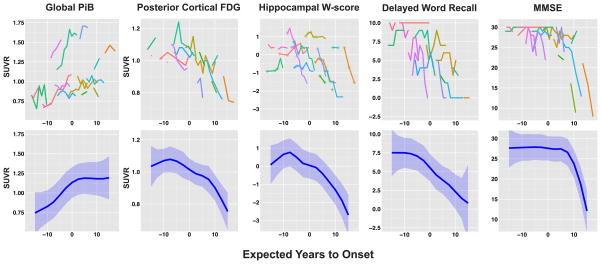
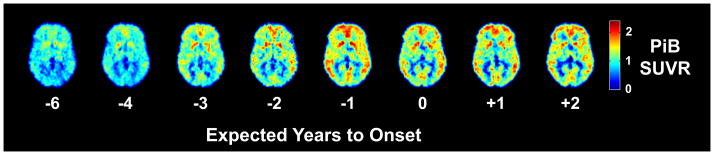
Methods: For this prospective cohort study, carriers of autosomal dominant Alzheimer's disease mutations (aged ≥21 years) were recruited from across the USA through referrals by physicians or from affected families. People with mutations in PSEN1, PSEN2, or APP were assessed at the University of Pittsburgh Alzheimer's Disease Research Center every 1-2 years, between March 23, 2003, and Aug 1, 2014. We measured global cerebral amyloid β (Aβ) load using (11)C-Pittsburgh Compound-B PET, posterior cortical metabolism with (18)F-fluorodeoxyglucose PET, hippocampal volume (age and sex corrected) with T1-weighted MRI, verbal memory with the ten-item Consortium to Establish a Registry for Alzheimer's Disease Word List Learning Delayed Recall Test, and general cognition with the Mini Mental State Examination. We estimated overall biomarker trajectories across estimated years from symptom onset using linear mixed models, and compared these estimates with cross-sectional data from cognitively normal control individuals (age 65-89 years) who were negative for amyloidosis, hypometabolism, and hippocampal atrophy. In the mutation carriers who had the longest follow-up, we examined the within-individual progression of amyloidosis, metabolism, hippocampal volume, and cognition to identify progressive within-individual changes (a significant change was defined as an increase or decrease of more than two Z scores standardised to controls).
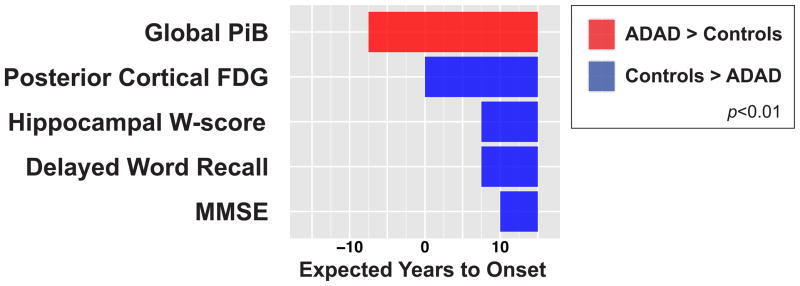
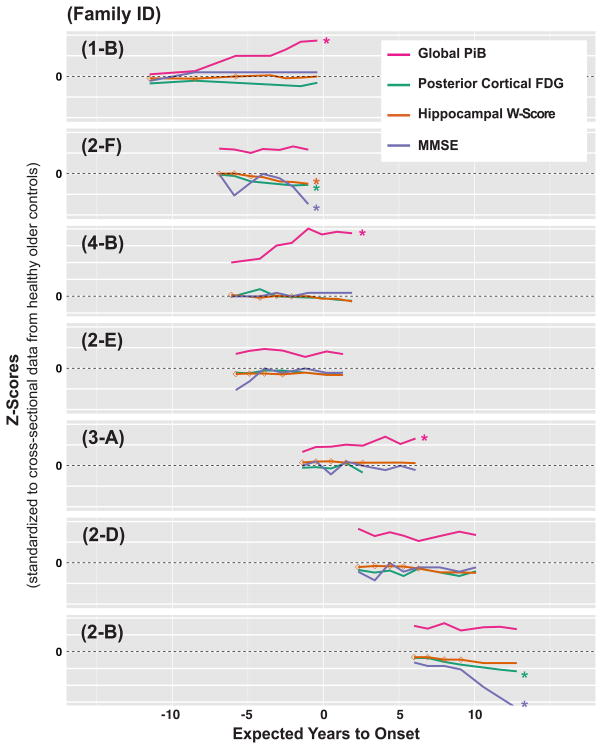
Findings: 16 people with mutations in PSEN1, PSEN2, or APP, aged 28-56 years, completed between two and eight assessments (a total of 83 assessments) over 2-11 years. Significant differences in mutation carriers compared with controls (p<0·01) were detected in the following order: increased amyloidosis (7·5 years before expected onset), decreased metabolism (at time of expected onset), decreased hippocampal volume and verbal memory (7·5 years after expected onset), and decreased general cognition (10 years after expected onset). Among the seven participants with longest follow-up (seven or eight assessments spanning 6-11 years), three individuals had active amyloidosis without progressive neurodegeneration or cognitive decline, two amyloid-positive individuals showed progressive neurodegeneration and cognitive decline without further progressive amyloidosis, and two amyloid-positive individuals showed neither active amyloidosis nor progressive neurodegeneration or cognitive decline.
Interpretation: Our results support amyloidosis as the earliest component of the biomarker model in autosomal dominant Alzheimer's disease. Our within-individual examination suggests three sequential phases in the development of autosomal dominant Alzheimer's disease-active amyloidosis, a stable amyloid-positive period, and progressive neurodegeneration and cognitive decline-indicating that Aβ accumulation is largely complete before progressive neurodegeneration and cognitive decline occur. These findings offer supportive evidence for efforts to target early Aβ deposition for secondary prevention in individuals with autosomal dominant Alzheimer's disease.
Funding: National Institutes of Health and Howard Hughes Medical Institute.
Copyright © 2015 Elsevier Ltd. All rights reserved.
Conflict of interest statement
GE Healthcare holds a license agreement with the University of Pittsburgh based on the technology described in this manuscript. WEK and CAM are co-inventors of Pittsburgh Compound-B and, as such, have a financial interest in this license agreement. GE Healthcare provided no grant support for this study and had no role in the design or interpretation of results or preparation of this manuscript. EMM receives personal compensation for work on the Dominantly Inherited Alzheimer Network Trial Unit (DIAN-TU) therapeutics trial committee. OLL served as a consultant to Lundbeck and Grifols. All other authors have no conflicts of interest with this work. Once all clinical evaluations and image analyses were complete (each blinded to the other) and the data frozen, all authors had full access to all of the data in the study and take responsibility for the integrity of the data and the accuracy of the data analysis (with the exception of specific genetic testing results accessible only to WEK due to confidentiality reasons).
Figures
Comment in
-
Biomarkers for Alzheimer's disease: a controversial topic.Lancet Neurol. 2015 Aug;14(8):781-783. doi: 10.1016/S1474-4422(15)00150-7. Epub 2015 Jun 29. Lancet Neurol. 2015. PMID: 26139024 No abstract available.
References
-
- Alzheimer’s Association. 2014 Alzheimer’s disease facts and figures. Alzheimers Dement. 2014;10:e47–92. - PubMed
-
- Villemagne VL, Burnham S, Bourgeat P, et al. Amyloid β deposition, neurodegeneration, and cognitive decline in sporadic Alzheimer’s disease: a prospective cohort study. Lancet Neurol. 2013;12:357–67. - PubMed
Publication types
MeSH terms
Substances
Grants and funding
- P50AG005133/AG/NIA NIH HHS/United States
- UL1 TR000005/TR/NCATS NIH HHS/United States
- U01 AG032438/AG/NIA NIH HHS/United States
- R37 AG025516/AG/NIA NIH HHS/United States
- R01HL089850/HL/NHLBI NIH HHS/United States
- P50 AG005133/AG/NIA NIH HHS/United States
- HHMI/Howard Hughes Medical Institute/United States
- RF1 AG025516/AG/NIA NIH HHS/United States
- R01 AG025516/AG/NIA NIH HHS/United States
- U19 AG032438/AG/NIA NIH HHS/United States
- R01 HL089850/HL/NHLBI NIH HHS/United States
- P01 AG025204/AG/NIA NIH HHS/United States
LinkOut - more resources
Full Text Sources
Medical