. 2015 Jul 3:6:7585.
doi: 10.1038/ncomms8585.

Obesity-induced DNA hypermethylation of the adiponectin gene mediates insulin resistance

Affiliations

Obesity-induced DNA hypermethylation of the adiponectin gene mediates insulin resistance

A Young Kim et al. Nat Commun. .

Abstract

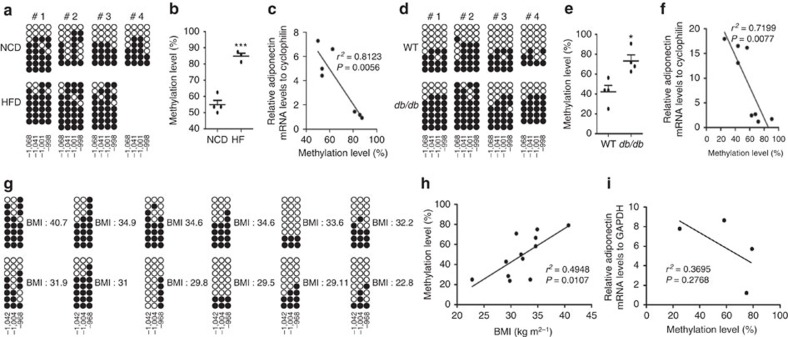
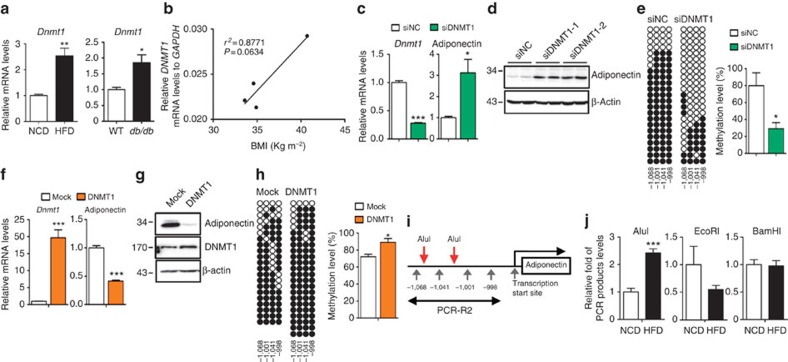
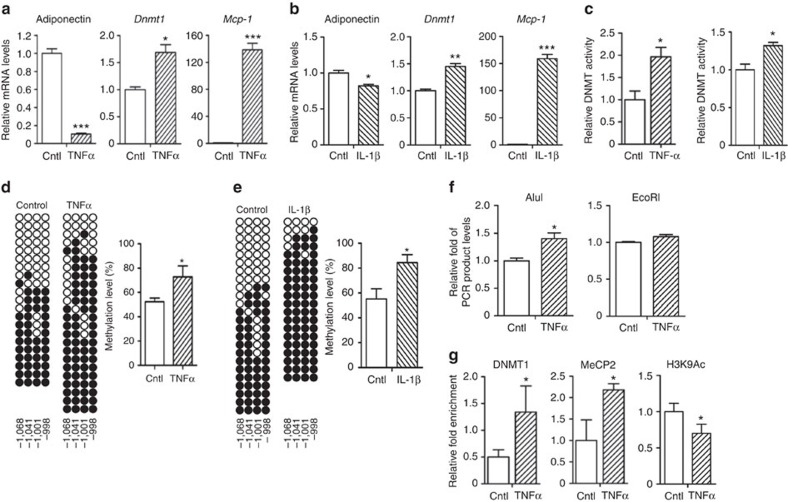
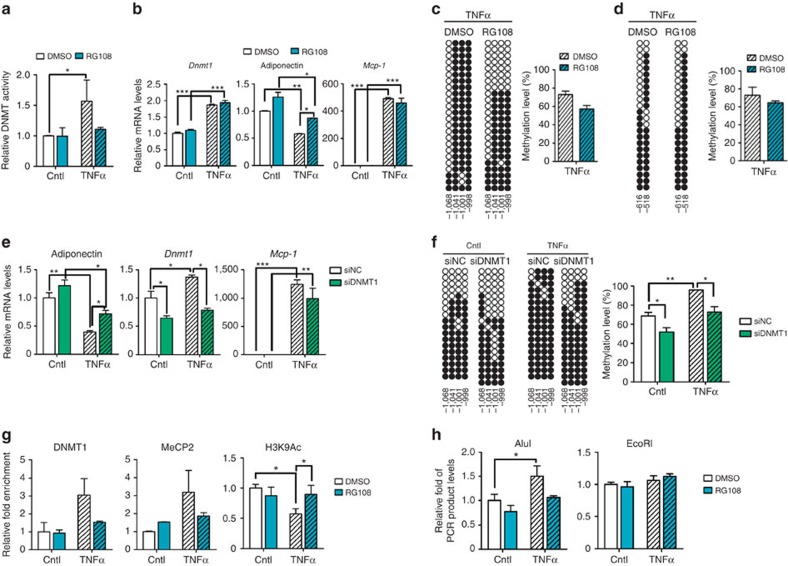
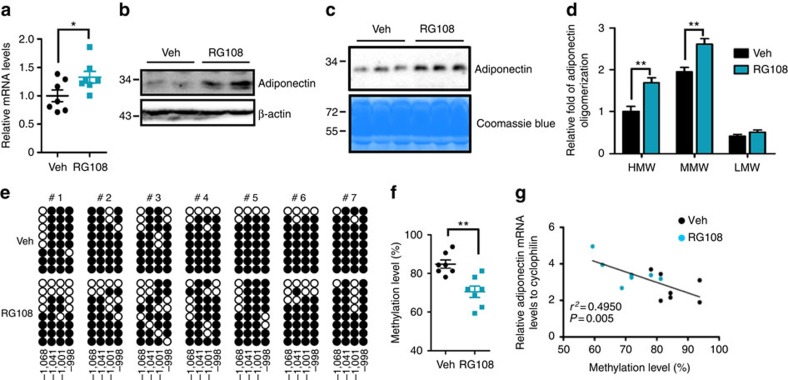
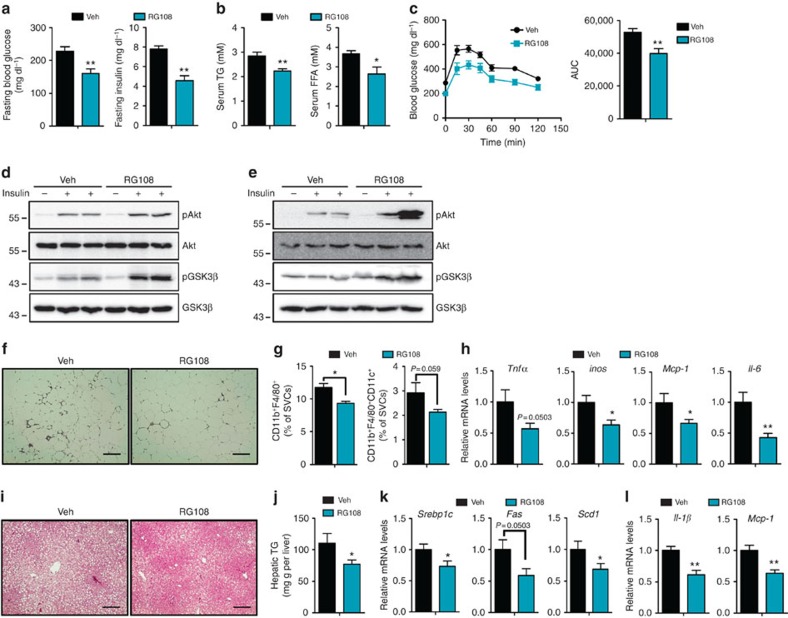
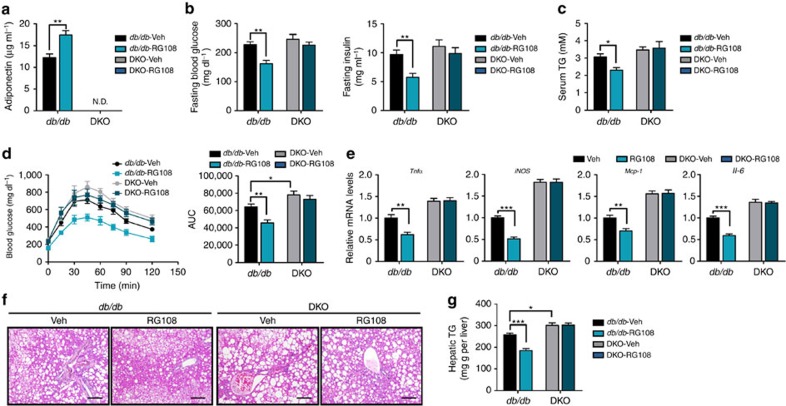
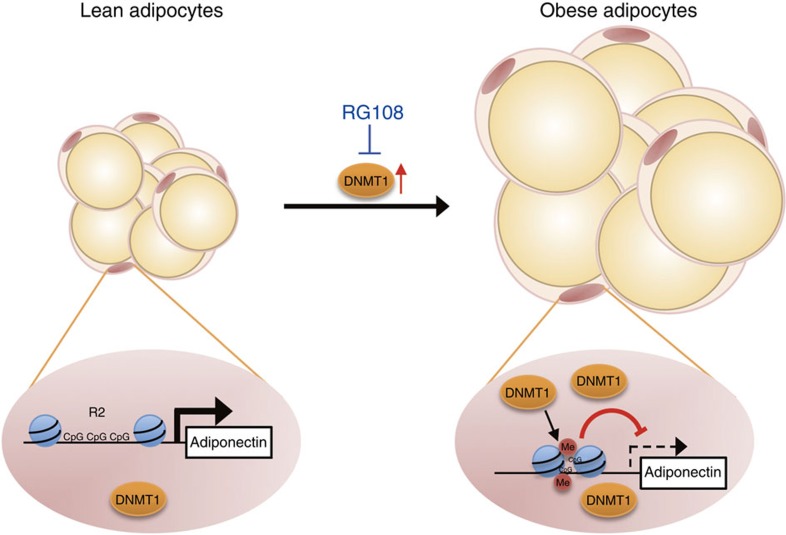
Adiponectin plays a key role in the regulation of the whole-body energy homeostasis by modulating glucose and lipid metabolism. Although obesity-induced reduction of adiponectin expression is primarily ascribed to a transcriptional regulation failure, the underlying mechanisms are largely undefined. Here we show that DNA hypermethylation of a particular region of the adiponectin promoter suppresses adiponectin expression through epigenetic control and, in turn, exacerbates metabolic diseases in obesity. Obesity-induced, pro-inflammatory cytokines promote DNMT1 expression and its enzymatic activity. Activated DNMT1 selectively methylates and stimulates compact chromatin structure in the adiponectin promoter, impeding adiponectin expression. Suppressing DNMT1 activity with a DNMT inhibitor resulted in the amelioration of obesity-induced glucose intolerance and insulin resistance in an adiponectin-dependent manner. These findings suggest a critical role of adiponectin gene epigenetic control by DNMT1 in governing energy homeostasis, implying that modulating DNMT1 activity represents a new strategy for the treatment of obesity-related diseases.


Figures

Figure 1
Figure 1. Adiponectin promoter region 2 (R2) is hypermethylated in the adipocytes of obese subjects.
(ac) R2 bisulfite sequencing analysis in adipocytes from NCD-fed (n=4) or HFD-fed (n=3) mice. (a) Each row indicates sequencing results of independent clones. Open circles denote unmethylated CpGs and closed circles represent methylated CpGs. The CpG position relative to upstream transcription start site of mouse adiponectin gene is shown below each column. (b) Percentage of R2 5-methylcytosine (5-mC). (c) Correlation of R2 DNA methylation and adiponectin mRNA levels. mRNA levels were measured by qPCR. r2 and P values are indicated on the graph. (df) R2 bisulfite sequencing results in adipocytes from WT (n=4) or db/db (n=4) mice. (d) Methylation status of each CpG. (e) Percentage of R2 cytosine methylation. (f) Correlation of R2 DNA methylation and adiponectin mRNA levels. mRNA levels were measured by qPCR. r2 and P values are indicated on the graph. (gi) Human adiponectin promoter R2 bisulfite sequencing results in adipocytes isolated from human adipose tissue. (g) The CpG position relative to upstream transcription start site is shown blow each column. (h) Adiponectin methylation levels in human adipocytes were negatively associated with body mass index. (i) Correlation between adiponectin mRNA levels and R2 methylation levels in human adipocytes. mRNA levels were measured by qPCR. r2 and P values are indicated on the graph. Results are expressed as the mean±s.e.m. *P<0.05; ***P<0.001 in a two-tailed Student's t-test. #, individual mice.
Figure 2
Figure 2. DNMT1 regulates the DNA methylation of the adiponectin promoter R2.
(a) Dnmt1 mRNA levels in adipocytes from NCD- (n=4) or HFD-fed (n=3) mice and in adipocytes from WT (n=4) or db/db mice (n=4). (b) Correlation between body mass index and DNMT1 mRNA levels in human adipocytes. mRNA levels were measured by qPCR. r2 and P values are indicated on the graph. (ce) DNMT1 was suppressed by small interfering RNA in 3T3-L1 cells (n=3). (c) Dnmt1 and adiponectin mRNA levels. mRNA levels were measured by qPCR. (d) Adiponectin protein levels were determined by western blot analysis. (e) Bisulfite sequencing data at the R2. (fh) DNMT1 overexpression in differentiated 3T3-L1 cells (n=3). (f,g) Dnmt1 and adiponectin mRNA and protein levels were measured by qPCR and western blot analysis. (h) Degree of R2 DNA methylation was examined by bisulfite sequencing. (i) AluI restriction sites in R2. Red and grey arrows indicate the AluI restriction sites and CpG locations in the R2, respectively. Double headed arrow points to PCR amplified region. (j) Restriction enzyme accessibility assay in adipocytes from HFD-fed (n=5) or NCD-fed (n=5) mice. EcoRI and BamHI, which do not digest R2, were used as negative controls. Results are expressed as the mean±s.e.m. Similar results were obtained at least more than three independent experiments. *P<0.05; **P<0.01; ***P<0.001 in a two-tailed Student's t-test. siNC; negative control siRNA. See Supplementary Fig. 11 for full-length images of blots.
Figure 3
Figure 3. Inflammatory cytokines inhibit adiponectin expression by inducing DNMT1 expression and R2 DNA methylation.
Differentiated 3T3-L1 adipocytes were incubated with or without TNFα (10 ng ml−1) or IL-1β (10 ng ml−1) for 24 h. (a,b) Adiponectin, Dnmt1 and Mcp-1 mRNA levels. (c) DNMT relative enzymatic activity. (d,e) R2 bisulfite sequencing analysis and quantification of 5-mC. (f) Restriction enzyme accessibility assay. mRNA levels were measured by qPCR. (g) R2 ChIP analysis. Results are expressed as the mean value±s.e.m. of three independent samples (n=3). Similar results were obtained at least more than three independent experiments. *P<0.05; **P<0.01; ***P<0.001 in a two-tailed Student's t-test. Cntl, control.
Figure 4
Figure 4. Inhibition of DNMT1 relieves TNFα-induced adiponectin gene suppression through inhibition of R2 DNA hypermethylation.
(ad) 3T3-L1 adipocytes were pretreated with DMSO (white bars) or RG108 (blue bars; 100 μM) for 24 h before TNFα treatment (hatched bars; 10 ng ml−1) for 24 h (n=3). (a) Relative DNMT enzymatic activity. (b) mRNA levels of Dnmt1, adiponectin and Mcp-1. mRNA levels were measured by qPCR. (c,d) Bisulfite sequencing results of the adiponectin promoter R2 (c) and R1 (d) in 3T3-L1 cells treated with TNFα. Quantification of the 5-mC levels in the adiponectin promoter R2 and R1. (e,f) In 3T3-L1 adipocytes, DNMT1 was suppressed by small interfering RNA. The cells were then incubated with or without TNFα (10 ng ml−1) for 24 h (n=3). (e) mRNA levels of adiponectin, Dnmt1 and Mcp-1 in negative control (NC) or DNMT1 suppressed 3T3-L1 adipocytes. mRNA levels were measured by qPCR. (f) R2 DNA methylation levels were measured by bisulfite sequencing. (g,h) 3T3-L1 adipocytes were pretreated with DMSO (white bars) or RG108 (blue bars; 100 μM) for 24 h before TNFα treatment (hatched bars; 10 ng ml−1) for 24 h (n=3). (g) R2 ChIP analysis. Quantification of DNMT1 and MeCP2 relative recruitment and H3K9Ac levels using qPCR. (h) Restriction enzyme accessibility assay. After restriction with endonucleases, purified gDNA was amplified and quantified using qPCR. All results are expressed as mean±s.e.m. *P<0.05; **P<0.01; ***P<0.001 in a two-tailed Student's t-test. Cntl, control.
Figure 5
Figure 5. RG108 elevates adiponectin levels by the reduction of R2 DNA methylation in db/db mice.
db/db mice were injected with vehicle (Veh, 1% DMSO, black circle and bar, n=4–7) or RG108 (blue circle, square and bar, n=4–7). (a) Adiponectin mRNA levels in adipocytes. mRNA levels were measured by qPCR. (b) Western blotting of adiponectin in eWAT. (c) Serum adiponectin levels were determined by western blot analysis. (d) Relative levels of each oligomeric complex of adiponectin in serum were analysed by gel filtration analysis. (e,f) R2 DNA methylation levels were examined using bisulfite sequencing in adipocytes. (g) Correlation between R2 DNA methylation and adiponectin mRNA levels. r2 and P values are indicated on the graph. Results are expressed as the mean±s.e.m. *P<0.05; **P<0.01 in a two-tailed Student's t-tests. #, individual mice. See Supplementary Fig. 11 for full-length images of blots.
Figure 6
Figure 6. RG108 improves metabolic parameters in db/db mice.
db/db mice were injected with vehicle (Veh, 1% DMSO, n=5–7) or RG108 (n=5–7). (a) Fasting glucose and insulin levels in serum. (b) Serum TG and FFA levels. (c) OGTT. After 16 h fasting, Veh- or RG108-injected db/db and DKO mice were administered 1 g kg−1 body weight of glucose bolus by oral gavage and blood glucose levels were monitored. Time course of blood clearance and area under the curve (AUC) are presented. (d,e) Western blot of insulin signalling in liver (d) and skeletal muscle (e). Veh- or RG108-injected db/db mice were fasted for 16 h, and then 0.75 mU g−1 body weight of insulin were intraperitoneally injected. After 30 min, livers and skeletal muscle tissues were collected. (f) Histological analysis of epididymal white adipose tissue (eWAT; haematoxylin and eosin (H&E) staining). Scale bar, 200 μm. (g) Flow cytometry analysis of SVCs from eWAT. (h) mRNA levels of pro-inflammatory genes in SVCs. mRNA levels were measured by qPCR. (i) Histological analysis of the liver (H&E staining). Scale bar, 200 μm. (j) Hepatic TG contents. (k) mRNA levels of lipogenic genes in the liver. mRNA levels were measured by qPCR. (l) Relative mRNA levels of inflammatory genes in liver. Results are expressed as the mean±s.e.m. *P<0.05; **P<0.01 in a two-tailed Student's t-tests. See Supplementary Fig. 11 for full-length images of blots.
Figure 7
Figure 7. The effects of RG108 on the metabolic parameters abrogated in adiponectin and leptin receptor DKO mice.
db/db or adiponectin and leptin receptor DKO mice were injected with vehicle (1% DMSO; Veh, n=4–5) or RG108 (n=4–5). (a) Serum adiponectin levels were determined by ELISA. (b) Serum fasting glucose and insulin levels. (c) Serum TG levels. (d) OGTT. After 16-h fasting, mice were intraperitoneally injected with 1 g kg−1 body weight of glucose and the blood glucose levels were monitored. Time course of blood clearance and AUC are presented. (e) mRNA levels of inflammatory genes were examined in eWAT. mRNA levels were measured by qPCR. (f) Histological analysis of the liver (H&E staining). Scale bar, 50 μm. (g) Hepatic TG contents. Results are expressed as the mean±s.e.m. *P<0.05; **P<0.01; ***P<0.001 in a two-tailed Student's t-tests.
Figure 8
Figure 8. Overall model.
In obesity, increased DNMT1 induces DNA hypermethylation at the particular region (R2) of adiponectin promoter, resulting in suppression of adiponectin gene expression in adipocytes.

Comment in

References

    1. Jaenisch R. & Bird A. Epigenetic regulation of gene expression: how the genome integrates intrinsic and environmental signals. Nat. Genet. 33, (Suppl) 245–254 (2003). - PubMed
    1. Carone B. R. et al. Paternally induced transgenerational environmental reprogramming of metabolic gene expression in mammals. Cell 143, 1084–1096 (2010). - PMC - PubMed
    1. Park J. H., Stoffers D. A., Nicholls R. D. & Simmons R. A. Development of type 2 diabetes following intrauterine growth retardation in rats is associated with progressive epigenetic silencing of Pdx1. J. Clin. Invest. 118, 2316–2324 (2008). - PMC - PubMed
    1. Sandovici I. et al. Maternal diet and aging alter the epigenetic control of a promoter-enhancer interaction at the Hnf4a gene in rat pancreatic islets. Proc. Natl Acad. Sci. USA 108, 5449–5454 (2011). - PMC - PubMed
    1. Barres R. et al. Non-CpG methylation of the PGC-1alpha promoter through DNMT3B controls mitochondrial density. Cell Metab. 10, 189–198 (2009). - PubMed

Publication types

MeSH terms