. 2015 Jul 1;87(1):193-207.
doi: 10.1016/j.neuron.2015.06.019.

An Interglomerular Circuit Gates Glomerular Output and Implements Gain Control in the Mouse Olfactory Bulb

Affiliations

An Interglomerular Circuit Gates Glomerular Output and Implements Gain Control in the Mouse Olfactory Bulb

Arkarup Banerjee et al. Neuron. .

Abstract

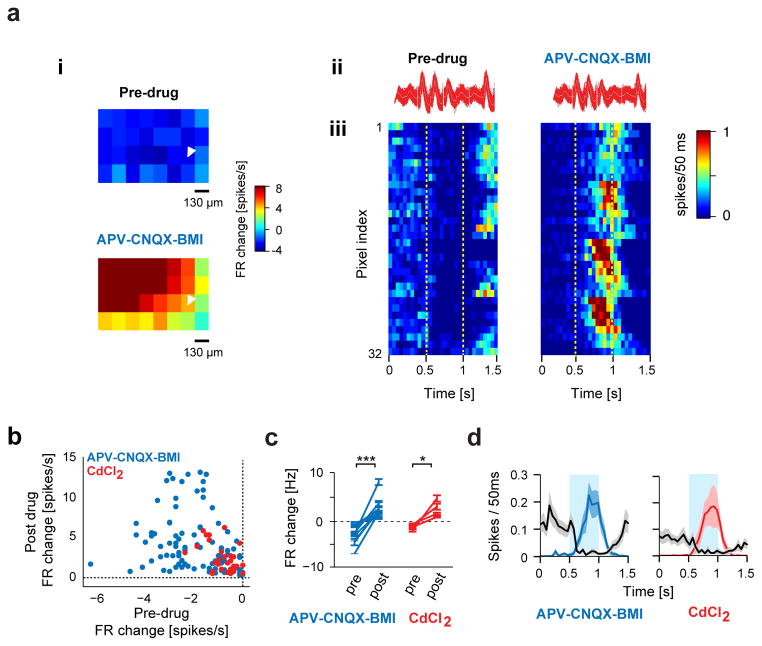
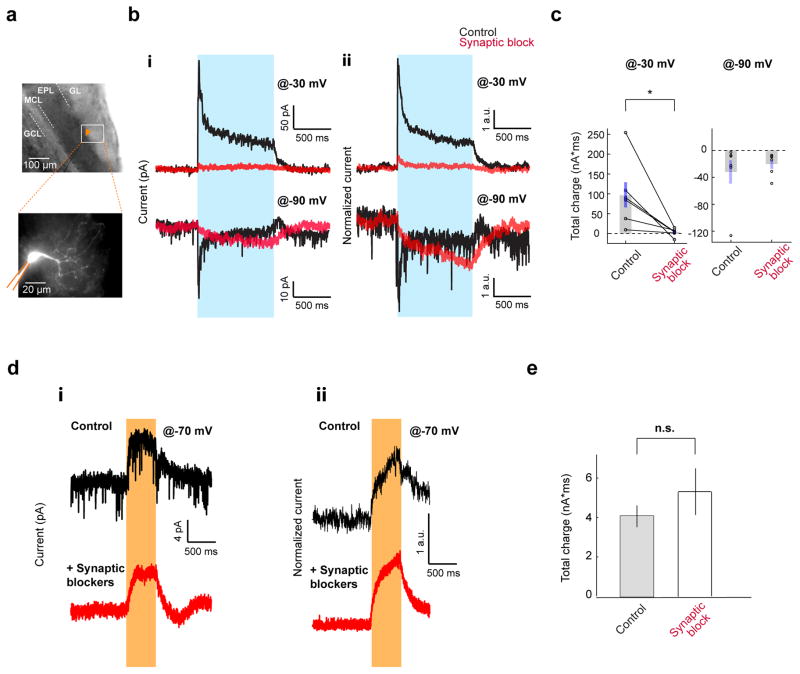
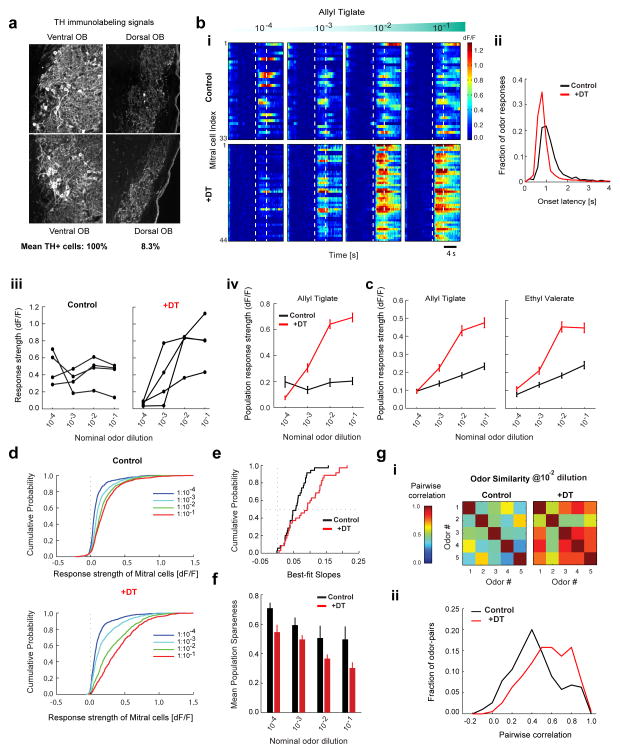
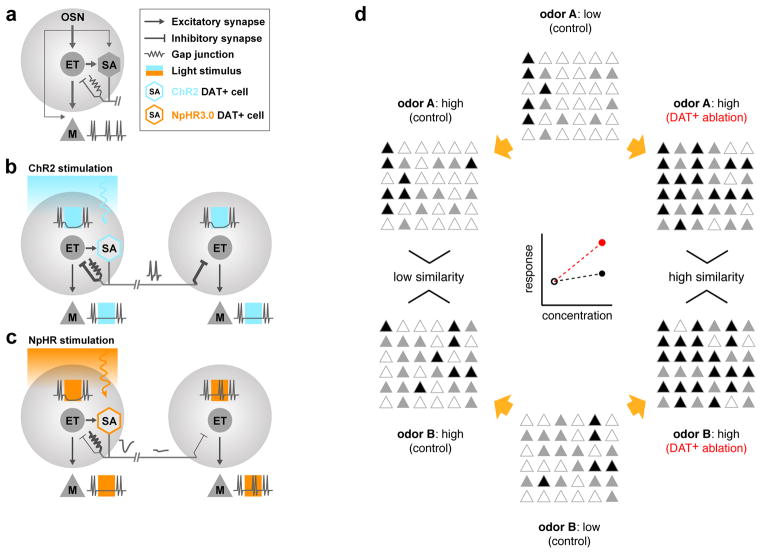
Odors elicit distributed activation of glomeruli in the olfactory bulb (OB). Crosstalk between co-active glomeruli has been proposed to perform a variety of computations, facilitating efficient extraction of sensory information by the cortex. Dopaminergic/GABAergic cells in the OB, which can be identified by their expression of the dopamine transporter (DAT), provide the earliest opportunity for such crosstalk. Here we show in mice that DAT+ cells carry concentration-dependent odor signals and broadcast focal glomerular inputs throughout the OB to cause suppression of mitral/tufted (M/T) cell firing, an effect that is mediated by the external tufted (ET) cells coupled to DAT+ cells via chemical and electrical synapses. We find that DAT+ cells implement gain control and decorrelate odor representations in the M/T cell population. Our results further indicate that ET cells are gatekeepers of glomerular output and prime determinants of M/T responsiveness.


Figures

Figure 1
Figure 1. Long-range broadcast of odor inputs across the glomerular layer
A. Expression profile of a DAT-Cre x Ai9 reporter mouse line in a montage of two-photon images of an OB coronal slice. Inset shows DAT+ cells in the glomerular layer. i: glomerular layer; ii: External plexiform layer; iii: Mitral cell layer; iv: Granule cell layer. B. Top, Confocal images from a DAT-Cre x Ai32 reporter mouse line, showing ChR2-EYFP fluorescence (left) and immunolabeling with TH antibody (center) and GAD67 antibody (right). Fiduciary marks show individual cell bodies. Bottom left, Pseudo-colored merge of ChR2-EYFP (green) and anti-TH (magenta). Bottom right, Pseudo-colored merge of anti-TH (magenta) and anti-GAD67 (cyan) staining. C. Widefield GCaMP3.0 responses of DAT+ cells (top) and glomerular intrinsic optical imaging (IOI) signals (bottom) in response to Ethyl valerate, 2-heptanone and Isoamyl acetate in the same animal. D. Time course of GCaMP3.0 signals of all 112 ROIs in response to the same odors from the example shown in C. ROIs were selected using glomerular outlines estimated from IOI. Dotted lines indicate odor presentation. E. Odor response spectra (ORS) of three ROIs monitored via IOI (i) and GCaMP3.0 imaging (ii) to a panel of 100 odors. Rows correspond to different ROIs. Each bar shows the average normalized change in amplitude with respect to baseline (dF/F) for a given odor. F. Distribution of ORS pairwise similarity for all ROI pairs within each hemi-bulb. Black line and gray bars respectively show similarity of ORS from IOI (14,211 pairs, 8 bulbs, 5 mice; average similarity 0.31±0.002) and GCaMP3.0 imaging (5,992 pairs, 3 bulbs, 3 mice; average similarity 0.83±0.002). ROIs were selected using glomerular outlines estimated from IOI. Red line shows distribution of pairwise similarity of GCaMP3.0 ORS for arbitrarily selected ROIs on the bulb surface (12,626 pairs, 5 bulbs, 3 mice; average similarity 0.88±0.001). Error values indicate standard error of the mean (SEM), unless explicitly stated otherwise. G. GCaMP3.0 (top) and IOI (bottom) responses to increasing concentrations of Valeraldehyde in the same animal. Odor concentrations are reported as nominal dilutions in mineral oil (10−5, 10−4, 10−3, 10−2, 10−1). H. Average GCaMP3.0 responses with increasing odor concentrations. Each point represents the average response of all ROI-odor pairs (311 ROIs, 5 bulbs, 6 odors) normalized and subtracted from the corresponding individual responses at lowest odor concentration (10−5). I. Average spatial spread of GCaMP3.0 responses as a function of increasing odor concentration. Each bar shows average for all bulb-odor pairs (dilutions 10−5 to 10−2: 5 bulbs, 6 odors; dilutions 10−6 and 10−1: 2 bulbs, 6 odors). ‘Air’ corresponds to baseline response to clean air stimulation. ‘all’ corresponds to the pooled average spatial spread across all odors (10−2 dilution) in the data (285 bulb-odor pairs, 6 bulbs). SpH corresponds to the pooled average spatial spread across all odors and concentrations from widefield imaging of OMP-SpH mice (66 bulb-odor pairs, 2 bulbs).
Figure 2
Figure 2. Responses of individual DAT+ cells are odor specific and scale with stimulus concentration
A. Two-photon image showing average resting fluorescence of a FOV from a DAT-Cre mouse x Ai38 reporter mouse line. Numbers denote representative DAT+ cell bodies. B. GCaMP3.0 signals (dF/F) of DAT+ cells shown in A to Ethyl tiglate, Ethyl valerate and Ethyl propionate at 10−2 oil dilution. Black traces indicate individual trials. Gray band indicates odor presentation. C. Two-photon images from a FOV showing average resting fluorescence (i) and odor evoked dF/F responses (ii–iv) of GCaMP3.0 labeled DAT+ cells around several glomeruli to 2,4,5-trimethyl thiazole (ii), 2-hexanone (iii) and Isobutyl propionate (iv). Fiduciary marks indicate cell bodies. Same color arrows indicate DAT+ cells selected around the boundaries of the same glomerulus. D. Odor Response Spectra (ORS) of the DAT+ cells marked in c (i) to a panel of 50 odors. Colors indicate putative sister DAT+ cells. E. Distribution of ORS similarity for all cell (ROI) pairs within individual FOVs. Gray bars and red line show similarity of ORS corresponding to DAT+ cell bodies selected around the same glomeruli (1,390 pairs; average similarity 0.86±0.005) and randomly across (9,845 pairs; average similarity 0.56±0.003) glomeruli respectively. 331 ROIs, 50 odors, 4 mice. F. GCaMP3.0 signals (dF/F) from 59 DAT+ cells to increasing concentrations of Isoamyl acetate, Valeraldehyde and Heptanal within the same FOV. Color indicates normalized change in fluorescence with respect to pre-odor baseline. Dotted lines mark odor presentation. G. Mean odor response (5 repeats) of four example DAT+ cells in F to increasing concentrations of Allyl tiglate (blue), Isoamyl acetate (cyan), Valeraldehyde (green), Ethyl valerate (magenta) and Heptanal (red). H. Mean of odor response from all glomerular ROIs selected (red) and for individual DAT+ cell bodies (dotted black) across five odors, at 4 different concentrations. 34 glomerular ROIs, 110 DAT+ cells in 3 mice. I. Cumulative distribution of DAT+ cells’ odor responses across 4 concentrations (n = 110 DAT+ cells, 3 mice).
Figure 3
Figure 3. Photoactivating DAT+ cells results in long-range suppression of M/T cell firing
A. Top, Schematic of the experiment for optogenetic stimulation of ChR2-expressing DAT+ cells (green) with simultaneous M/T (brown) recordings. Bottom, Camera image of the OB, an example spot for photostimulation (130 μm × 130 μm) and fiduciary mark shows location of recording electrodes. Only spots that evoked a significant change from baseline are shown (two-sample t-test, p < 0.05). B. (i) 2D light map of one M/T unit with blue light spots at four different light intensities (15, 8.3, 5.8, 1.5 mW/mm2). Color indicates percentage change in M/T firing with respect to pre-light stimulation baseline (15 repeats). (ii) Spike raster showing individual trials from the light mapping session in (i) (15 mW/mm2). Pixels, from bottom left to top right corner, in the light map are re-ordered as top to bottom rows in the spike raster. All repeats for each pixel are stacked together. Blue band indicates photostimulation. (iii) Strength of light-evoked inhibition as a function of photostimulation distance from the recording site, for the light maps in (i). Each dot represents percentage inhibition from baseline upon stimulation of an individual spot. Only spots that evoked a significant change from baseline are plotted (two-sample t-test, p < 0.05). C. Strength of light-evoked inhibition (top) and fraction of significantly inhibited spots (bottom, two-sample t-test, p < 0.05) as a function of photostimulation distance from the recording site. Each dot/bar denotes average of all spots from 12 M/T units, 4 mice. Light intensity: 15 mW/mm2. D. (i) Spike rasters of an M/T unit upon presentation of Allyl tiglate (first row), Valeraldehyde (second row) and spontaneous activity (third row) by itself, or with full-field blue light stimulus at two different light intensities (second and third columns). Gray band indicates odor stimulus. Blue line indicates light stimulus. (ii) Percentage inhibition of firing rate ((FRodor −FRodor+light)/FRodor) as a function of normalized blue light intensity plotted on log scale for the unit in (i). Blue arrows denote the light intensities corresponding to rasters in (i). E. Summary of percentage inhibition versus blue light intensity. Each line denotes the average percentage inhibition across 5 odors for a single M/T unit (n = 8 units, 2 mice). Dotted lines represent M/T units recorded in one mouse and solid lines those recorded in a second mouse. Maximum light intensity was 7.9 mW/mm2. F. (i) Camera image of the OB (top) and light masks used for photoactivation (bottom) during the recording session shown in (ii). Fiduciary mark (orange) indicates location of recording electrodes. (ii) Peri-stimulus time histograms (PSTH, 500 ms bins) of an example M/T unit in response to ‘Valeraldehyde’ (dilution 10−3) (top) and ‘Valeraldehyde + blue light stimulation’ (bottom). Gray band and blue line indicates odor and light stimulus respectively. G. Scatter plot of average firing rates of individual M/T units during ‘odor’ and ‘odor + light’. Points above and below the diagonal respectively denote excitation and inhibition of M/T firing. 351 cell-odor pairs, 41 M/T units from 6 mice.
Figure 4
Figure 4. Optogenetic silencing of DAT+ cells suppresses M/T cells
A. (i) Schematic for in vivo full-field optogenetic inhibition of NpHR3.0-expressing DAT+ cells (green) with simultaneous M/T (brown) recordings. (ii) PSTH (500 ms bins) of an example M/T unit during baseline (‘air’) and increasing concentrations of Isoamyl acetate, in the absence (‘odor’) and presence (‘odor + light’) of DAT+ cell suppression (NpHR3.0 stimulation). Yellow bars indicate light stimulus. B. Scatter plot of average firing rates of all recorded M/T units during ‘odor’ and ‘odor + light’ conditions, at four different odor concentrations. 10−4: 110, 10−3: 94, 10−2: 110, 10−1: 136 cell-odor pairs; 26 M/T units from 12 mice. C. Summary plot showing average light-induced effect (change index, CI) for all cell-odor pairs (same as above) as a function of odor-evoked firing rate. CI is calculated as [(FRodor − FRodor+light)/(FRodor + FRodor+light)] where FRodor+light and FRodor correspond to the average odor-evoked firing in the presence and absence of light stimulation respectively. 450 cell-odor pairs, 26 M/T units, 12 mice. D. (i) Schematics of optogenetic inhibition of NpHR3.0-expressing DAT+ cells (green) with simultaneous M/T (brown) recordings. (ii) 2D light maps of three simultaneously recorded M/T units upon optogenetic suppression of NpHR3.0 expressing DAT+ cells by yellow light (130 μm × 130 μm size, 500 ms, 50 repeats). Color denotes firing rate change (spikes/s) with respect to pre-light baseline. (iii) 2D light maps of two simultaneously recorded M/T units upon optogenetic activation of ChR2-expressing DAT+ cells by blue light (130 μm × 130 μm size, 500 ms, 15 repeats), plotted as in (ii). Fiduciary mark shows location of recording electrodes.
Figure 5
Figure 5. Light-induced suppression of M/T cells by DAT+ cells switches to excitation in presence of synaptic blockers
a. (i) Spike waveforms of an example M/T unit from a DAT-Cre mouse injected with DIO-ChR2-EYFP AAV virus before (left) and after (right) application of drugs. (ii) Example M/T unit shown in (i) showing change in firing upon mapping the OB surface with blue light spots (130 μm × 130 μm, 15 mW/mm2, 15 repeats) before (top) and 30 min after (bottom) bath application of synaptic blockers (APV-CNQX-BMI). Color indicates percentage change in firing with respect to pre-light stimulation baseline. (iii) PSTHs of all spots from the light mapping session in (i), before (left) and after (right) drug application. Pixels, from bottom left to top right corner, in the light map are re-ordered as top to bottom rows in the PSTH. Dotted lines indicate light stimulus. Color indicates firing rate in each 50 ms bin. Fiduciary mark shows location of recording electrodes. B. Scatter plot showing light-evoked change in firing rate of 15 M/T units during control and drug conditions. Each dot corresponds to a light stimulation spot that significantly modulated firing of the recorded M/T unit in the control condition. Blue and red dots correspond to APV-CNQX-BMI (92 spots, 11 M/T units) and CdCl2 (32 spots, 4 M/T units) conditions respectively. Significance was tested using a paired t-test for all spots shown before and during drug application (blue dots, p < 0.001) and CdCl2 (red dots, p < 0.001). C. Summary plot showing light-evoked change in firing rate of all M/T units before and during APV-CNQX-BMI (blue, 11 M/T units, 4 bulbs) and CdCl2 (red, 4 M/T units, 2 mice) application. * p < 0.05, *** p < 0.001, paired t-test. D. Average time-course of firing rate of all recorded M/T units before (black) and during application of APV-CNQX-BMI (blue) or CdCl2 (red). Only spots that significantly modulated the M/T firing rate in the control condition were included. Shaded bands indicate SEM across M/T units.
Figure 6
Figure 6. DAT+ cells interact with ET cells through both chemical and electrical synapses
A. Whole cell recordings from ET cells upon full-field activation of ChR2 expressing DAT+ cells in acute horizontal OB slices. Top, Image of the patch pipette (fiduciary mark) recording from an ET cell in the GL. Bottom, Typical morphology of an ET cell filled with Alexa 594 fluorescent dye. B. Voltage clamp recordings from ET cells as above. (i) Top, Application of synaptic transmission blockers abolishes the light-induced outward current at −30 mV holding potential in a representative ET cell. Black and red traces (average of 10 repeats) represent trials pre- and post-drug application respectively. Blue bar indicates light stimulation. Bottom, in the same ET cell, the light-induced current reverses polarity at −90 mV holding potential (black trace, average of 10 repeats). Application of synaptic blockers (red trace, average of 10 repeats); (ii) Average of light-induced currents of 6 ET cells at −30 mV (top) and −90 mV (bottom) holding potentials, before (black) and after (red) pharmacological block of synaptic transmission. Currents from individual cells are normalized by the average current during the pre-drug light period. C. Summary of total light-induced charge in ET cells shown in B before and after pharmacological block of synaptic transmission. Average light-induced total charge at −30 mV before (98±32 nA*ms) and after synaptic block (3.2±3.7 nA*ms) was significantly different (n = 6 cells, p = 0.037, paired t-test). Average light induced total charge at −90 mV was −32±18 nA*ms and −20±6 nA*ms before and after synaptic block respectively (n = 6 cells). D. Voltage clamp traces (−70 mV holding potential) from ET cells upon full-field inactivation of NpHR3.0 expressing DAT+ cells. (i) In an example ET cell, yellow light induces an outward current (top, average of 10 repeats), which persists in the presence of synaptic blockers (bottom, average of 10 repeats). (ii) Average light-induced currents across ET cells in the absence (top, n = 8) or in the presence of synaptic blockers (bottom, n = 12). Currents from individual cells are normalized by the average current during the light period. E. Total light-induced charge at −70mV holding potential in the ET cells in the absence (4.1±0.55 nA*ms, n = 8 cells) and presence (5.3±1.2 nA*ms, n = 7 cells) of synaptic blockers (p = 0.37, two-sample unpaired t-test).
Figure 7
Figure 7. DAT+ cells implement gain control and decorrelate mitral cell odor responses
A. TH+ immunohistochemistry in the olfactory bulb of a DAT-Cre x Thy1-GCaMP3.0 mouse injected with AAV2.9-FLEX-DTR-GFP virus on the dorsal aspect of the OB followed by diphtheria toxin (DT) intraperitoneal injection. Confocal images of TH+ signal in two representative FOVs on the ventral (left) and dorsal (right) aspect of a given slice. Average counts of TH+ cells from all dorsal FOVs and from all ventral FOVs on in DTR injected mice, normalized by the number of visible glomeruli (100% for control and 8.3% for +DT, n = 1,259 cells, 8 FOVs, 2 mice). Residual signals mostly consisted of neuropil. B. Baseline-subtracted, normalized GCaMP3.0 ensemble mitral cell responses to increasing concentrations of Allyl tiglate. (Top) DAY 0 before injection of DT (control, n = 33 cells). (Bottom) Different FOV in the same OB on DAY 7 after DT injection (+DT, n = 44 cells). Each row represents an individual mitral cell (ROI) in the same FOV. Color indicates (dF/F). Dotted lines indicate odor presentation (4 s). C. (i) Distribution of onset latencies of mitral cell odor responses for control (1.55s ± 1.51s, n = 3660 cell-odor pairs) and +DT condition (1.2s ± 1.39s, n = 3000 cell-odor pairs). Numbers denote mean and standard deviation. Both the mean (two-sample t-test, p < 10−18) and the variance (F-test, p < 10−5) are significantly smaller in the +DT condition. (ii) Odor-evoked response (dF/F) of four example mitral cells from B, as a function of odor concentration. (iii) Mean odor-evoked response (dF/F) of all mitral cells from B as a function of odor concentration for Allyl tiglate on DAY 0 (black, n = 33 cells) and DAY 7 after +DT administration (red, n = 44 cells). D. Mean odor-evoked response (dF/F) of all mitral cells pooled across experiments as a function of odor concentration for Allyl tiglate and Ethyl valerate. Concentration response curves are shown for control (black, n = 168 cells, 7 FOVs, 7 mice) and +DT conditions (red, n = 150 cells, 7 FOVs, 3 mice). E. Cumulative distribution of odor response strength of all mitral cells pooled across experiments, to five odors as a function of concentration in the control condition (n = 168 × 5 cell-odor pairs for each concentration) and after +DT injection (n = 150 × 5 cell-odor pairs for each concentration). F. Cumulative distribution of slopes of the ensemble mitral cell concentration response curves separately fitted for each FOV and odor, in the control and +DT conditions (n = 35, 7 FOVs X 5 odors). G. Population sparseness of mitral cell odor representations for each concentration in the control (black, n = 168 cells, 7 FOVs) and +DT conditions (red, n = 150 cells, 7 FOVs). Each bar denotes the mean population sparseness for 5 odors at each concentration. H. (i) Matrix of correlation coefficients between the neural response spectra (length of vector = # of recorded neurons) for each odor pair at 1:100 dilution in the control and +DT conditions. (ii) Distribution of pairwise correlation coefficients between all stimulus pairs (n = 190 pairs, 5 odors at 4 concentrations) in the control and +DT conditions.
Figure 8
Figure 8. Schematic of the effect of DAT+ cell manipulations on M/T cell output
A. A simplified representation of the basic circuitry within a glomerulus. M/T cell and DAT+ cell firing is primarily driven by excitatory inputs from ET cells, compared to relatively weak contribution of direct OSNs inputs. DAT+ cells form inhibitory synapses and gap-junctions onto ET cells. B. Focal blue-light stimulation of ChR2-expressing DAT+ cells triggers synaptic inhibition of ET cells close by, as well as far away. Excitatory drive through gap-junctions is weak and readily outcompeted by the stronger synaptic inhibition, resulting in net inhibition of ET firing. Loss of excitatory ET drive consequently suppresses M/T cells. C. Yellow-light stimulation of NpHR3.0-expressing DAT+ cells hyperpolarizes DAT+ cells and subsequently ET cells due to transmission of light-induced hyperpolarization across gap-junctions. The resultant ET inhibition translates into reduced M/T firing as observed in the extracellular recordings. In contrast to B, the observed inhibition is spatially restricted due attenuation via passive conductance. Note that both ChR2 and NpHR3.0 stimulation lead to net inhibition of ET cells, albeit via different mechanisms. Under both conditions, net inhibition of ET cells strongly suppresses M/T firing, thereby highlighting the central role played by ET cells in determining OB output. D. At low concentrations, odors A and B activate distinct sets of M/T cells (middle). Higher concentrations increase both the number and amplitude of M/T responses (left). In the absence of DAT+ cells, more M/T cells are recruited (right) and the mean population activity increases more steeply with concentration (red). This results in increased overlap between the population representation of odors A and B. Concentration dependent lateral inhibition via DAT+ cells decreases the slope (gain) of the mean population activity of M/T cells (black) and reduces overlap between population representations of odors A and B (decorrelation).

References

    1. Apostolides PF, Trussell LO. Regulation of interneuron excitability by gap junction coupling with principal cells. Nat Neurosci. 2013;16:1764–1772. - PMC - PubMed
    1. Aungst JL, Heyward PM, Puche AC, Karnup SV, Hayar A, Szabo G, Shipley MT. Centre-surround inhibition among olfactory bulb glomeruli. Nature. 2003;426:623–629. - PubMed
    1. Azim E, Jiang J, Alstermark B, Jessell TM. Skilled reaching relies on a V2a propriospinal internal copy circuit. Nature. 2014;508:357–363. - PMC - PubMed
    1. Barlow Horace. In: Possible principles underlying the transformation of sensory messages. Rosenblith WA, editor. MIT Press; Cambridge, MA: 1961.
    1. Bloomfield SA, Völgyi B. The diverse functional roles and regulation of neuronal gap junctions in the retina. Nat Rev Neurosci. 2009;10:495–506. - PMC - PubMed

Publication types

Substances

LinkOut - more resources