. 2015 Aug 21;290(34):21163-21184.
doi: 10.1074/jbc.M115.648998. Epub 2015 Jul 2.

Activation of Autophagic Flux against Xenoestrogen Bisphenol-A-induced Hippocampal Neurodegeneration via AMP kinase (AMPK)/Mammalian Target of Rapamycin (mTOR) Pathways

Affiliations

Activation of Autophagic Flux against Xenoestrogen Bisphenol-A-induced Hippocampal Neurodegeneration via AMP kinase (AMPK)/Mammalian Target of Rapamycin (mTOR) Pathways

Swati Agarwal et al. J Biol Chem. .

Retraction in

Abstract

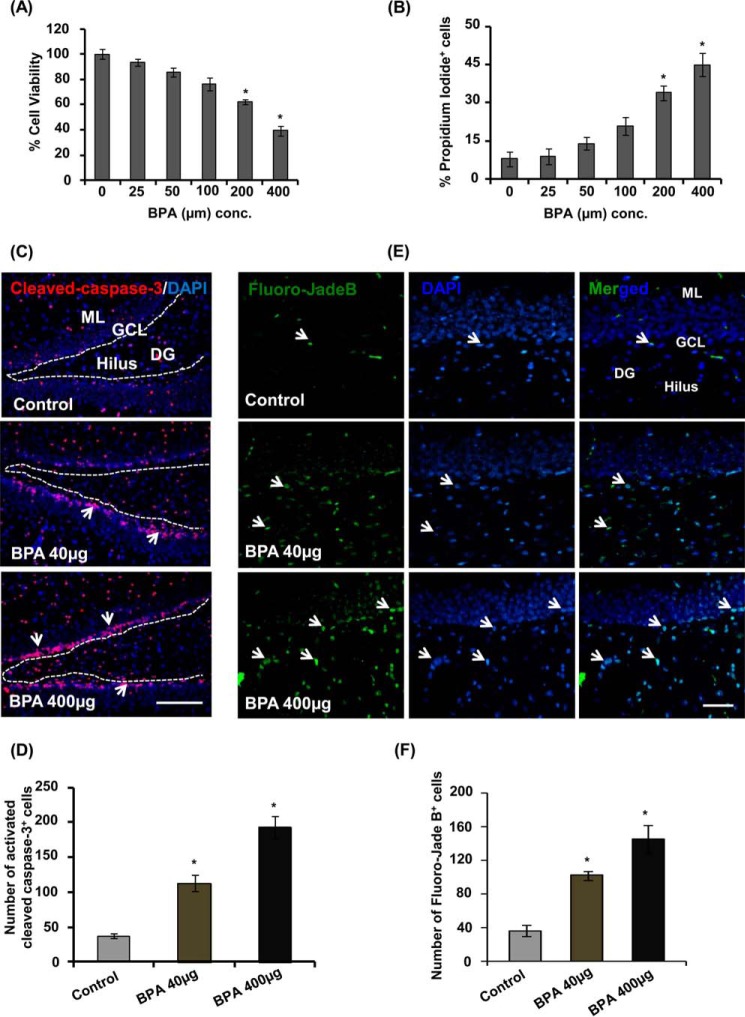
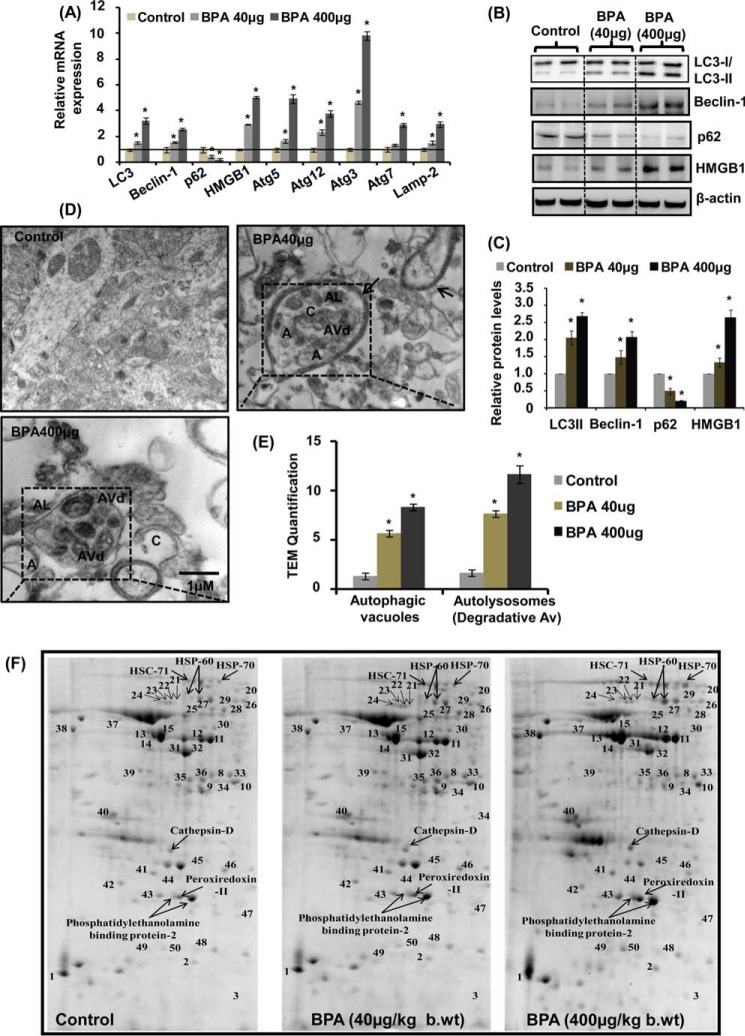
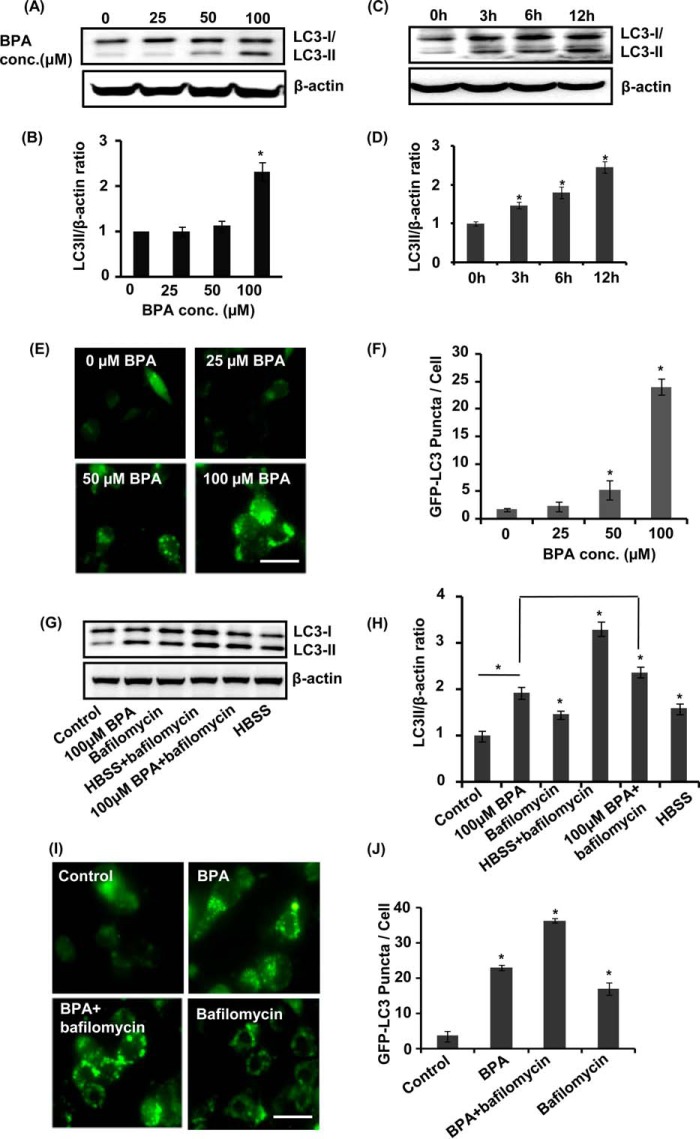
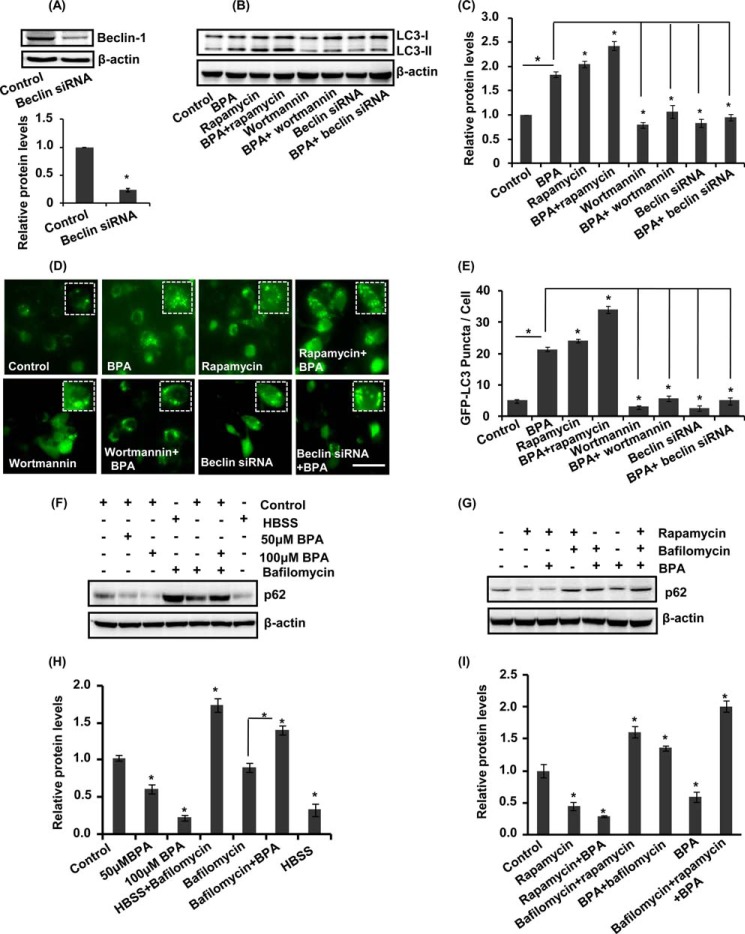
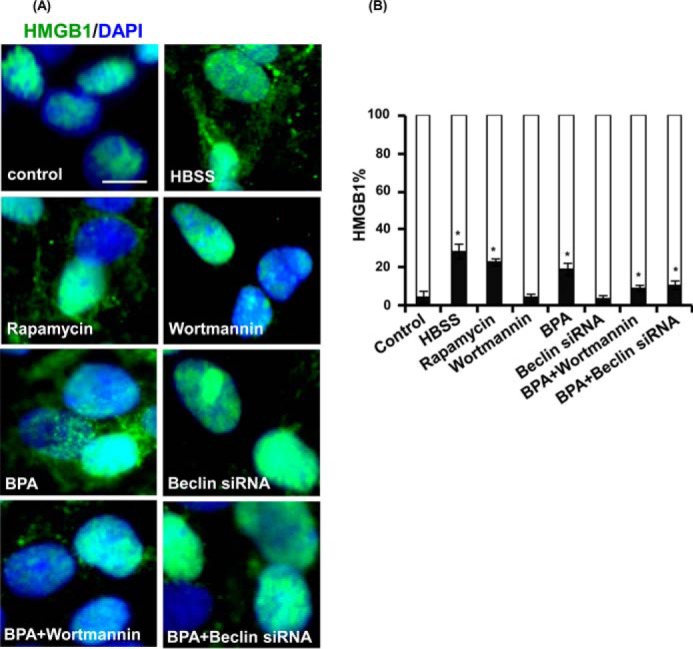
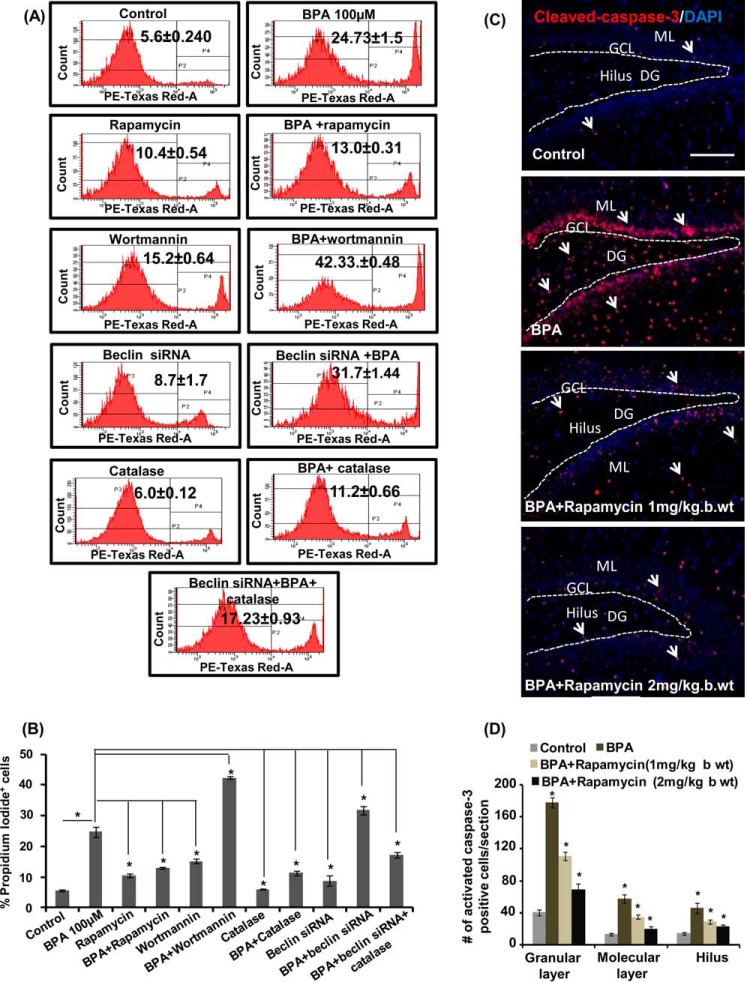
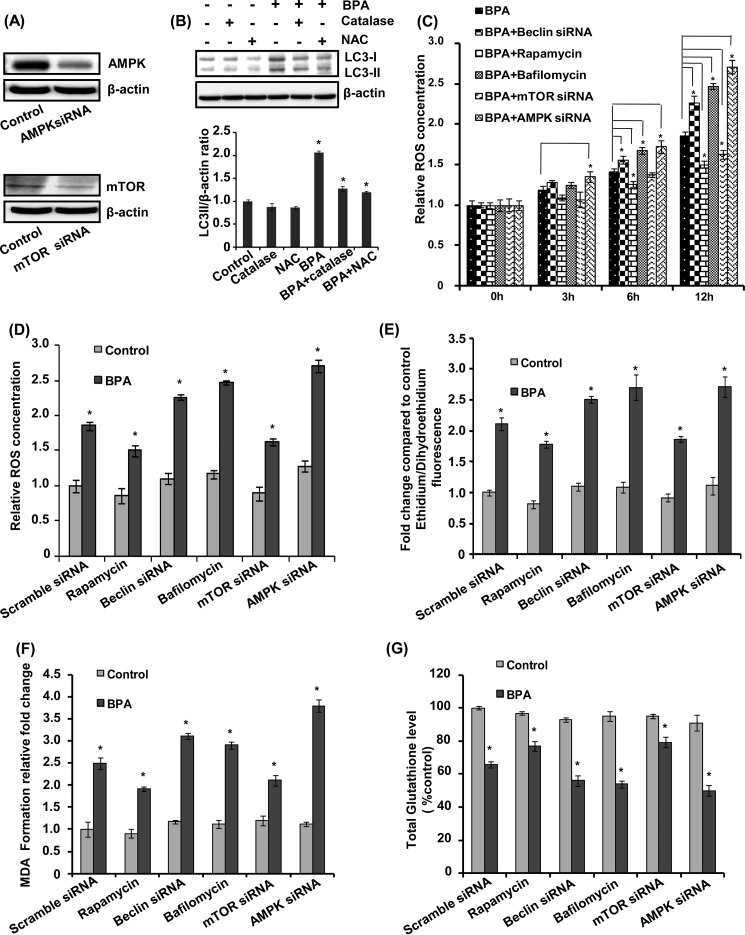
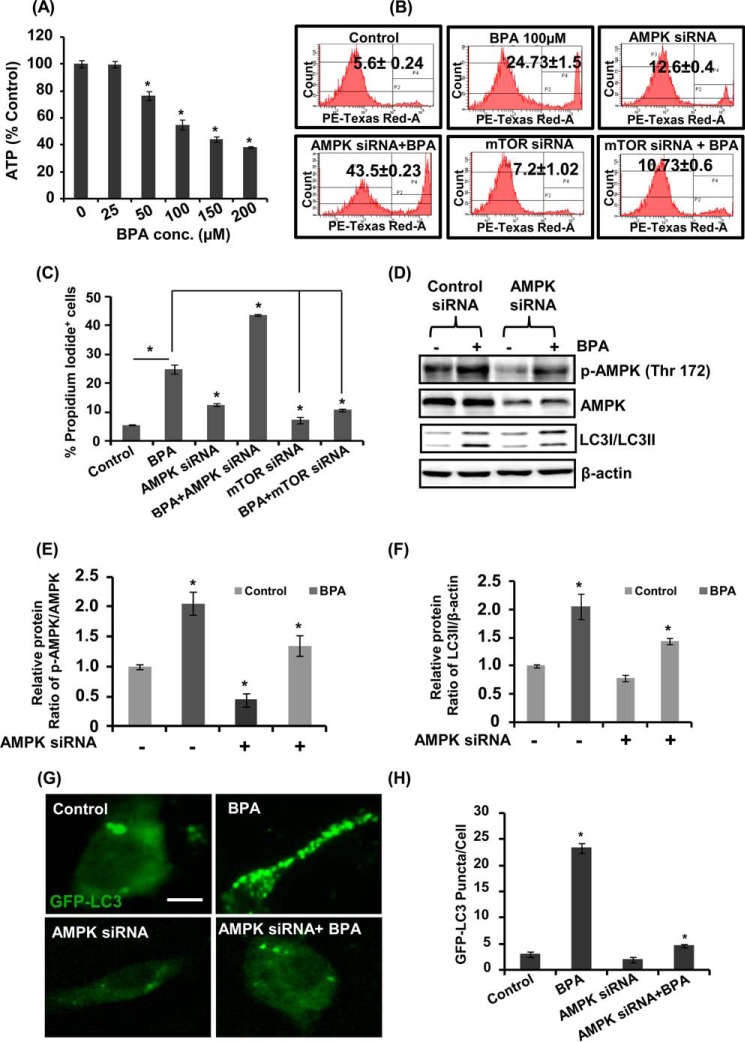
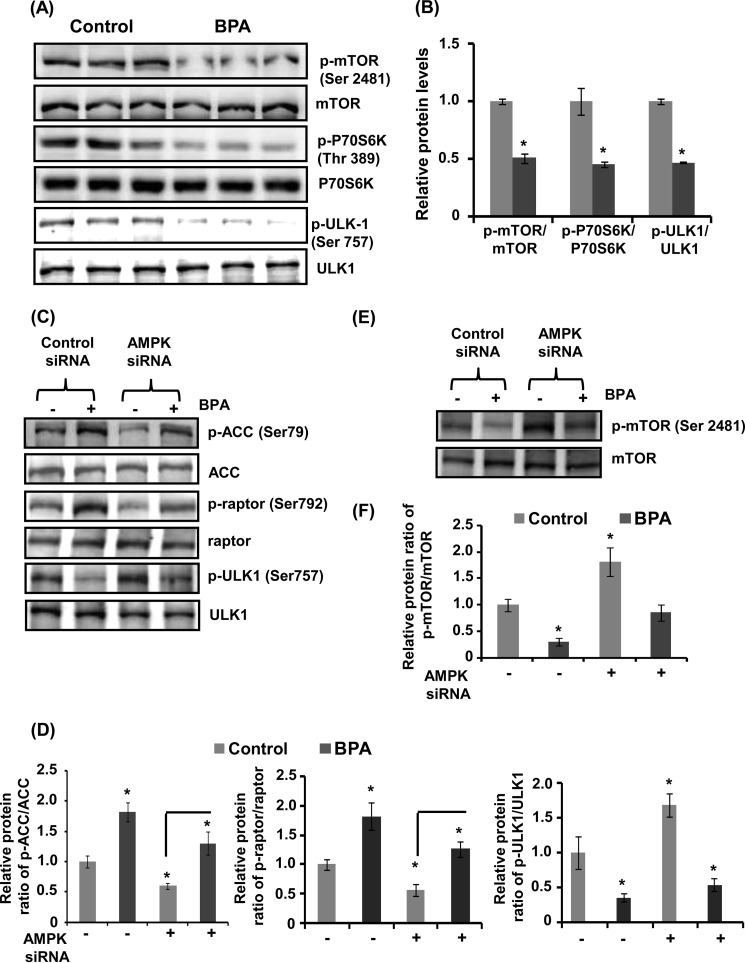
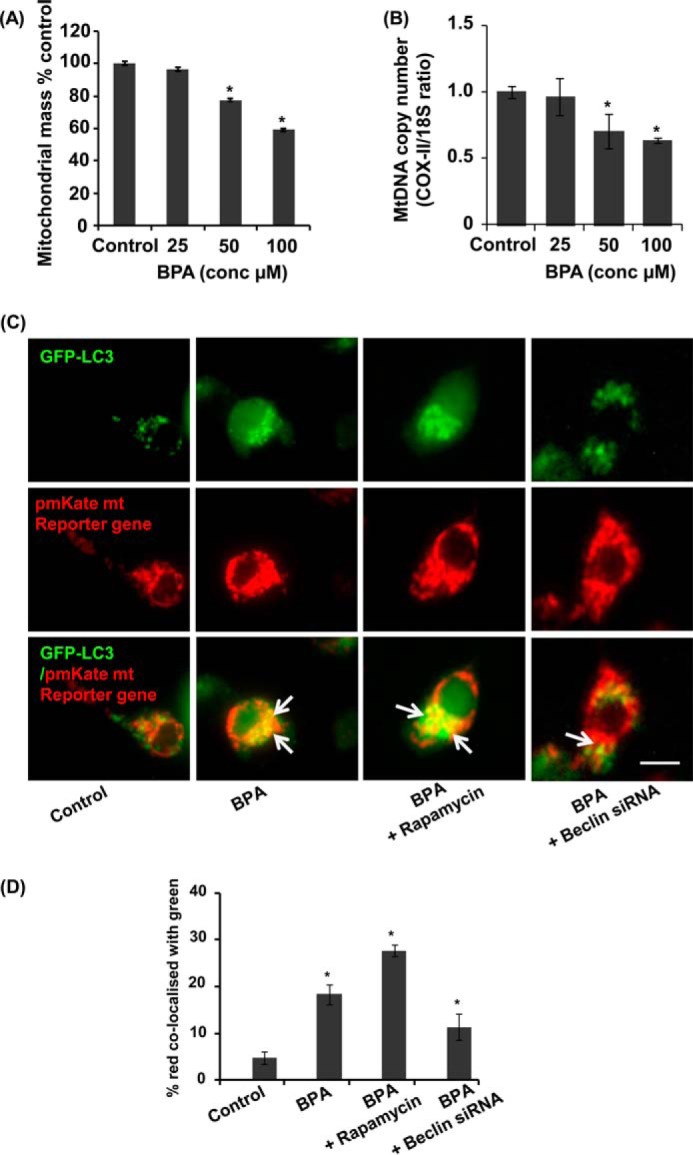
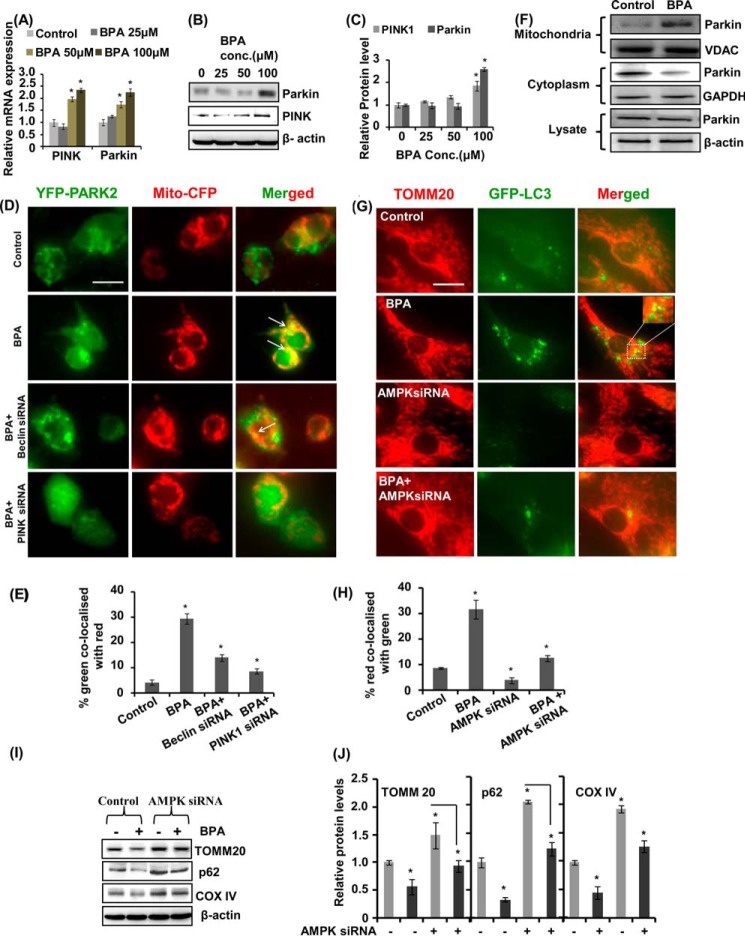
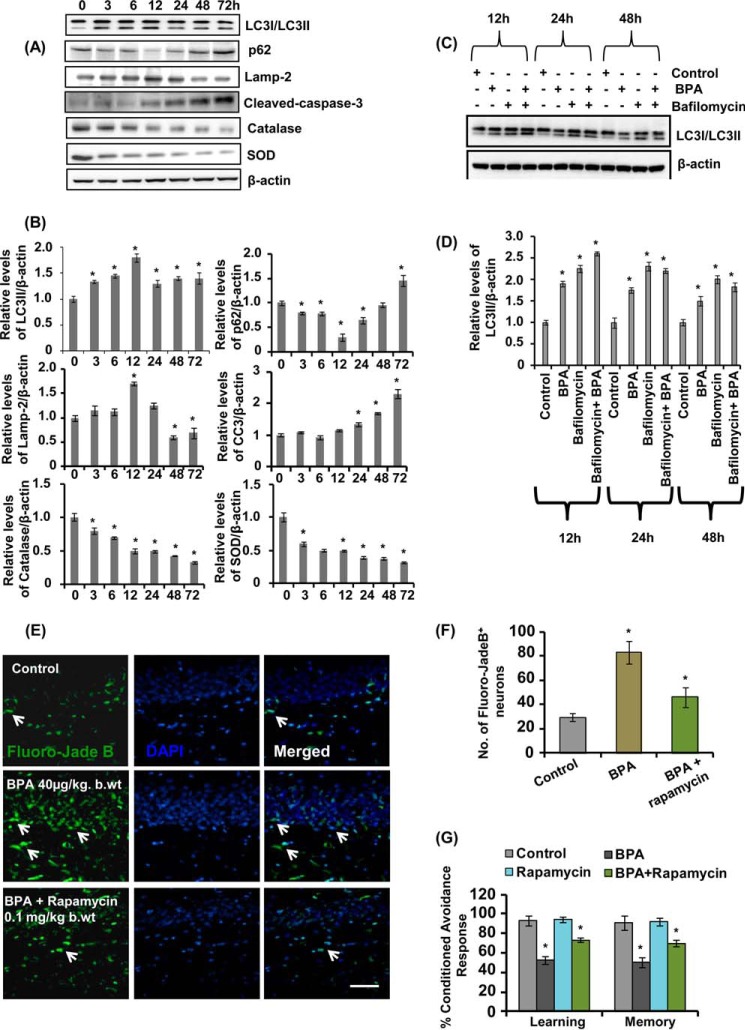
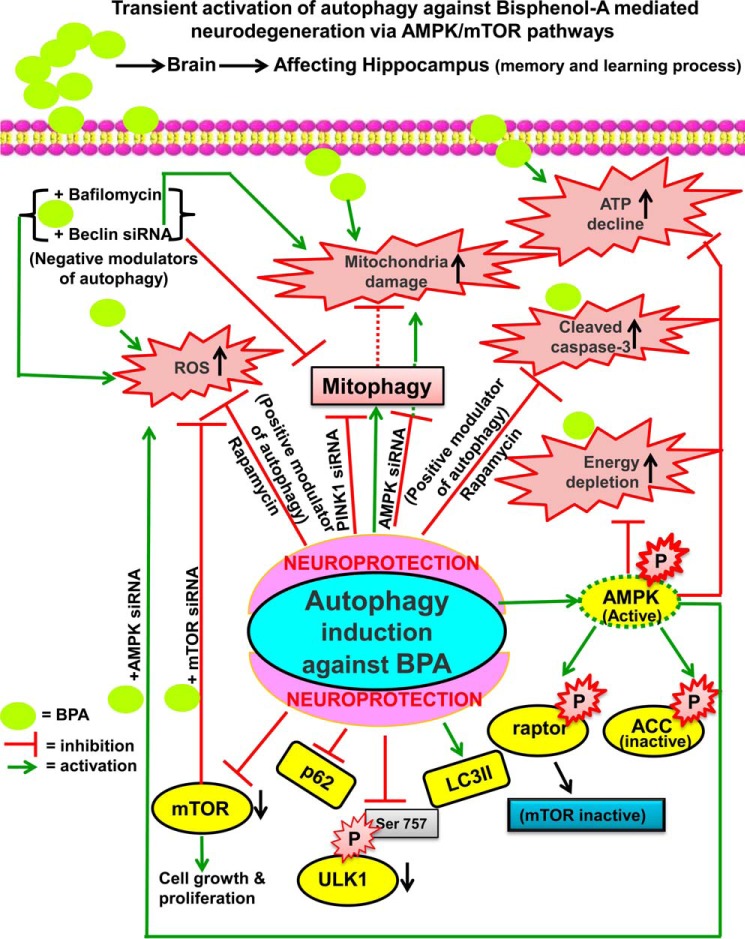
The human health hazards related to persisting use of bisphenol-A (BPA) are well documented. BPA-induced neurotoxicity occurs with the generation of oxidative stress, neurodegeneration, and cognitive dysfunctions. However, the cellular and molecular mechanism(s) of the effects of BPA on autophagy and association with oxidative stress and apoptosis are still elusive. We observed that BPA exposure during the early postnatal period enhanced the expression and the levels of autophagy genes/proteins. BPA treatment in the presence of bafilomycin A1 increased the levels of LC3-II and SQSTM1 and also potentiated GFP-LC3 puncta index in GFP-LC3-transfected hippocampal neural stem cell-derived neurons. BPA-induced generation of reactive oxygen species and apoptosis were mitigated by a pharmacological activator of autophagy (rapamycin). Pharmacological (wortmannin and bafilomycin A1) and genetic (beclin siRNA) inhibition of autophagy aggravated BPA neurotoxicity. Activation of autophagy against BPA resulted in intracellular energy sensor AMP kinase (AMPK) activation, increased phosphorylation of raptor and acetyl-CoA carboxylase, and decreased phosphorylation of ULK1 (Ser-757), and silencing of AMPK exacerbated BPA neurotoxicity. Conversely, BPA exposure down-regulated the mammalian target of rapamycin (mTOR) pathway by phosphorylation of raptor as a transient cell's compensatory mechanism to preserve cellular energy pool. Moreover, silencing of mTOR enhanced autophagy, which further alleviated BPA-induced reactive oxygen species generation and apoptosis. BPA-mediated neurotoxicity also resulted in mitochondrial loss, bioenergetic deficits, and increased PARKIN mitochondrial translocation, suggesting enhanced mitophagy. These results suggest implication of autophagy against BPA-mediated neurodegeneration through involvement of AMPK and mTOR pathways. Hence, autophagy, which arbitrates cell survival and demise during stress conditions, requires further assessment to be established as a biomarker of xenoestrogen exposure.

Keywords: hippocampus; neural stem cell (NSC); neurodegeneration; toxicology; xenobiotic.


Figures

FIGURE 1.
FIGURE 1.
BPA reduces viability of NSC-derived neurons and induces apoptosis and neurodegeneration in the hippocampus. A and B, primary hippocampal NSC-derived neurons were treated with BPA for 24 h. The graph shows the percentage of cell viability by trypan blue assay as compared with control, and values of PI+ cells are expressed in terms of percentage of PI+ cells as compared with control. The values are expressed as mean ± S.E. (error bars) (n = 3 independent experiments). C, representative immunofluorescent photomicrograph showing cells labeled with activated caspase-3 (red, apoptotic cell marker), counterstained with nuclear stain DAPI (blue) in the hippocampus. Arrows, activated caspase-3+ cells. Scale bar, 100 μm. D, quantitative analysis of activated caspase-3+-co-labeled cells in the hippocampus. E, Fluoro-Jade B-stained degenerating neurons in the hippocampus. Arrows, degenerating neurons. F, quantification analysis of Fluoro-Jade B+ degenerating neurons in the hippocampus. ML, molecular layer; GCL, granular cell layer; DG, dentate gyrus. Values are expressed as mean ± S.E. (n = 6 rats/group). *, p < 0.05 versus control. Scale bar, 20 μm
FIGURE 2.
FIGURE 2.
BPA enhances autophagy in the hippocampus region of the rat brain. A, effect of BPA (40 and 400 μg/kg body weight, orally) on the expression of autophagy genes in the hippocampus region of the rat brain was studied by quantitative RT-PCR. β-Actin served as housekeeping gene for normalization. The data are expressed as mean ± S.E. (error bars) (n = 6 rats/group). *, p < 0.05 versus control. B, Western blot analysis of levels of autophagy proteins in the hippocampus. C, quantification of relative protein density after normalization with β-actin. D, transmission electron microscopic examination of the hippocampus region. Several multilamellar bodies observed by TEM are indicated by a single arrow. Increased numbers of curving phagophores (C) and autolysosmes (AL) were found in BPA-treated rats. Double membrane organelles (autophagosomes; A) were scarcely found in 40-μg and rare in 400-μg BPA-treated pups. E, quantification of TEM images. F, effects of BPA on proteomic profile of autophagy-related proteins in the hippocampus of the rat brain. Shown is the separation of proteins found to be involved in autophagy by two-dimensional gel electrophoresis. The altered proteins after BPA treatment are labeled with arrows. *, p < 0.05 versus control. The data are expressed as mean ± S.E. (n = 3 rats/group).
FIGURE 3.
FIGURE 3.
BPA induces autophagy in the hippocampal NSC-derived neuronal cells. A–D, neuronal cultures were treated with various concentrations of BPA (25, 50, and 100 μm). At 100 μm concentration, the time (0, 3, 6, and 12 h)-dependent analysis of LC3-II protein levels was performed by immunoblotting. Relative protein levels were quantified after normalization of LC3-II with β-actin. The data are represented as mean ± S.E. (error bars) (n = 3 independent experiments). *, p < 0.05. E and F, neuronal cells were transfected with GFP-LC3 plasmid, following treatment with various concentrations of BPA. After 12 h of BPA treatment, GFP-LC3 puncta were observed and counted by fluorescence microscopy analysis and expressed as GFP-LC3 puncta/cells. Scale bar, 20 μm. G–J, neuronal cultures were preincubated with bafilomycin A1 (10 nm) and treated with BPA (100 μm) for 12 h. The experiments were performed both in the presence and absence of serum (HBSS conditions), and the levels of LC3-II protein in neuronal cells after BPA treatment were studied. Relative protein density was quantified after normalization of LC3-II with β-actin. Further, neuronal cells were also transfected with GFP-LC3 plasmid and treated with BPA, bafilomycin A1, and BPA + bafilomycin to study the autophagic flux. Scale bar, 20 μm *, p < 0.05.
FIGURE 4.
FIGURE 4.
BPA induces generation of autophagic flux in the hippocampal neuronal cultures. A–C, beclin siRNA decreased the beclin protein levels. Neuronal cells were preincubated with (rapamycin; 100 nm) and (wortmannin; 10 μm) and treated with BPA (100 μm) for 12 h. The levels of LC3-II protein (LC3-II lipidation) were studied in neuronal cells after BPA treatment. Relative protein densities were quantified after normalization with β-actin. D and E, treatment of BPA (100 μm) was given in the presence and absence of pharmacological activator (rapamycin; 100 nm), inhibitor (wortmannin; 10 μm), and beclin siRNA co-transfection in GFP-LC3-transfected neuronal cells. GFP-LC3 puncta were observed and quantified under a fluorescence microscope. The data are represented as mean ± S.E. (error bars) (n = 3 independent experiments). Scale bar, 20 μm. *, p < 0.05. F–I, the levels of p62 were studied in the presence of bafilomycin A1 and rapamycin followed by BPA treatment, both in control and HBSS conditions.
FIGURE 5.
FIGURE 5.
Autophagy generated against BPA promotes extranuclear HMGB1 translocation. A and B, rat hippocampal NSC-derived neurons were treated with rapamycin (100 nm), wortmannin (10 μm), and beclin siRNA followed by BPA (100 μm) for 12 h and then were immunostained with HMGB1. The figure depicts translocation of HMGB1 from the nucleus to the cytosol. The mean nuclear and cytosolic HMGB1 intensity per cell were observed by imaging cytometric analysis. The data are represented as mean ± S.E. (error bars) (n = 3 independent experiments). Scale bar, 20 μm. *, p < 0.05.
FIGURE 6.
FIGURE 6.
Autophagy compensates for BPA-induced cytotoxicity and apoptosis in neuronal cells and in the hippocampus of the rat brain. A and B, neuronal cells were preincubated with rapamycin, wortmannin, catalase, and beclin siRNA and treated with BPA (100 μm) for 12 h. PI staining was done through flow cytometry to further study the number of PI+ cells (apoptotic cells). The data are represented as mean ± S.E. (error bars) (n = 3 independent experiments). *, p < 0.05. C and D, rat pups were orally gavaged with BPA (400 μg/kg body weight) and/or intraperitoneal rapamycin (1 and 2 mg/kg body weight) during PND 14–21. Arrows, activated caspase-3+ cells (apoptotic marker) in the dentate gyrus region of the hippocampus. Scale bar, 100 μm. Values are expressed as mean ± S.E. (n = 6 rats/group). *, p < 0.05 versus control.
FIGURE 7.
FIGURE 7.
Autophagy as a protective response against BPA-induced ROS generation. A and B, AMPK and mTOR siRNA reduced the respective protein levels. Neuronal cultures were treated with BPA (100 μm) in the presence/absence of catalase (10,000 units/ml) and NAC (10 mm). The LC3-II lipidation was determined by immunoblotting. Relative LC3-II protein levels were quantified after normalization with β-actin. The data are represented as mean ± S.E. (error bars) (n = 3 independent experiments). *, p < 0.05. C and D, relative ROS levels were determined using 2,7-dichlorohydrofluorescein diacetate dye time-dependently from 3 to 12 h. E, levels of intracellular superoxides were monitored using DHE for 12 h. F and G, effects of BPA on lipid peroxidation and total glutathione levels were monitored in comparison with control groups.
FIGURE 8.
FIGURE 8.
Effects of BPA on ATP levels and the AMPK/mTOR pathways involved in autophagy. A, neuronal cells were treated with different concentrations of BPA (100 μm) for 12 h, and ATP levels were monitored through an ATP measurement kit using a luminometer. The data are represented as mean ± S.E. (error bars) (n = 3 independent experiments). *, p < 0.05. B and C, effects of BPA on cytotoxicity after knockdown of the expression of AMPK and mTOR in neuronal cells were studied by flow cytometry using PI. D–F, neuronal cells were transfected with AMPK siRNA and were treated with BPA. Effects of BPA on the levels of LC3-II and on the phosphorylation levels of AMPK were analyzed by immunoblotting. Relative protein levels were quantified after normalization with β-actin. G and H, neuronal cells were co-transfected with GFP-LC3 plasmid and AMPK siRNA, and effects of BPA on the expression of GFP-LC3 puncta were studied. Scale bar, 10 μm.
FIGURE 9.
FIGURE 9.
AMPK is chiefly involved in autophagy generated against BPA. A and B, neuronal cells were incubated with BPA (100 μm) for 12 h, and the protein levels were analyzed. The data are represented as mean ± S.E. (error bars) (n = 3 independent experiments). *, p < 0.05. C and D, neuronal cells were transfected with AMPK siRNA followed by exposure with 100 μm BPA. The transfected cells were incubated in the absence or presence of BPA for 12 h, and the levels of proteins were analyzed by immunoblotting, relative protein levels were quantified after normalization with ACC, raptor, and ULK1. E and F, the mTOR pathway is downstream of the AMPK pathway in BPA-treated neuronal cells. The phospho-mTOR and mTOR levels were analyzed after transfection with AMPK siRNA.
FIGURE 10.
FIGURE 10.
BPA induced mitochondrial loss and mitophagy in neuronal cells. A, BPA elicits significant mitochondrial loss in neuronal cells. The neuronal cells were treated with BPA for 12 h. Mitochondria-specific dye NAO staining was used to analyze mitochondrial mass. B, mitochondrial copy number was determined by evaluating the ratio of COX-II and 18S in neuronal cells after BPA exposure. C and D, neuronal cells were transfected with GFP-LC3 and pmKate mitochondrial resistance plasmid and were treated with rapamycin and BPA, and beclin siRNA. Scale bar, 10 μm. *, p < 0.05. We calculated the co-localization data with the Manders coefficient, by which we found the percentage of red co-localized with green (C). Control cells depict co-localization of pmKate mitochondrial reporter gene (red) with GFP-LC3 (Manders co-localization coefficient (M) = 0.05). BPA exposure enhanced the co-localization (M = 0.19), BPA + rapamycin (M = 0.28) and BPA treatment in the beclin knockdown culture results (M = 0.11). The data are represented as mean ± S.E. (error bars) (n = 3 independent experiments).
FIGURE 11.
FIGURE 11.
BPA enhances mitophagy by increasing the levels of PINK1 and PARKIN, PARK2 mitochondrial translocation, and AMPK activation. A–C, neuronal cells were exposed with BPA for 12 h, and the expression and levels of PINK and PARKIN were studied. D and E, neuronal cells were co-transfected with YFP-PARK2 and mito-CFP plasmids, along with PINK1 and beclin siRNA, followed by treatment with BPA. The data are represented as mean ± S.E. (error bars) (n = 3 independent experiments). Scale bar, 10 μm. *, p < 0.05. F, the levels of PARK2 were studied in total cell lysates and in mitochondrial and cytosolic fractions. BPA increased the levels of PARK2 in the mitochondrial fraction and decreased the levels in the cytosol. G and H, neuronal cells were co-transfected with GFP-LC3 plasmid and AMPK siRNA and were exposed with BPA for 12 h. TOMM20 immunocytochemical analysis was done along with GFP-LC3 to observe the number of damaged mitochondria undergoing mitophagy. Scale bar, 10 μm. I and J, knockdown of the expression of AMPK resulted in increased levels of TOMM20, p62, and COX-IV in neuronal cells, and decreased after BPA exposure.
FIGURE 12.
FIGURE 12.
Effects of time-dependent responses of BPA on autophagy, apoptosis, antioxidant levels in neuronal cells, and conditioned avoidance response in rats. A and B, neuronal cells were exposed with BPA at various time points from 3 to 72 h, and the levels of LC3-II, p62, LAMP-2, cleaved caspase-3, catalase, and SOD were determined by immunoblotting. C and D, to study the prolonged effects of BPA on the autophagic flux in the hippocampal neuronal cultures, neuronal cultures were exposed with BPA at 12, 24, and 48 h in the presence of bafilomycin. Relative protein levels were quantified after normalization with β-actin. The data are represented as mean ± S.E. (error bars) (n = 3 independent experiments). *, p < 0.05. E and F, rat pups were orally gavaged with BPA (40 μg/kg body weight) from PND 14 to 90 and/or intraperitoneal rapamycin (0.1 mg/kg body weight) during PND 21–90. Arrows, Fluoro-Jade B+ degenerating neuronal population in the hippocampus. Scale bar, 20 μm. Values are expressed as mean ± S.E. (n = 6 rats/group). *, p < 0.05 versus control. G, the cognitive ability (learning and memory) of the control-, BPA-, rapamycin-, and BPA + rapamycin-treated rats was measured following assessment of two-way conditioned avoidance behavior. Rapamycin significantly decreased BPA-induced learning and memory deficits.
FIGURE 13.
FIGURE 13.
Proposed schematic model for the role of autophagy against BPA-induced neurotoxicity in the hippocampus region through modulation of the AMPK and mTOR pathways. BPA-induced neurotoxicity may be alleviated by the generation of autophagy. BPA exposure resulted in increased oxidative stress, ROS generation, mitochondrial damage, ATP depletion, and apoptotic cell death. Autophagy was generated against BPA-induced neurotoxicity by the up-regulation of genes involved in the autophagy process and down-regulation of autophagic substrate p62 and the mTOR pathway. ATP depletion was alleviated by increased phosphorylation of AMPK, which further up-regulated phosphorylation levels of ACC and raptor to preserve the cellular energy pool. Pharmacological and genetic inhibition of autophagy by wortmannin, bafilomycin A1, and beclin and AMPK siRNA aggravated BPA-induced neurotoxicity. Pharmacological activator of autophagy (rapamycin) and mTOR siRNA ameliorated BPA-induced ROS generation and apoptotic cell death. Further, siRNA-mediated knockdown of mTOR ameliorated BPA-induced ROS generation and apoptotic cell death, suggesting that mTOR inhibition leads to activation of autophagy. Likewise, mitophagy was also enhanced against BPA-induced neurotoxicity to mitigate the accumulation of damaged mitochondria and to prevent oxidative stress. The mitochondrial translocation of PARK2 was enhanced after BPA exposure.

References

    1. Jain S., Kumar C. H., Suranagi U. D., Mediratta P. K. (2011) Protective effect of N-acetylcysteine on bisphenol A-induced cognitive dysfunction and oxidative stress in rats. Food Chem. Toxicol. 49, 1404–1409 - PubMed
    1. Itoh K., Yaoi T., Fushiki S. (2012) Bisphenol A, an endocrine-disrupting chemical, and brain development. Neuropathology 32, 447–457 - PubMed
    1. Le H. H., Carlson E. M., Chua J. P., Belcher S. M. (2008) Bisphenol A is released from polycarbonate drinking bottles and mimics the neurotoxic actions of estrogen in developing cerebellar neurons. Toxicol. Lett. 176, 149–156 - PMC - PubMed
    1. Ishido M., Masuo Y., Terasaki M., Morita M. (2011) Rat hyperactivity by bisphenol A, but not by its derivatives, 3-hydroxybisphenol A or bisphenol A 3,4-quinone. Toxicol. Lett. 206, 300–305 - PubMed
    1. Lee S., Kim Y. K., Shin T. Y., Kim S. H. (2013) Neurotoxic effects of bisphenol AF on calcium-induced ROS and MAPKs. Neurotox. Res. 23, 249–259 - PubMed

Publication types

MeSH terms

Substances

LinkOut - more resources