

Microglial phagocytosis of living photoreceptors contributes to inherited retinal degeneration
- PMID: 26139610
- PMCID: PMC4568951
- DOI: 10.15252/emmm.201505298
Microglial phagocytosis of living photoreceptors contributes to inherited retinal degeneration
Abstract
Retinitis pigmentosa, caused predominantly by mutations in photoreceptor genes, currently lacks comprehensive treatment. We discover that retinal microglia contribute non-cell autonomously to rod photoreceptor degeneration by primary phagocytosis of living rods. Using rd10 mice, we found that the initiation of rod degeneration is accompanied by early infiltration of microglia, upregulation of phagocytic molecules in microglia, and presentation of "eat-me" signals on mutated rods. On live-cell imaging, infiltrating microglia interact dynamically with photoreceptors via motile processes and engage in rapid phagocytic engulfment of non-apoptotic rods. Microglial contribution to rod demise is evidenced by morphological and functional amelioration of photoreceptor degeneration following genetic ablation of retinal microglia. Molecular inhibition of microglial phagocytosis using the vitronectin receptor antagonist cRGD also improved morphological and functional parameters of degeneration. Our findings highlight primary microglial phagocytosis as a contributing mechanism underlying cell death in retinitis pigmentosa and implicate microglia as a potential cellular target for therapy.
Keywords: apoptosis; microglia; phagocytosis; retinal degeneration; retinitis pigmentosa.
© 2015 The Authors. Published under the terms of the CC BY 4.0 license.
Figures
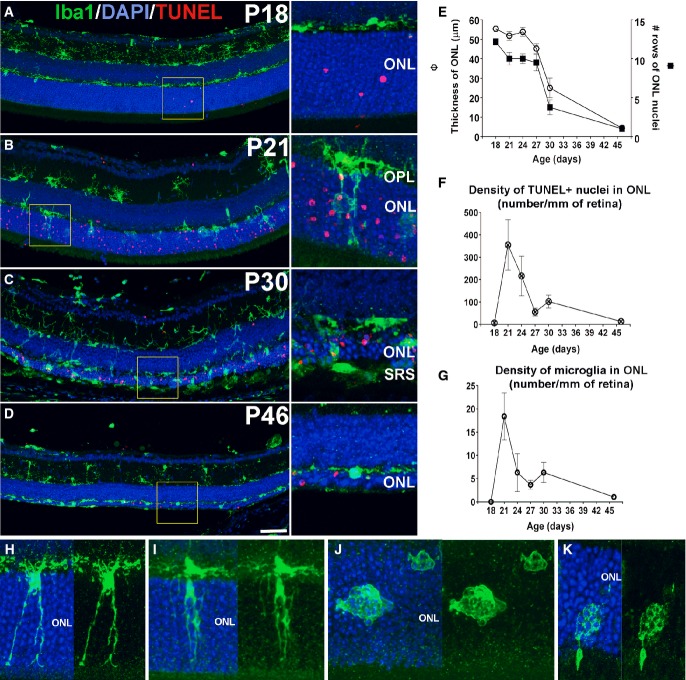
A–D Progression of microglial infiltration in the ONL. Early in the course of rod degeneration at P18, few isolated apoptotic TUNEL-positive nuclei (red, inset) were present in the ONL, with Iba1+ microglial somata and processes (green) confined to the inner retina (A). At P21, microglia in the outer plexiform layer (OPL) extended radial processes into the ONL (inset), with a concurrent increase in the number of TUNEL+ nuclei (B). At P30, retinal microglia infiltrated the entire depth of the markedly thinned ONL and the subretinal space (SRS) (inset) (C). At P46, microglia became less dense in the ONL and reverted to a more ramified morphology (D). Scale bar, 50 μm.
E–G Quantitative analyses demonstrate that ONL atrophy progression, characterized by ONL thickness (empty symbols) and number of rows of ONL nuclei (filled symbols) (E), occurred concurrently with the progression of ONL apoptosis, followed as the density of TUNEL+ nuclei in the ONL (F), and microglia infiltration, followed as microglial density in the ONL (G) (n = 3 animals at each time point). Data points and error bars indicate mean ± SEM.
H–K Higher magnification images showing microglial process infiltration (H), phagosome formation in infiltrating processes (I), and microglial transformation into amoeboid morphologies containing multiple phagosomes (J,K).

Microglia infiltrating the outer nuclear layer (ONL) of the rd10 retina during rod photoreceptor degeneration demonstrate markers of activation. At P18, Iba1+ microglia (green, arrow) in the outer plexiform layer were negative for TSPO (red), an activation marker. At P22, Iba1+ microglia (arrow) infiltrated the ONL and acquired TSPO immunopositivity, indicating their activated status. Scale bars, 25 μm.
Phosphatidylserine (PS) exposure in ONL nuclei of unfixed cryosections of rd10 retina during rod degeneration. PS exposure in the ONL was monitored in unfixed frozen sections using fluorescently conjugated annexin V which binds cell-surface PS. While minimal annexin V staining was evident in the ONL in P18 wild-type (top row) and P18 rd10 (middle row) retinas in which rod degeneration is absent, staining was prominent in P21 rd10 retina during rod degeneration (bottom row). Scale bar, 40 μm.
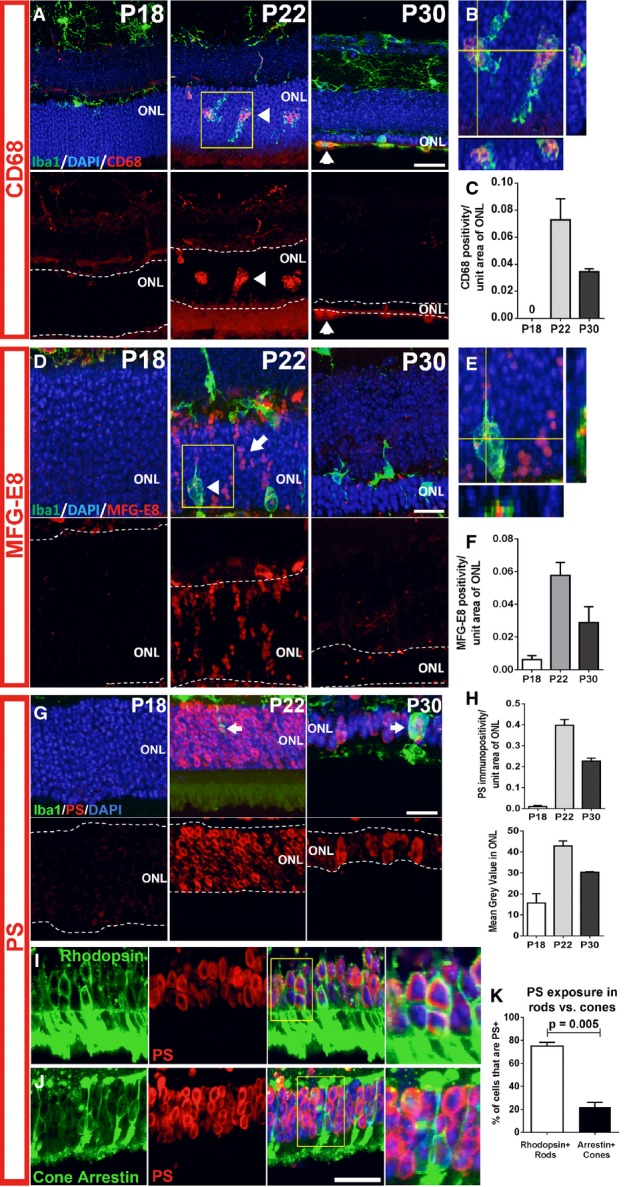
A–C Microglia infiltrating the ONL demonstrate upregulation of the phagocytic molecule, CD68. Top images in (A) show composites of CD68 (red), Iba1 (green), and DAPI (blue) staining; bottom images show the same field with CD68 staining only. At P18, non-infiltrating microglia expressed low or undetectable levels of CD68, a lysosome-associated membrane protein. At P21–23, microglia infiltrating the ONL strongly upregulated CD68 (arrowheads). At P30, CD68 immunopositivity in ONL microglia decreased and was mostly confined to amoeboid cells in the subretinal space. (B) Magnified view of inset in (A) demonstrates localization of CD68 to microglia phagosomes. (C) CD68 expression (area of immunopositivity as a fraction of the ONL) demonstrated a peaked at P22 and decreased by P30. Scale bar, 20 μm.
D–F Upregulation of MFG-E8, a secreted glycoprotein that serves as a bridging molecule for phagocytosis receptors, in the ONL. (D) MFG-E8 was low or absent in the ONL at P18, but emerged at P21–23, localizing to photoreceptor cell bodies in a column-like pattern (arrow) and as a punctate signal within infiltrating microglia (arrowhead), before decreasing throughout the ONL at P30. (E) A magnified orthogonal view of the inset from (D) demonstrating punctate MFG-E8 immunopositivity within ONL microglia. (F) Quantification of MFG-E8 expression demonstrated a prominent emergence at P22 and a subsequent decrement by P30. Scale bar, 20 μm.
G–K Increase in phosphatidylserine (PS) exposure in the ONL during photoreceptor degeneration. (G) At P18, PS immunopositivity is near absent in the ONL, but increased significantly in ONL somata at P21–23, before decreasing at P30. (H) Quantitation of PS exposure by image analysis (by fractional area of PS immunopositivity within the ONL (top), and the mean intensity of PS staining in the ONL (bottom)) demonstrated a transient increase at P22. (I) Co-immunolabeling of rods with rhodopsin at P22 demonstrates that PS exposure was present in a majority of rods (inset shows at high magnification the co-labeling of PS and rhodopsin in multiple rod somata). (J) Conversely, immunolabeling of cones with cone arrestin demonstrates the sparse co-localization of PS in cones (inset shows close juxtaposition but no colocalization of PS and arrestin labeling). (K) Scoring of rhodopsin+ rods and arrestin+ cones for PS co-labeling demonstrates that a large majority of rods, but only a small minority of cones, showed PS exposure (two-sided unpaired t-test, n = 3 animals at P22). Scale bars = 20 μm.
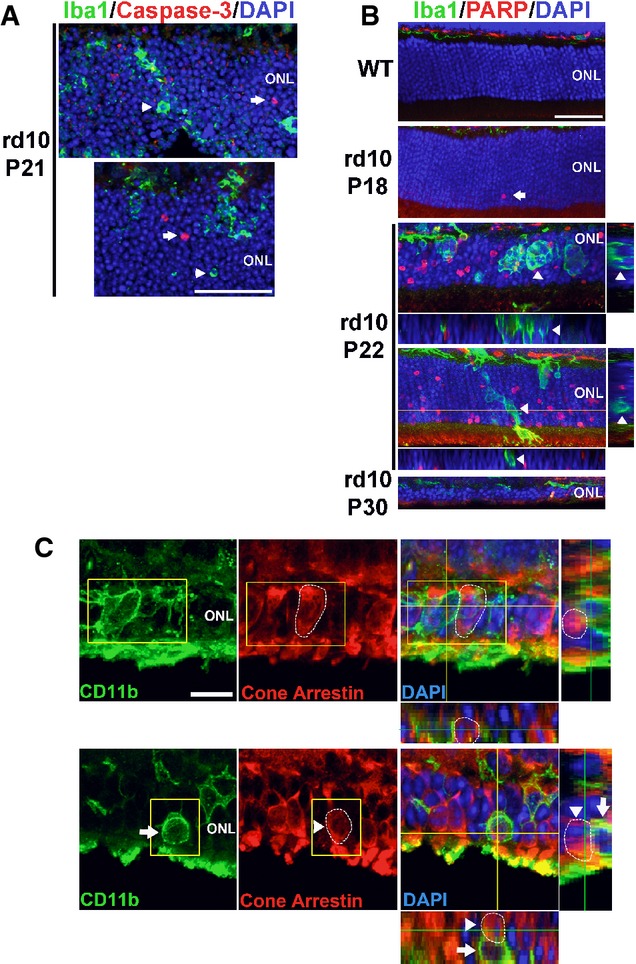
In P21 rd10 retina, ONL nuclei immunopositive for activated caspase-3 (red, arrows), an enzyme activated during early apoptosis, were found separately from phagocytized photoreceptor nuclei in microglial phagosomes (green, arrowheads). Scale bar, 40 μm.
Immunohistochemistry for cleaved poly(ADP-ribose) polymerase (PARP), a substrate of activated caspase-3, shows the absence of immunopositive ONL nuclei in adult wild-type (WT) mouse. In the rd10 retina, immunopositive ONL nuclei were rare at P18, prevalent at P22, and decreased at P30, as expected from the progression of rod degeneration. At P22, ONL nuclei phagocytosed by microglia (arrows in insets) are predominantly immunonegative for cleaved PARP (arrowheads in orthogonal views). Scale bar, 40 μm.
Photoreceptor cones are not phagocytosed by microglia during rod degeneration. (Upper panels) At P21–23, although infiltrating microglia in the ONL (CD11b, green) contain phagocytosed nuclei (DAPI, blue), none of these were found to be associated with cone arrestin immunopositivity (red), despite the close proximity of arrestin-positive cone somata (highlighted by circled area) to infiltrating microglia. (Lower panels) Example of a CD11b-positive microglial cell in the ONL juxtaposed closely to an arrestin-positive soma (highlighted by circled area). Analysis of orthogonal views of the confocal image stack demonstrates the absence of cone phagocytosis by microglia. Scale bar, 10 μm.

A–C Phagocytosis of rods by infiltrating microglia. (A) Representative example of a Iba1+ microglial process extending into the ONL with a phagosome at its terminal end. Each phagosome contained a photoreceptor nucleus (labeled with DAPI, arrow) that was identified as a rod photoreceptor by rhodopsin immunopositivity (superposition of Iba1+ phagosome with rhodopsin+ soma in orthogonal views). (B) Example of an amoeboid microglia in the ONL with multiple phagosomes containing both rhodopsin-positive (arrowhead) and rhodopsin-negative (arrow) nuclei. (C) Rhodopsin+ nuclei can be localized within CD68-positive phagosomes in infiltrating microglia, indicating phagocytic engulfment of rods. Scale bar, 10 μm.
D, E The peak of microglial phagocytic activity occurred around P21 and declined subsequently, as measured by the number of rods phagocytosed (D) and the number of photoreceptors phagocytosed per microglial cell (E) (n = 3 animals at each time point).
F–J Infiltrating microglia phagocytose TUNEL-negative rods in the ONL. (F) Although the peaks of TUNEL positivity and microglial phagocytosis occurred concurrently, the majority of rod photoreceptors undergoing microglial phagocytosis were non-apoptotic (arrows), while many apoptotic photoreceptors were not phagocytosed by microglia (arrowheads); representative example of a P21 retina demonstrates non-overlapping patterns of TUNEL positivity (red) and microglial phagocytosis (Iba1, green). (G) Confocal analysis of a representative amoeboid microglial cell demonstrates that while the photoreceptor nuclei in phagosomes were rhodopsin-positive (white), they were mostly TUNEL-negative. Only a small fraction of microglial phagosomes contained TUNEL+, rhodopsin+ rods (example shown in H). Scale bars, 20 μm. (I) Quantitative analysis of photoreceptor nuclei within microglial phagosomes according to rhodopsin (black symbols), and TUNEL labeling (red symbols) at different times during rod degeneration. (J) Quantitative analysis of all photoreceptors undergoing either apoptosis or phagocytosis at P21–23 demonstrates that TUNEL+ apoptotic photoreceptors and phagocytosed photoreceptors consist of two distinct populations, indicating separate but parallel mechanisms of rod degeneration. Quantitative analyses involved retinal sections from n = 3 animals at each age.

A–C Evidence of microglial phagocytosis of photoreceptors in other mouse models of RP. Histological analysis of a rd1 mouse retina (A) demonstrates microglial phagocytosis of photoreceptor nuclei in vibratome sections (left) and in flat-mounted retina (right). Phagocytosed nuclei were predominantly negative for TUNEL staining (arrows). Similar findings were found in the retinas of the rd16 mouse (loss-of-function mutation in the photoreceptor-expressed CEP290 gene, 1 month old) (B) and the RPGRIP-deficient mouse (6 months old) (C). Scale bar, 20 μm.
D–G Evidence of microglial phagocytosis of photoreceptors in other human histopathological specimens of RP. (D) Retinal section from a 30-year-old male donor with autosomal recessive RP (AR RP) showing extensive microglial infiltration of the ONL; expanded inset (right) shows multiple photoreceptor nuclei in phagosomes that were predominantly negative for TUNEL staining. (E, F) Retinal sections from two separate donors with autosomal dominant RP (AD RP1 = 68-year-old man, T17M rhodopsin mutation, AD RP1 = 50-year-old woman, Q-64-ter rhodopsin mutation) showing similar evidence of microglial phagocytosis. (G) Retinal section from a 46-year-old male donor with X-linked RP. Arrowheads indicate phagocytosed photoreceptor nuclei. Scale bars, 20 μm.

Infiltrating microglia established rapid and transient physical contacts with nearby photoreceptor somata (red and yellow circles) via their processes; these processes often terminated in a “cup”-like structure (arrow) that upon soma contact proceeded to extend across the entire soma (arrowhead, and red circle and *) to engulf it completely. The majority of microglia–photoreceptor contacts were transient with the microglial processes dynamically contacting and releasing photoreceptor somata in repetitive cycles (e.g. yellow circle and *) (period ≅10–15 min).
Example in which the engulfment of photoreceptor somata by microglial phagocytic cup was followed up by actual phagocytosis in which the engulfed cell (red *) is translocated intracellularly within the microglial cell toward the cell body. Phagocytosis of soma occurred simultaneously with “probing” of other somata by processes of the same microglial cell (yellow *).
Phagocytosis of photoreceptor somata occurred via flattened microglial lamellipodial microglial processes (arrow) that extended across somata (yellow *) to engulf them. Nuclei of phagocytosed photoreceptors within microglial phagosomes occasionally developed staining for propidium iodide (red arrow); these subsequently faded and disappeared over ≅10 min, possibly representing intraphagosomal breakdown.
Amoeboid infiltrating microglia lacking extended processes were also observed to phagocytose photoreceptors via phagocytic “cups” formed at their cell body (red *).
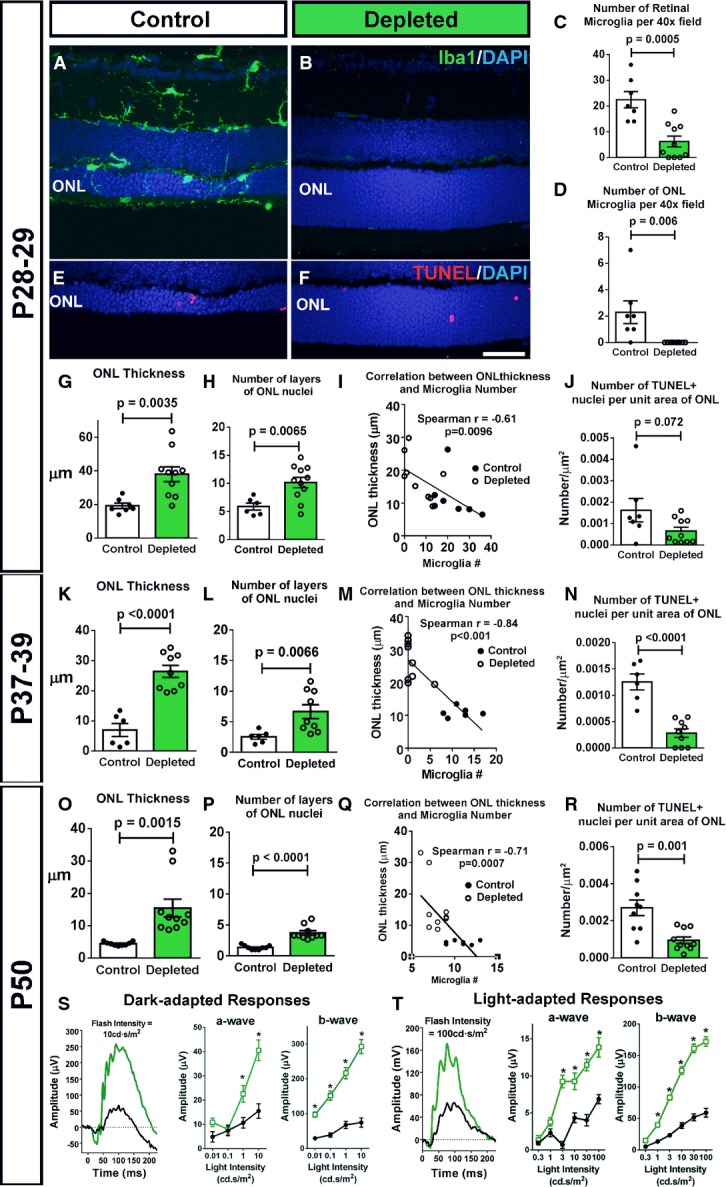
A–D Depletion of retinal microglia in the rd10 retina. Representative retinal section from a P28 control animal demonstrates Iba1+ microglia in the retina, including those infiltrating the ONL (A), while a tamoxifen-administered littermate (B) was substantially depleted of retinal microglia. Scale bar, 40 μm. Microglial cell counts in the entire retina (C) and in the ONL only (D) confirmed efficient depletion of infiltrating microglia following tamoxifen administration (n = 8 control and 11 depleted animals from four litters, two-sided unpaired t-test).
E–J Effect of microglial depletion on retinal degeneration at P28–29. ONL atrophy and thinning in control animals (E) was significantly more advanced relative to microglia-depleted littermates (F). Scale bar, 40 μm. Quantification of mean ONL thickness (G) and mean number of layers of ONL nuclei (H) at P28–29 demonstrate significantly greater ONL preservation in depleted retinas; the degree of ONL preservation correlated with the extent of microglia depletion (I). (J) The mean density of TUNEL+ nuclei in the ONL was not significantly decreased in depleted vs. control animals (n = 8 control and 11 depleted animals from four litters, two-sided unpaired t-test).
K–N Continuation of microglial depletion until P37–39 resulted in the persistence of morphological rescue (K–M), with a significant reduction in TUNEL+ nuclei density (N) (n = 6 control and nine depleted animals from two litters, two-sided unpaired t-test).
O–R Similar rescue effects as in (K–N) remained apparent when depletion was sustained until P50 (O–R), a time when rod degeneration in the rd10 model is relatively complete (n = 9 control and 10 depleted animals from three litters, two-sided unpaired t-test).
S, T Functional rescue of photoreceptors was evident following microglial depletion until P50 in significantly increased dark- (S) and light-adapted (T) responses in ERG testing in depleted animals (green lines) relative to control animals (black lines), in both a- and b-wave amplitudes across multiple flash intensities (n = 9 control and nine depleted animals, *P < 0.05 in one-way ANOVA with Sidak’s multiple comparison test).
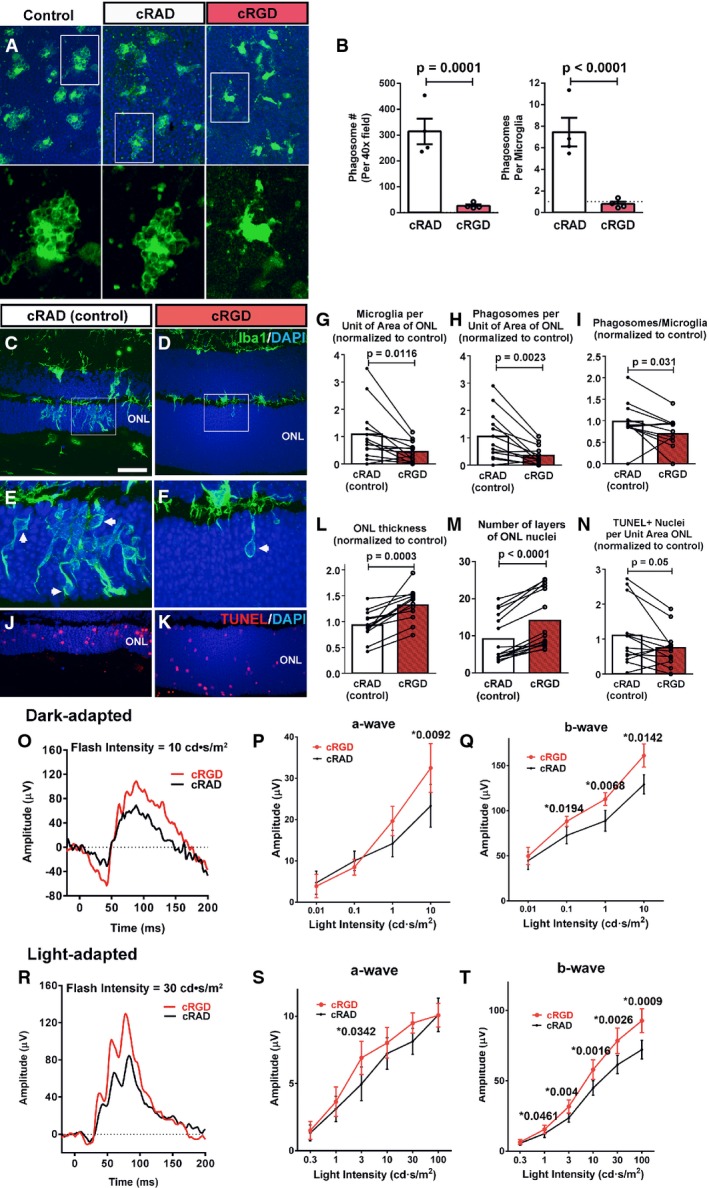
A, B Effect of phagocytosis inhibition on retinal microglia ex vivo. Retinal explants acutely isolated from P21–23 rd10/CX3CR1GFP/+ mice were incubated in Ringer’s solution (control), or Ringer’s solution containing either the vitronectin receptor inhibitor cRGD peptide or its inactive analog cRAD (400 μM) for 1 h. GFP-labeled (green) ONL microglia in explants in cRGD transitioned from amoeboid morphologies containing multiple phagosomes to more ramified morphologies with fewer phagosomes. No morphological changes were detected in microglia incubated in cRAD (insets show morphologies at higher magnification). Scale bar, 40 μm. Quantifications of total number of phagosomes per 40× field (left) and the mean number of phagosomes per microglia (right) demonstrate significant reductions in phagocytic activity of cRGC, relative to cRAD, exposure (n = 8 imaging fields from in each condition).
C–N Structural effects of in vivo inhibition of microglial phagocytosis. P20 rd10 mice were injected intravitreally in one eye with the phagocytosis inhibitor cRGD, and in the control contralateral eye with the inactive analogue, cRAD. At P23, prominent microglia infiltration in the ONL observed in control-injected eyes (C) was decreased in the contralateral cRGD-injected eyes (D). ONL microglia in control eyes demonstrated more numerous phagosomes (inset, arrows) (E) compared with cRGD-injected eyes (F). Pairwise comparisons of control- vs. cRGD-injected eyes demonstrated that phagocytosis inhibition significantly reduced the densities of infiltrating microglia (G) and microglial phagosomes (H), and mean phagosome number per microglia (I). ONL atrophy in control eyes (J) was more advanced compared to cRGD-injected eyes (K), with significantly greater mean ONL thickness (L), and ONL nuclear layers (M) in cRGD-injected eyes. Mean density of TUNEL+ ONL nuclei was lower, with marginal significance (N) (n = 13 animals; measurements in cRGD-injected eyes normalized to contralateral control eyes, two-sided paired t-test). Scale bar, 40 μm.
O–T Functional effects of in vivo inhibition of microglial phagocytosis. Representative dark-adapted ERG recordings at P26 (following intravitreal injections at P20 and P23) in a cRGD-injected eye (red) relative to the contralateral control eye (black) (O) showing that mean a- (P) and b-wave (Q) amplitudes were significantly greater in the cRGD-injected vs. control eyes at higher flash intensities. Representative light-adapted responses (R) illustrating that while mean light-adapted a-wave amplitudes (S) were slightly but not significantly greater in cRGD-injected eyes, mean b-wave amplitudes (T) were significantly greater at higher flash intensities (n = 13 animals, two-sided paired t-test, *P < 0.05, with exact values alongside).
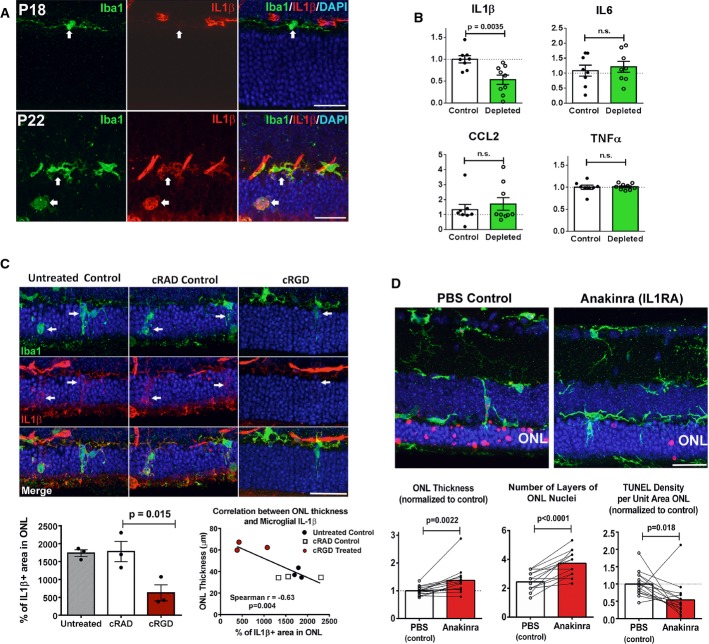
Microglia infiltrating the rd10 retina upregulate IL-1β expression during degeneration. Iba1+ microglia (green) were immunonegative for IL-1β (red) at P18 but become prominently IL-1β immunopositive at P22 (arrows). Scale bars, 25 μm.
Depletion of infiltrating microglia in the rd10 retina decreases IL-1β levels. Cytokine levels in rd10/CreDTA mouse retinas were assayed following tamoxifen-induced microglial depletion (from P21 to P37–50, green bars; n = 9 animals) and compared with their untreated littermate controls (white bars, n = 8 animals; values normalized to control animals in the same litter). IL-1β protein levels were significantly lowered following microglial depletion, but IL-6, CCL2, or TNFα were not significantly changed.
Inhibition of microglial phagocytosis results in decreased microglial IL-1β expression. Eyes of rd10 animals were treated with intravitreal injections of cRGD at P20, and analyzed at P23 by immunohistochemistry for Iba1 (green) and IL-1β (red), and compared to uninjected eyes and with eyes injected with inactive analog, cRAD (n = 3 eyes in each category). Immunopositivity was high in infiltrating microglia (indicated by arrows) for untreated and cRAD-injected control eyes and significantly reduced in microglia in cRGD-injected eyes (upper panel), as demonstrated by the quantification of IL-1β expression (area of immunopositivity as a fraction of the ONL) (lower left panel). ONL thickness correlated negatively with the extent of IL-1β immunopositivity (lower right panel). Scale bar, 25 μm.
IL-1R signaling during rod degeneration was inhibited by intravitreal injections of recombinant IL-1 receptor antagonist, anakinra (from P20–22 to P26–27) in one eye of each rd10 animal, while the contralateral eye was injected with PBS as a control. Upper panels show representative retinal sections from control PBS-injected and IL-1RA-injected eyes from the same animal. ONL atrophy in control eyes was more advanced compared to IL-1RA-injected eyes, with greater mean ONL thickness and lower mean density of TUNEL+ ONL nuclei in IL-1RA-injected eyes (lower panels) (n = 15 animals; measurements in IL-1RA-injected eyes normalized to contralateral control eyes, paired t-test). Scale bar, 25 μm.
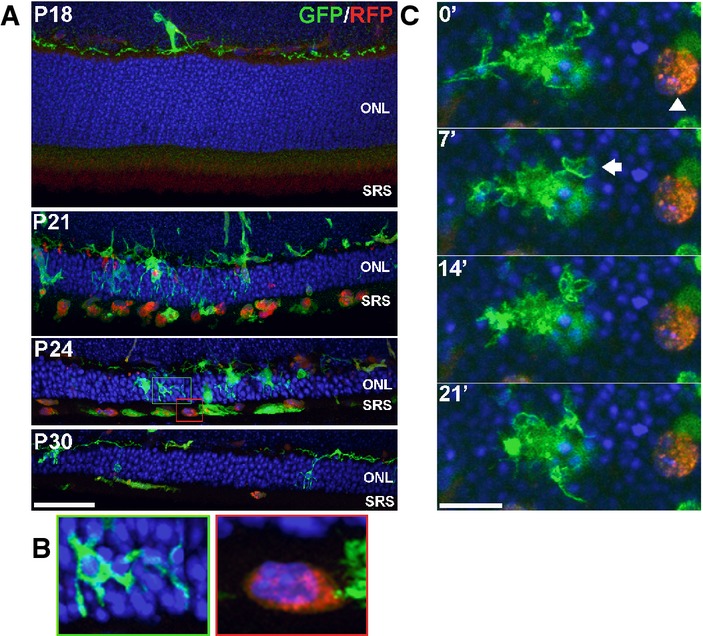
Retinas from transgenic CX3CR1+/GFP, CCR2+/RFP mice crossed into the rd10 background were examined at time points before and during rod degeneration. At P18, prior to degeneration, the outer nuclear layer (ONL) and subretinal space (SRS) were relatively devoid of infiltrating cells. At P21, numerous GFP+, RFP− retinal microglia infiltrate the ONL and engulf photoreceptors. Concurrently, a number of RFP+ monocytes with rounded morphologies appeared predominantly in the SRS, with only a few cells within the ONL. At P24 and P30, RFP+ monocytes remained concentrated in the SRS and declined in number with time. Scale bar, 40 μm.
Morphological features of GFP+, RFP− retinal microglia and RFP+ monocytes differ significantly from each other. Infiltrating microglia (from green inset from P24 in A) demonstrated multiple processes contacting and engulfing photoreceptors in phagosomes, while RFP+ monocytes (red inset) lacked processes, had limited contact with photoreceptors, and lacked evidence of intracellular phagosomes.
Dynamic behavior also differed significantly between the two cell types as observed in a P24 retina explant by live confocal imaging: a GFP+, RFP− retinal microglial cell (left) demonstrated typical dynamic process movement and engulfment (arrow), while RFP+ monocytes (arrowhead) were relatively stationary and lacked dynamic process behavior. Scale bar, 10 μm.

References
-
- Aumailley M, Gurrath M, Muller G, Calvete J, Timpl R, Kessler H. Arg-Gly-Asp constrained within cyclic pentapeptides. Strong and selective inhibitors of cell adhesion to vitronectin and laminin fragment P1. FEBS Lett. 1991;291:50–54. - PubMed
-
- Borrajo A, Rodriguez-Perez AI, Villar-Cheda B, Guerra MJ, Labandeira-Garcia JL. Inhibition of the microglial response is essential for the neuroprotective effects of Rho-kinase inhibitors on MPTP-induced dopaminergic cell death. Neuropharmacology. 2014;85:1–8. - PubMed
-
- Brown GC, Neher JJ. Eaten alive! Cell death by primary phagocytosis: ‘phagoptosis’. Trends Biochem Sci. 2012;37:325–332. - PubMed
-
- Brown GC, Neher JJ. Microglial phagocytosis of live neurons. Nat Rev Neurosci. 2014;15:209–216. - PubMed
Publication types
MeSH terms
Substances
Grants and funding
LinkOut - more resources
Full Text Sources
Other Literature Sources
Molecular Biology Databases
