. 2015 May 28;7(1):49.
doi: 10.1186/s13073-015-0169-8. eCollection 2015.

A bioinformatic framework for immune repertoire diversity profiling enables detection of immunological status

Affiliations

A bioinformatic framework for immune repertoire diversity profiling enables detection of immunological status

Victor Greiff et al. Genome Med. .

Abstract

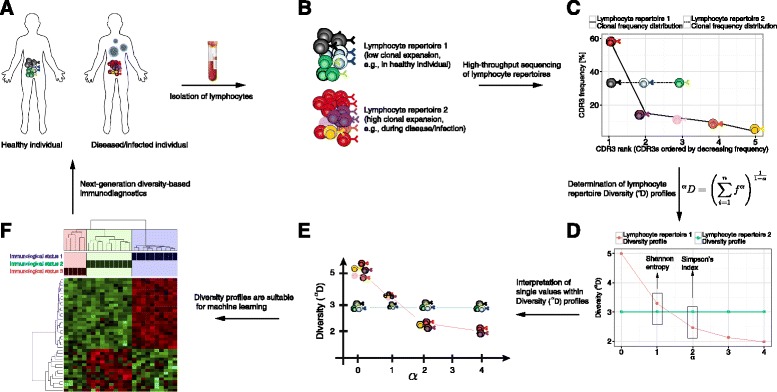
Background: Lymphocyte receptor repertoires are continually shaped throughout the lifetime of an individual in response to environmental and pathogenic exposure. Thus, they may serve as a fingerprint of an individual's ongoing immunological status (e.g., healthy, infected, vaccinated), with far-reaching implications for immunodiagnostics applications. The advent of high-throughput immune repertoire sequencing now enables the interrogation of immune repertoire diversity in an unprecedented and quantitative manner. However, steadily increasing sequencing depth has revealed that immune repertoires vary greatly among individuals in their composition; correspondingly, it has been reported that there are few shared sequences indicative of immunological status ('public clones'). Disconcertingly, this means that the wealth of information gained from repertoire sequencing remains largely unused for determining the current status of immune responses, thereby hampering the implementation of immune-repertoire-based diagnostics.

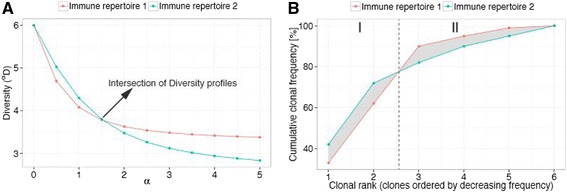
Methods: Here, we introduce a bioinformatics repertoire-profiling framework that possesses the advantage of capturing the diversity and distribution of entire immune repertoires, as opposed to singular public clones. The framework relies on Hill-based diversity profiles composed of a continuum of single diversity indices, which enable the quantification of the extent of immunological information contained in immune repertoires.

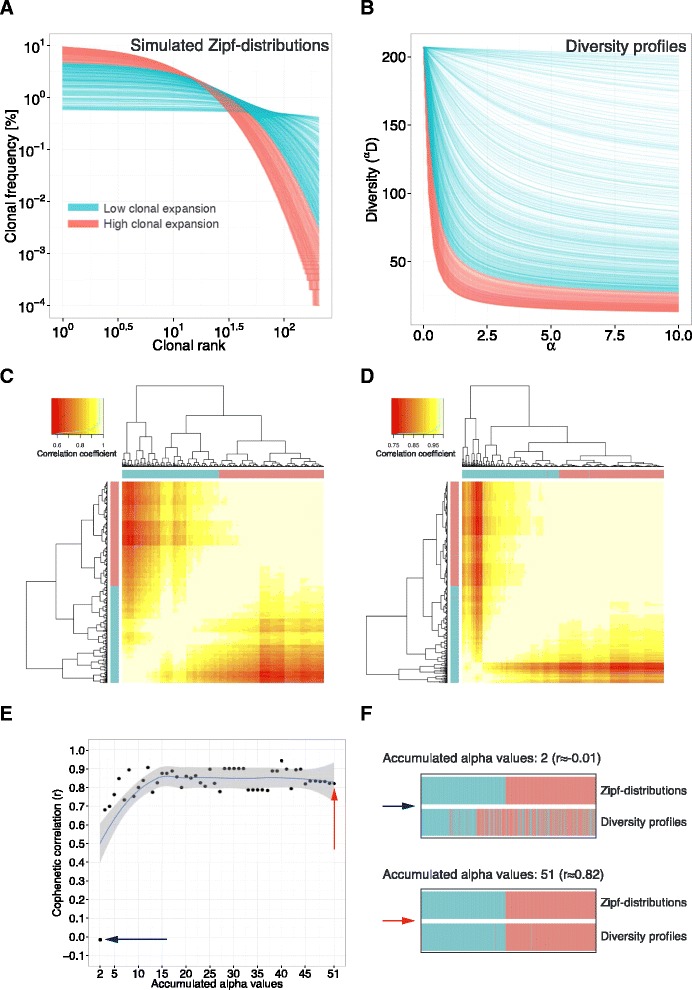
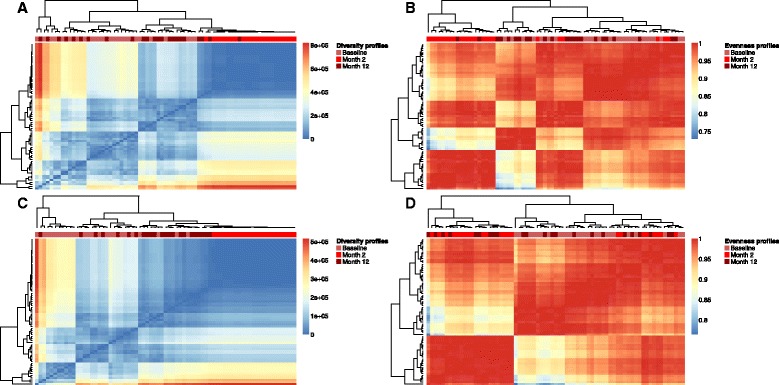
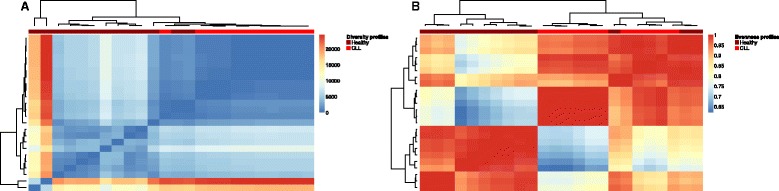
Results: We coupled diversity profiles with unsupervised (hierarchical clustering) and supervised (support vector machine and feature selection) machine learning approaches in order to correlate patients' immunological statuses with their B- and T-cell repertoire data. We could predict with high accuracy (greater than or equal to 80 %) a wide range of immunological statuses such as healthy, transplantation recipient, and lymphoid cancer, suggesting as a proof of principle that diversity profiling can recover a large amount of immunodiagnostic fingerprints from immune repertoire data. Our framework is highly scalable as it easily allowed for the analysis of 1000 simulated immune repertoires; this exceeds the size of published immune repertoire datasets by one to two orders of magnitude.

Conclusions: Our framework offers the possibility to advance immune-repertoire-based fingerprinting, which may in the future enable a systems immunogenomics approach for vaccine profiling and the accurate and early detection of disease and infection.


Figures

Fig. 1
Fig. 1
Rendering HTS repertoire data suitable for machine learning-based immunodiagnostics. a The clonal distribution and diversity of lymphocyte repertoires may represent a fingerprint of an individual’s current immunological status (e.g., healthy, vaccinated, diseased/infected). b Lymphocyte repertoire 1 represents a uniform repertoire (e.g., resembling that of a healthy individual) as opposed to lymphocyte repertoire 2, which shows a large clonal expansion (few clones dominate the repertoire, e.g., as a result of disease/infection or vaccination). Each color describes one lymphocyte clone (usually defined by the CDR3). c The immediate output of HTS datasets are immune repertoire clonal frequency distributions, which are composed of the frequency of each clone (where frequency is the proportion of the sequencing reads bearing the same clonal identifier [e.g., CDR3 amino acid sequence]). These distributions differ in clonal composition even in inbred mice [9, 15] (Additional file 4); this renders the application of machine learning approaches highly problematic (f) as they require identical composition. d Diversity (αD, derived from the Rényi entropy) alleviates the problem of incomparable datasets by projecting clonal frequency distributions onto the same (reduced) alpha space. Shannon diversity (alpha = 1) and Simpson’s index (alpha = 2) are widely used for diversity comparisons but, depending on the dataset structure, show qualitatively inconsistent Diversity values (Additional file 2). e The Diversity value αD for each alpha signifies an equivalent repertoire in which all clones are equally abundant. These equivalent repertoires represent different portions of the original repertoires, with only the top clones remaining as alpha tends towards infinity. f Diversity profiles (vectors of alpha values) are of identical (alpha-)composition and are therefore suitable for cross-repertoire comparisons by machine learning approaches allowing for their potential application in next-generation immunodiagnostics
Fig. 2
Fig. 2
Diversity profile intersection predicts differential sub-repertoire clonal expansion. a Intersecting Diversity (α D) profiles of two immune repertoires with different clonal frequency distributions are shown (immune repertoire 1 with clonal frequencies of 33 %, 29 %, 28 %, 5 %, 4 %, 1 %; immune repertoire 2 with clonal frequencies of 42 %, 30 %, 10 %, 8 %, 5 %, 5 %). b Intersection of frequency-ordered cumulative frequency distributions of immune repertoires shown in (a). The Diversity (α D) function is Schur-concave, which predicts intersection of cumulative frequency curves if intersection in the profile space has occurred. Since cumulative frequency curves were derived from frequency-ordered clonal frequency distributions, the exact delineation of differentially expanded sub-repertoires becomes possible. Here, until clonal rank 2 immune repertoire 2 is higher clonally expanded (area I) whereas the opposite is true from clonal rank 3 onward (area II). The grey-shaded area indicates the clonal expansion difference between the two immune repertoires. Since the difference in clonal expansion is expressed in percent, the determination of relative oligo-/polyclonality with respect to a given region of the immune repertoires becomes possible
Fig. 3
Fig. 3
Diversity profiles recover the underlying frequency distribution to a large extent. a Simulation of 1000 clonal frequency (Zipf) distributions of varying degree of clonal expansion (Zipf-alpha = 0.1, Zipf-B ∈ [0.001, 0.1]), but equal clonal composition. Distributions were colored by extent of clonal expansion (blue, low clonal expansion; red, high clonal expansion). b Diversity profiles of Zipf-distributions (a) were plotted for alpha values ranging from 0 to 10. Diversity profiles were colored by the respective Zipf-distribution. c Zipf-distributions (a) were hierarchically clustered based on Pearson correlation distance in order to only take into account the shape of the distributions. Hierarchical clustering was visualized using heatmaps, in which each tile represents the Pearson correlation coefficient between any two distributions. Row and column color (blue, red) bars indicate the respective degree of clonal expansion of each distribution as shown in (a). d Diversity profiles of Zipf-distributions (a) were hierarchically clustered based on Pearson correlation distance in order to only take into account relative clonal expansion differences. e The cophenetic correlation of the dendrograms of Zipf-distributions (c) and of Diversity profiles (d) was determined as a function of a growing [accumulating] number of alpha-values used — the number of alpha values was varied between 2 and 51 within an alpha range of 0 to 10 (step size of 0.2). The cophenetic correlation (r) between dendrograms of frequency distributions and Diversity profiles increases with increasing number of alpha values used reaching r ≈ 0.94 for 40 and r ≈ 0.82 for 51 alpha values used. f Color bars as used in heatmaps in (c) and (d) are shown to visualize the correspondence of clustering of Zipf distributions and Diversity profiles for the two extreme cases of the number of alpha values used: 2 (blue arrow) and 51 (red arrow)
Fig. 4
Fig. 4
Diversity and Evenness profiles resolve stages of hematopoietic stem cell transplantation. a–d Hierarchical clustering was performed based on Euclidean distance for Diversity profiles and correlation-based distance for Evenness profiles of dataset 1 and visualized using heatmaps. The heatmaps depict the pairwise distances/Pearson correlation coefficients of all profiles determined (see Methods for further details). Both for CD4 and CD8 T-cell repertoires, Diversity (a, c) and Evenness (b, d) profiles from 'Month 2' (blue) after transplantation cluster together as do profiles of 'Baseline' measurements (green) and 'Month 12' (red) after transplantation (red color bar). Of note, for CD8 datasets, Diversity profiles cluster almost perfectly by each of the three statuses (Baseline, Month 2, Month 12). Diversity and Evenness profiles were calculated in a range of alpha = 0 to alpha = 10 with a step size of 0.2. Sample numbers: 24 per immunological status and T-cell population
Fig. 5
Fig. 5
Diversity and Evenness profiles separate healthy from cancer-afflicted individuals. a, b Analogously to Fig. 4, Diversity (a) and Evenness (b) profiles of dataset 2 were hierarchically clustered. Diversity and Evenness profiles separate healthy and CLL-afflicted individuals well (red color bar). Diversity and Evenness profiles were calculated in a range of alpha = 0 to alpha = 10 with a step size of 0.2. Sample numbers: healthy, 13; CLL, 11

References

    1. Robins H. Immunosequencing: applications of immune repertoire deep sequencing. Curr Opin Immunol. 2013;25:646–52. doi: 10.1016/j.coi.2013.09.017. - DOI - PubMed
    1. Abbas AK, Lichtman A. Cellular and molecular immunology. 5. Philadelphia: Saunders; 2005.
    1. Calis JJA, Rosenberg BR. Characterizing immune repertoires by high throughput sequencing: strategies and applications. Trends Immunol. 2015;24:112–20. - PMC - PubMed
    1. Galson JD, Pollard AJ, Trück J, Kelly DF. Studying the antibody repertoire after vaccination: practical applications. Trends Immunol. 2014;35:319–31. doi: 10.1016/j.it.2014.04.005. - DOI - PubMed
    1. Georgiou G, Ippolito GC, Beausang J, Busse CE, Wardemann H, Quake SR. The promise and challenge of high-throughput sequencing of the antibody repertoire. Nat Biotechnol. 2014;32:156–68. doi: 10.1038/nbt.2782. - DOI - PMC - PubMed