. 2015 Jul 2;97(1):139-52.
doi: 10.1016/j.ajhg.2015.05.016.

Disentangling the Effects of Colocalizing Genomic Annotations to Functionally Prioritize Non-coding Variants within Complex-Trait Loci

Affiliations

Disentangling the Effects of Colocalizing Genomic Annotations to Functionally Prioritize Non-coding Variants within Complex-Trait Loci

Gosia Trynka et al. Am J Hum Genet. .

Abstract

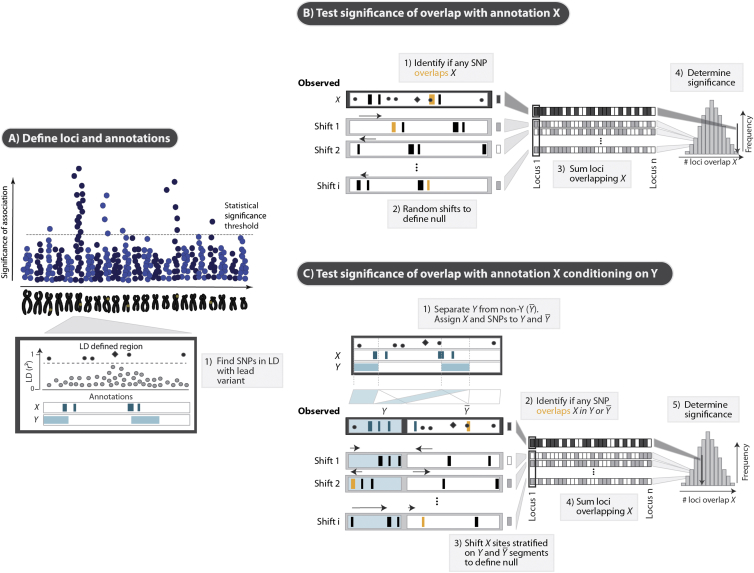
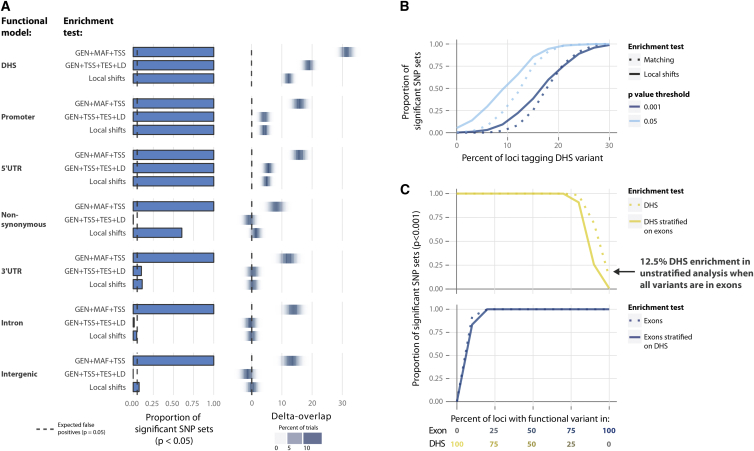
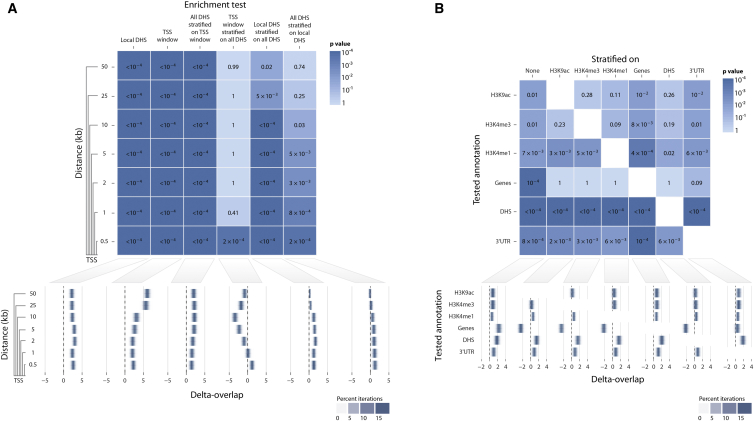
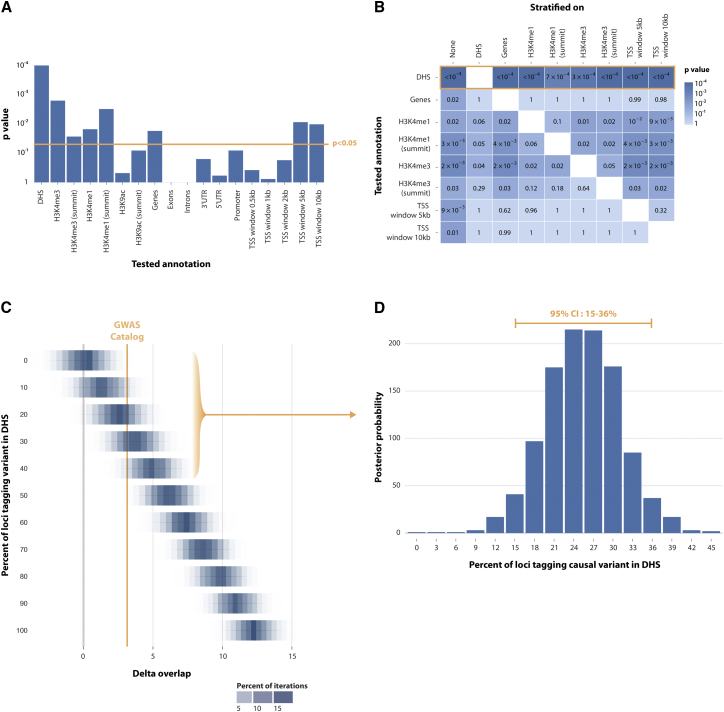
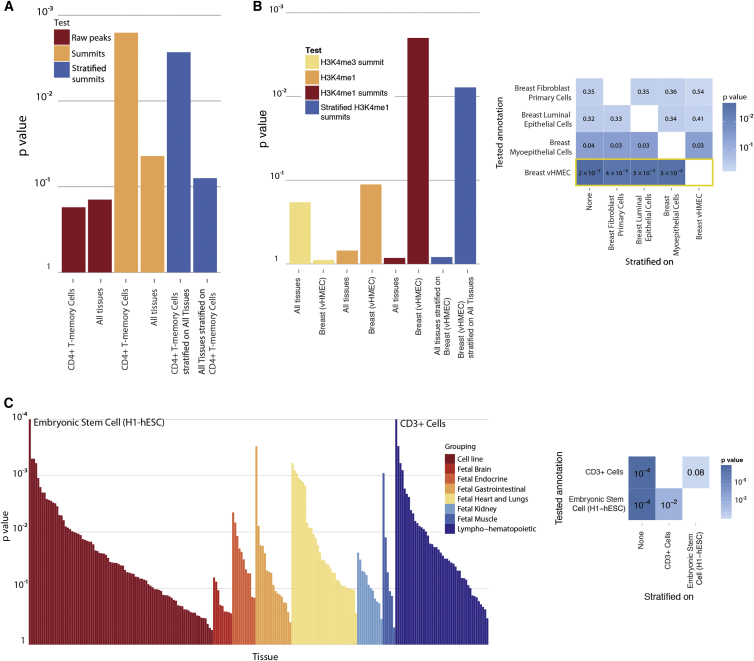
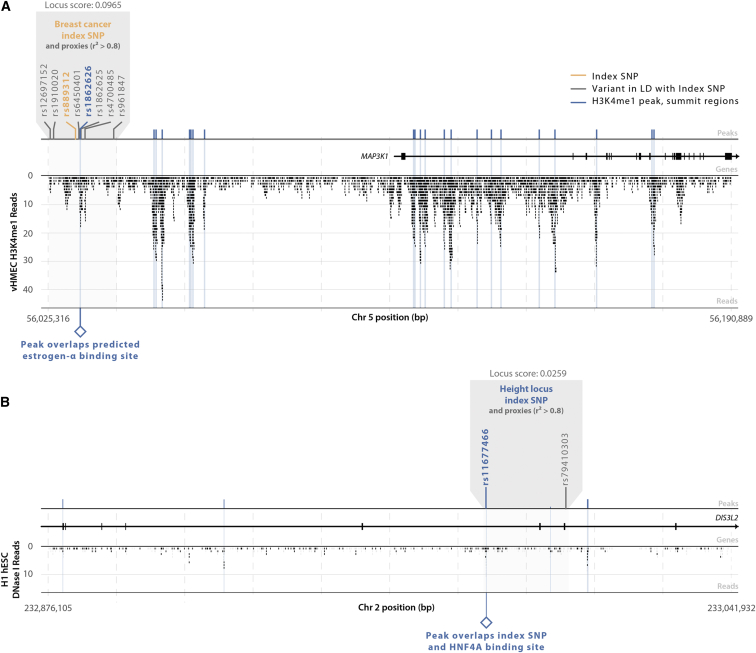
Identifying genomic annotations that differentiate causal from trait-associated variants is essential to fine mapping disease loci. Although many studies have identified non-coding functional annotations that overlap disease-associated variants, these annotations often colocalize, complicating the ability to use these annotations for fine mapping causal variation. We developed a statistical approach (Genomic Annotation Shifter [GoShifter]) to assess whether enriched annotations are able to prioritize causal variation. GoShifter defines the null distribution of an annotation overlapping an allele by locally shifting annotations; this approach is less sensitive to biases arising from local genomic structure than commonly used enrichment methods that depend on SNP matching. Local shifting also allows GoShifter to identify independent causal effects from colocalizing annotations. Using GoShifter, we confirmed that variants in expression quantitative trail loci drive gene-expression changes though DNase-I hypersensitive sites (DHSs) near transcription start sites and independently through 3' UTR regulation. We also showed that (1) 15%-36% of trait-associated loci map to DHSs independently of other annotations; (2) loci associated with breast cancer and rheumatoid arthritis harbor potentially causal variants near the summits of histone marks rather than full peak bodies; (3) variants associated with height are highly enriched in embryonic stem cell DHSs; and (4) we can effectively prioritize causal variation at specific loci.


Figures

Figure 1
Figure 1
Schematic of the GoShifter Method (A) To assess the statistical significance of an overlap between trait-associated SNPs and an annotation X, we start by using 1000 Genomes Project data to identify variants in LD (r2 > 0.8) with each index SNP. (B) We quantify the observed overlap: the proportion of loci where at least one linked SNP overlaps annotation X (shaded boxes). We estimate the significance of the observed overlap by comparing to a null distribution generated by random shifting of X sites (black arrows) within each locus. After each shift, we calculate the proportion of loci overlapping the annotation. To ensure that the same number of shifted annotations remains within locus boundaries, we circularize each region. (C) To determine the significance of an overlap with annotation X independent of a possibly colocalizing annotation Y, we partition each locus into two types of fragments: those regions mapped by Y sites (light blue blocks) and those that lack them (denoted as Y¯; white blocks). We join the respective Y and Y¯ fragments into two independent continuous segments. To generate the null distribution, we shift annotation X separately within each of the two segments. For each iteration, we count the proportion of loci where any of the linked SNPs overlaps annotation X in either Y or Y¯ segments to determine the significance of the observed overlap.
Figure 2
Figure 2
Comparison of Statistics between GoShifter and Matching-Based Tests (A) We compared the performance of GoShifter with that of matching-based tests by using different parameters—(1) GEN, MAF, and TSS proximity and (2) GEN, LD, TSS proximity, and TES proximity—to match SNPs on. We generated sets of 1,416 SNPs tagging SNPs overlapping different genomic annotations; some SNP sets tagging SNPs in specific annotations (e.g., DHSs, promoter regions, 5′ UTRs, and nonsynonymous variants in exons) were enriched in DHSs, whereas others (e.g., 3′ UTRs, introns, and intergenic regions) were depleted in DHSs. For each functional model, we generated 1,000 sets of SNPs that we subsequently tested for enrichment in DHSs (left). The number of expected false positives at p < 0.05 is indicated by the dotted line. On the right, we plot the delta-overlap, which is the difference between the proportions of SNPs overlapping an annotation in the actual data and the proportion of SNPs overlapping an annotation in the null distribution. (B) We generated sets of 1,416 SNPs with variable proportions of variants within DHSs (increments of 5% and 1,000 sets per increment). We compared the power to detect significant enrichment in DHSs for each increment (i.e., the proportion of significant SNP sets) between GoShifter and the best-performing matching-based strategy (GEN, LD, TSS proximity, and TES proximity) for two significance levels (p < 0.05 and p < 0.001). (C) To test the performance of GoShifter, we generated sets of 1,416 SNPs with varying proportions of variants in either exons or DHSs (with increments of 5% in either annotation and 1,000 sets per increment). We then used GoShifter to analyze the enrichment (at p < 0.001) in DHSs stratified on exons (upper panel) and vice versa (lower panel).
Figure 3
Figure 3
eQTL Variants Localize to DHSs near TSSs (A) To test the performance of GoShifter on real data, we analyzed the enrichment of 6,380 eQTLs with local DHSs at various distances (varying between 0.5 and 50 kb) to the TSS by using 10,000 random shifts. The p values for each analysis are in the top panel, and the delta-overlap measures are in the bottom panel (a higher value denotes a higher proportion of significant loci than in the null distribution). (B) We tested enrichment of these eQTLs in various other regulatory marks (H3K9ac, H3K4me3 H3K4me1, and DHSs) associated with active transcription (10,000 random shifts) and overlap with genes and 3′ UTRs. We tested each annotation in an unstratified analysis, and we also tested for enrichment stratifying on each of the other annotations. When we tested for gene-transcript enrichment by stratifying on regulatory annotations, negative delta-overlap values indicated that eQTL SNPs were primarily captured by the regulatory annotations and depleted in gene transcripts (except for 3′ UTRs).
Figure 4
Figure 4
Quantifying the Proportion of Causal GWAS Catalog Variants Derived from DHSs (A) We assessed the enrichment of 1,416 independent GWAS Catalog SNPs in various genomic annotations by using GoShifter with 10,000 local shifts. We observed strong enrichment of DHSs (p < 10−4) and nominal enrichment (p < 0.05, yellow line) of H3K4me3, H3K4me1, genes, and distance to the TSS (5 and 10 kb). (B) We performed pairwise stratified analysis for significantly enriched annotations. DHSs showed a strong residual enrichment (p < 7 × 10−4) after stratification on each of the other annotations. (C) We generated sets of 1,416 SNPs overlapping an increasing proportion of DHSs (5% increments and 1,000 sets per increment) and determined the delta-overlap per set, yielding a delta-overlap distribution per DHS-overlap increment. We then determined the delta-overlap for the real GWAS Catalog to be 3.17 (dotted line), which corresponds to 15%–36% of loci with causal variants within DHSs (D) within the 95% confidence interval.
Figure 5
Figure 5
Enrichment Results for Three Selected Sets of Trait-Associated SNPs (A) We examined the enrichment of 88 RA-associated variants with H3K4me3 in CD4+ T memory cells and in an aggregate of 118 different cell types and tissues. We assessed raw peaks (peak bodies) and summit regions (±100 bp from the summit). We observed a nominally significant enrichment in the aggregate of cell types and tissues (p = 0.044) and a pronounced enrichment within CD4+ T memory cells (p = 1.6 × 10−3). Stratified analysis indicated that the enrichment signal was driven by CD4+ T memory cells: the significance of the cell-type-aggregate enrichment decreased (p = 0.08) when we stratified on CD4+ T cells, but not vice versa (p = 2.7 × 10−3). (B) We assessed the enrichment of 69 breast-cancer-associated variants with various histone marks (H3K4me3 and H3K4me1) in the 118 tissues and cell types. Breast-cancer-associated SNPs were highly enriched (p = 2 × 10−3) in summit regions of H3K4me1 peaks in vHMECs (left panel), but not in other cells, H3K4me3 summit regions (p > 0.4), or H3K4me1 peak bodies. The stratified enrichment analysis indicated that the enrichment of H3K4me1 summit regions in vHMECs was independent of the H3K4me1 summit regions in the aggregated cell types and tissues. The H3K4me1 enrichment in vHMECs within summit regions was maintained when we stratified on summit regions from other breast tissues and cell types (p < 3.6 × 10−3; right panel). (C) Similarly, we assessed enrichment of 697 SNPs associated with height in DHSs from 217 different tissues. The height-associated SNPs showed the highest enrichment of DHSs in embryonic stem cells (p < 10−4) and CD3+ cells (p < 10−4) from cord blood (left panel). However, the CD3+ cell DHS enrichment diminished after stratification on embryonic stem cells (p = 0.08), whereas embryonic stem cells retained significance after stratification on CD3+ cells (p = 9.6 × 10−3; right panel).
Figure 6
Figure 6
Locus Plots Showing the Peaks, Variants, and Reads in Two Trait-Associated Loci (A) The SNP rs889312 defines the locus with the best overlap score among breast cancer SNP associations. This SNP is in LD (r2 > 0.8) with a variant (rs1862626) that overlaps the summit region of an H3K4me1 peak. This peak overlaps a predicted ER-α binding site. The associated locus is located upstream of potential oncogene MAP3K1. (B) Of the height-associated SNPs, rs11677466 defines the locus with the best overlap score and is located in an exon of DIS3L2 (MIM: 614184). This SNP overlaps a DHS peak, which also overlaps a known HNF4α binding site.

Similar articles

Cited by

  • Limited statistical evidence for shared genetic effects of eQTLs and autoimmune-disease-associated loci in three major immune-cell types.
    Chun S, Casparino A, Patsopoulos NA, Croteau-Chonka DC, Raby BA, De Jager PL, Sunyaev SR, Cotsapas C. Chun S, et al. Nat Genet. 2017 Apr;49(4):600-605. doi: 10.1038/ng.3795. Epub 2017 Feb 20. Nat Genet. 2017. PMID: 28218759 Free PMC article.
  • Combining artificial intelligence: deep learning with Hi-C data to predict the functional effects of non-coding variants.
    Meng XH, Xiao HM, Deng HW. Meng XH, et al. Bioinformatics. 2021 Jun 16;37(10):1339-1344. doi: 10.1093/bioinformatics/btaa970. Bioinformatics. 2021. PMID: 33196774 Free PMC article.
  • Genetic predisposition to mosaic Y chromosome loss in blood.
    Thompson DJ, Genovese G, Halvardson J, Ulirsch JC, Wright DJ, Terao C, Davidsson OB, Day FR, Sulem P, Jiang Y, Danielsson M, Davies H, Dennis J, Dunlop MG, Easton DF, Fisher VA, Zink F, Houlston RS, Ingelsson M, Kar S, Kerrison ND, Kinnersley B, Kristjansson RP, Law PJ, Li R, Loveday C, Mattisson J, McCarroll SA, Murakami Y, Murray A, Olszewski P, Rychlicka-Buniowska E, Scott RA, Thorsteinsdottir U, Tomlinson I, Moghadam BT, Turnbull C, Wareham NJ, Gudbjartsson DF; International Lung Cancer Consortium (INTEGRAL-ILCCO); Breast Cancer Association Consortium; Consortium of Investigators of Modifiers of BRCA1/2; Endometrial Cancer Association Consortium; Ovarian Cancer Association Consortium; Prostate Cancer Association Group to Investigate Cancer Associated Alterations in the Genome (PRACTICAL) Consortium; Kidney Cancer GWAS Meta-Analysis Project; eQTLGen Consortium; Biobank-based Integrative Omics Study (BIOS) Consortium; 23andMe Research Team; Kamatani Y, Hoffmann ER, Jackson SP, Stefansson K, Auton A, Ong KK, Machiela MJ, Loh PR, Dumanski JP, Chanock SJ, Forsberg LA, Perry JRB. Thompson DJ, et al. Nature. 2019 Nov;575(7784):652-657. doi: 10.1038/s41586-019-1765-3. Epub 2019 Nov 20. Nature. 2019. PMID: 31748747 Free PMC article.
  • Fine-mapping, trans-ancestral and genomic analyses identify causal variants, cells, genes and drug targets for type 1 diabetes.
    Robertson CC, Inshaw JRJ, Onengut-Gumuscu S, Chen WM, Santa Cruz DF, Yang H, Cutler AJ, Crouch DJM, Farber E, Bridges SL Jr, Edberg JC, Kimberly RP, Buckner JH, Deloukas P, Divers J, Dabelea D, Lawrence JM, Marcovina S, Shah AS, Greenbaum CJ, Atkinson MA, Gregersen PK, Oksenberg JR, Pociot F, Rewers MJ, Steck AK, Dunger DB; Type 1 Diabetes Genetics Consortium; Wicker LS, Concannon P, Todd JA, Rich SS. Robertson CC, et al. Nat Genet. 2021 Jul;53(7):962-971. doi: 10.1038/s41588-021-00880-5. Epub 2021 Jun 14. Nat Genet. 2021. PMID: 34127860 Free PMC article.
  • Tropomyosin 1 genetically constrains in vitro hematopoiesis.
    Thom CS, Jobaliya CD, Lorenz K, Maguire JA, Gagne A, Gadue P, French DL, Voight BF. Thom CS, et al. BMC Biol. 2020 May 14;18(1):52. doi: 10.1186/s12915-020-00783-7. BMC Biol. 2020. PMID: 32408895 Free PMC article.

References

    1. Trynka G., Sandor C., Han B., Xu H., Stranger B.E., Liu X.S., Raychaudhuri S. Chromatin marks identify critical cell types for fine mapping complex trait variants. Nat. Genet. 2013;45:124–130. - PMC - PubMed
    1. Maurano M.T., Humbert R., Rynes E., Thurman R.E., Haugen E., Wang H., Reynolds A.P., Sandstrom R., Qu H., Brody J. Systematic localization of common disease-associated variation in regulatory DNA. Science. 2012;337:1190–1195. - PMC - PubMed
    1. Adrianto I., Wen F., Templeton A., Wiley G., King J.B., Lessard C.J., Bates J.S., Hu Y., Kelly J.A., Kaufman K.M., BIOLUPUS and GENLES Networks Association of a functional variant downstream of TNFAIP3 with systemic lupus erythematosus. Nat. Genet. 2011;43:253–258. - PMC - PubMed
    1. Musunuru K., Strong A., Frank-Kamenetsky M., Lee N.E., Ahfeldt T., Sachs K.V., Li X., Li H., Kuperwasser N., Ruda V.M. From noncoding variant to phenotype via SORT1 at the 1p13 cholesterol locus. Nature. 2010;466:714–719. - PMC - PubMed
    1. Cowper-Sal lari R., Zhang X., Wright J.B., Bailey S.D., Cole M.D., Eeckhoute J., Moore J.H., Lupien M. Breast cancer risk-associated SNPs modulate the affinity of chromatin for FOXA1 and alter gene expression. Nat. Genet. 2012;44:1191–1198. - PMC - PubMed

Publication types

MeSH terms