. 2015 Sep;45(9):2542-52.
doi: 10.1002/eji.201545591. Epub 2015 Jul 28.

Fonsecaea pedrosoi-induced Th17-cell differentiation in mice is fostered by Dectin-2 and suppressed by Mincle recognition

Affiliations

Fonsecaea pedrosoi-induced Th17-cell differentiation in mice is fostered by Dectin-2 and suppressed by Mincle recognition

Marcel Wüthrich et al. Eur J Immunol. 2015 Sep.

Abstract

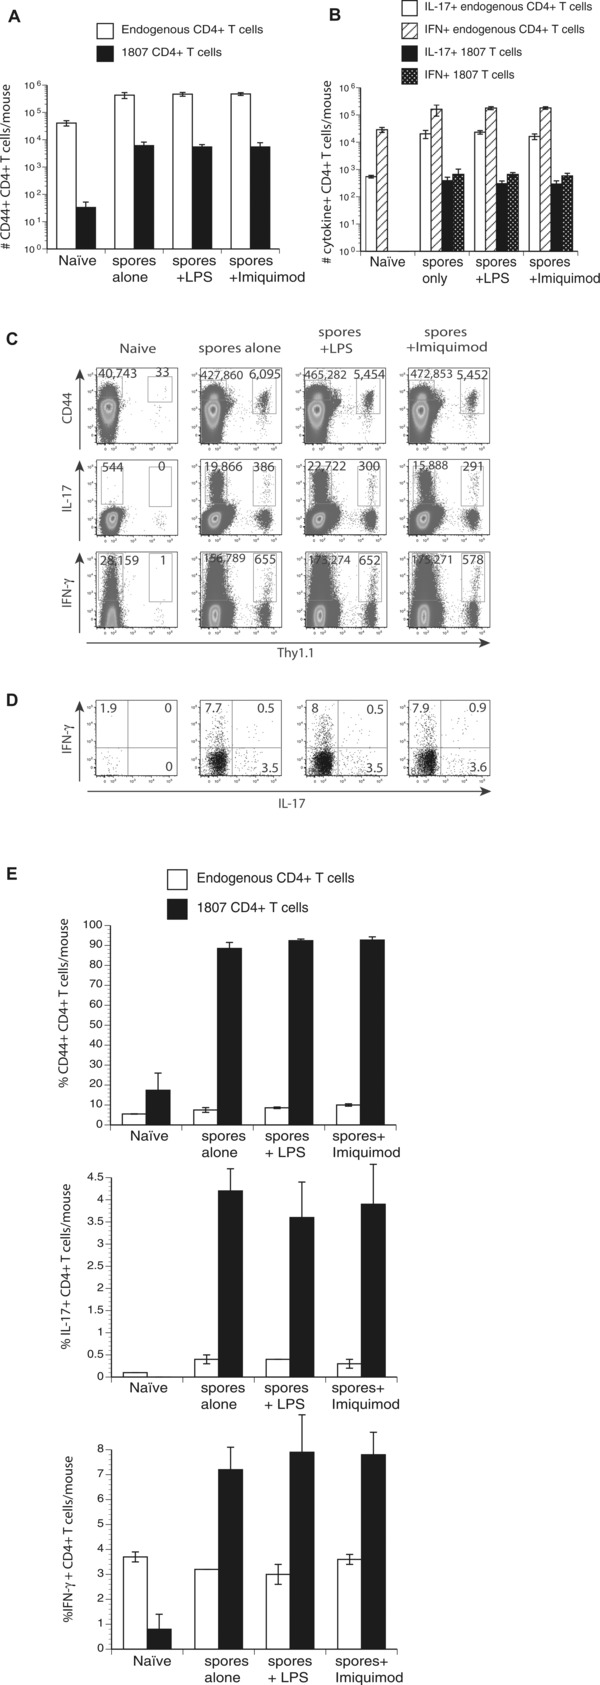
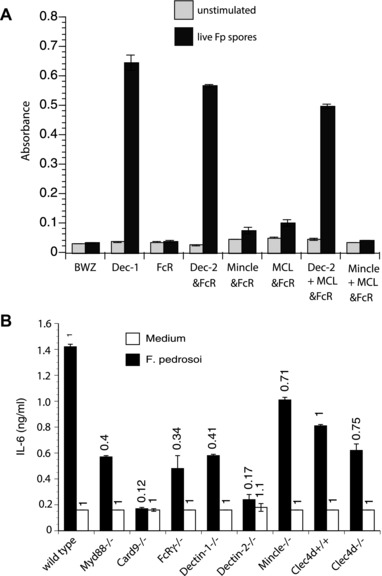
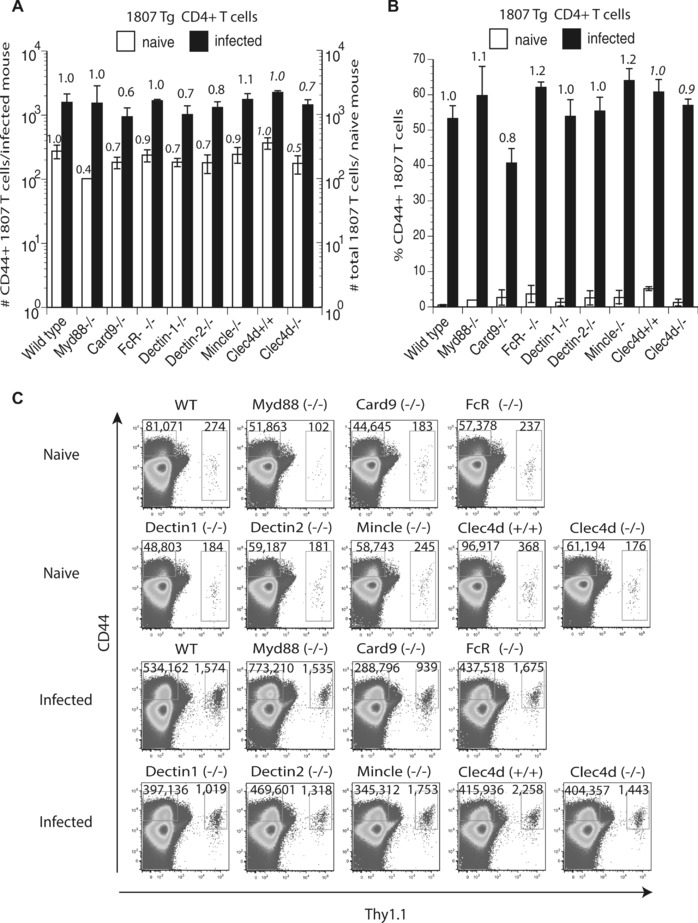
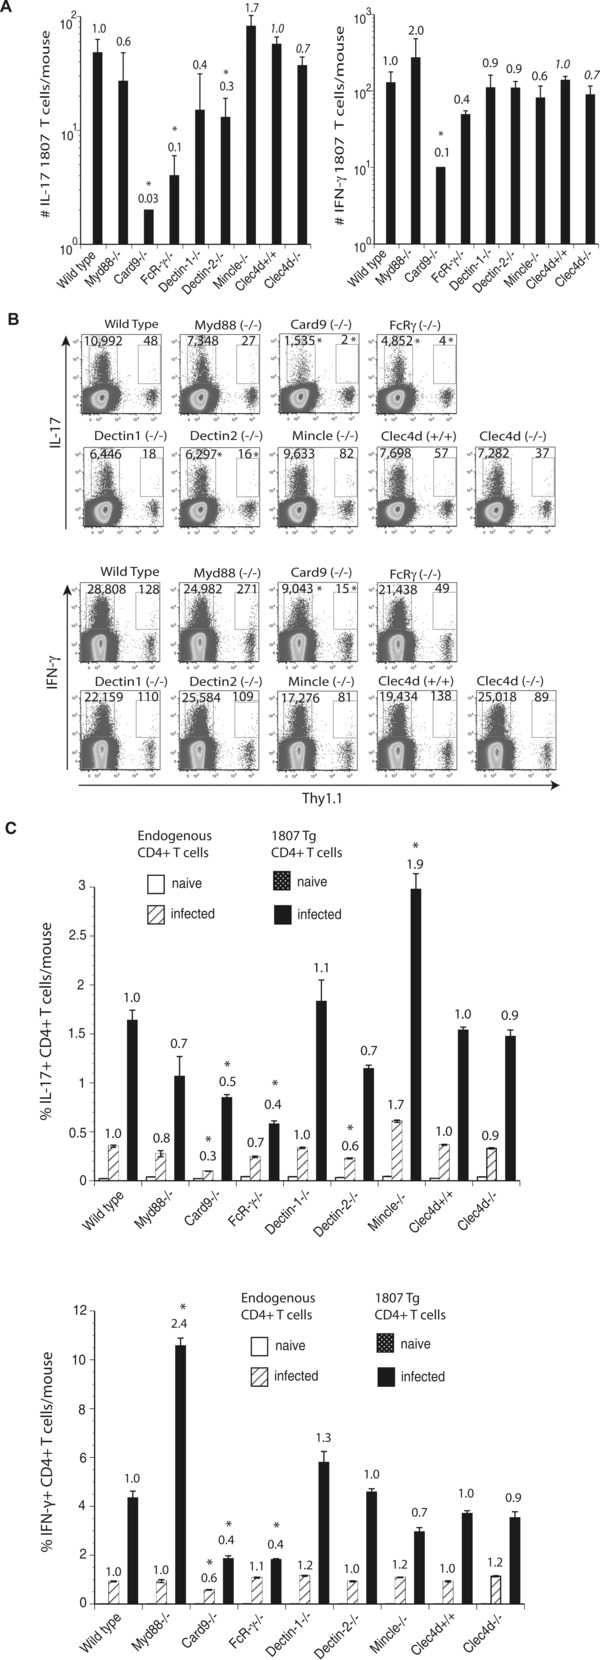
Chromoblastomycosis is a chronic skin infection caused by the pigmented saprophytic mould Fonsecaea pedrosoi. Chronicity of infection can be broken by a coordinated innate recognition of the spores by pattern recognition receptors. While Mincle signaling via the Syk/Card9 pathway is required for fungal recognition by host cells, it is not sufficient for host control. Exogenously applied TLR agonists are necessary to promote the induction of proinflammatory cytokines and clearance of infection in vivo. Here, we investigated whether costimulation by TLR agonists fosters the development of adaptive immune responses, by examining the development of fungus-specific T cells. Subcutaneous infection of mice with F. pedrosoi spores induced the activation, expansion, and differentiation of Ag-specific CD4(+) T cells but TLR costimulation did not further augment these T-cell responses. The Dectin-2/FcRγ/Card9 signaling pathway promoted the differentiation of fungus-specific CD4(+) T cells into Th17 cells, whereas Mincle inhibited the development of this T-helper subset in infected mice. These results indicate differential roles for Dectin-2 and Mincle in the generation of adaptive immune responses to F. pedrosoi infection.

Keywords: C-type lectin; Chromoblastomycosis; Dectin-2; Fungi; Mincle; T-cell differentiation; Th17 cell.


Figures

Figure 1
Figure 1
TLR costimulation does not augment T‐cell activation, expansion, and differentiation. Wild‐type C57BL6 mice received an adoptive transfer of 105 CD4+ purified, naïve 1807 Tg cells and were infected with 2 × 10⁶ live F. pedrosoi spores or not. Transferred 1807 and endogenous CD4+ T cells were harvested from the popliteal LN and the (A) number and (E) frequencies of activated (CD44+), and (B) number of IL‐17‐ and IFN‐γ‐producing T cells was assessed at day 7 postinjection by flow cytometry. (C) Dot plots show concatenated samples of 4–6 mice/group. The numbers indicate the mean ± SEM of activated (CD44hi) and cytokine producing 1807 Tg (Thy1.1+) cells and endogenous CD4+ T cells. (D and E) The frequencies of cytokine‐producing 1807 cells were assessed by flow cytometry. Data are expressed as the mean ± SEM (n = 4–6 mice/group). T‐cell numbers from LPS or Imiquimod‐treated, infected mice versus nontreated infected mice were not statistically different using the Wilcoxon rank test for nonparametric data. Data are from single experiments representative of three independent experiments.
Figure 2
Figure 2
F. pedrosoi spores trigger Dectin‐1 and Dectin‐2 signaling and IL‐6 production. (A) BWZ cells and a subline expressing Dectin‐1‐CD3ζ (Dectin‐1), as well as B3Z cells expressing Dectin‐2, Mincle, FcRγ chain, Dectin‐2 + FcRγ, MCL + FcRγ, Dectin‐2 + MCL + FcRγ, Mincle + FcRγ or Mincle + MCL + FcRγ were stimulated with live F. pedrosoi spores. After 18 h, lacZ activity was measured using a colorimetric assay and expressed as OD 560/620 values. Data are expressed as the mean ± SD of duplicate wells. Data are from single experiments representative of three independent experiments. (B) Bone marrow derived dendritic cells (BMDC) were cocultured with live F. pedrosoi spores for 24 h and IL‐6 was detected in the supernatants by ELISA. Numbers above histogram bars indicate the n‐fold change versus the corresponding wild‐type control. Data are from a single experiment representative of two independent experiments.
Figure 3
Figure 3
T‐cell activation and expansion is modestly regulated by Dectin‐1, Dectin‐2, MCL, and Card9. Wild type, Myd88−/−, Card9−/−, FcRγ−/−, Dectin‐1−/−, Dectin‐2−/−, Mincle−/−, and Clec4d+/+ and Clec4d−/− mice adoptively received 105 CD4+ purified, naïve 1807 Tg cells and were infected with 2 × 10⁶ live F. pedrosoi spores or not. At day 7 postinfection, the popliteal lymph nodes were harvested and the (A) number and (B) frequency of activated (CD44+) transferred 1807 (Thy1.1+) and endogenous CD4+ T cells was enumerated by flow cytometry. (A, B) The values over the bars in the histogram indicated the n‐fold change in T‐cell numbers versus the corresponding wild‐type control mice. (C) The dot plots show the sum of concatenated events from five mice per group and the values indicate the mean of endogenous and 1807 CD4+ T cells. Data are expressed as mean + SD of five mice per group from a single experiment representative of two independent experiments. The number and frequency of activated (CD44+) T cells was not statistically significant between infected knockout mice versus wild‐type controls using the Wilcoxon rank test for nonparametric data.
Figure 4
Figure 4
F. pedrosoi‐induced T‐cell differentiation requires Dectin‐2, but is suppressed by Mincle. Wild type, Myd88−/−, Card9−/−, FcRγ−/−, Dectin‐1−/−, Dectin‐2−/−, Mincle−/−, and Clec4d+/+ and Clec4d−/− mice adoptively received 105 CD4+ purified, naïve 1807 Tg cells and were infected with 2 × 10⁶ live F. pedrosoi spores or not. At day 7 postinfection, the popliteal lymph nodes were harvested and (A, B) the number and (C) frequencies of (A) IL‐17‐ and (B) IFN‐γ‐producing T cells enumerated by flow cytometry. The values over the bars in the histogram indicated the n‐fold change in T‐cell numbers versus the corresponding wild‐type control mice. The dot plots show the sum of concatenated events from five mice per group and the numbers indicate the mean of endogenous and 1807 CD4+ T cells. Data are expressed as mean + SD of five mice per group from a single experiment representative of two independent experiments. *p < 0.05 versus infected wild‐type controls using the Wilcoxon rank test for nonparametric data.

References

    1. Queiroz‐Telles, F. , Esterre, P. , Perez‐Blanco, M. , Vitale, R. G. , Salgado, C. G. and Bonifaz, A. , Chromoblastomycosis: an overview of clinical manifestations, diagnosis and treatment. Med. Mycol. 2009. 47: 3–15. - PubMed
    1. Ameen, M. , Chromoblastomycosis: clinical presentation and management. Clin. Exp. Dermatol. 2009. 34: 849–854. - PubMed
    1. Santos, A. L. , Palmeira, V. F. , Rozental, S. , Kneipp, L. F. , Nimrichter, L. , Alviano, D. S. , Rodrigues, M. L. and Alviano, C. S. , Biology and pathogenesis of Fonsecaea pedrosoi, the major etiologic agent of chromoblastomycosis. FEMS Microbiol. Rev. 2007. 31: 570–591. - PubMed
    1. Brandt, M. E. and Warnock, D. W. , Epidemiology, clinical manifestations, and therapy of infections caused by dematiaceous fungi. J. Chemother. 2003. 15 (Suppl 2): 36–47. - PubMed
    1. Ricard‐Blum, S. , Hartmann, D. J. and Esterre, P. , Monitoring of extracellular matrix metabolism and cross‐linking in tissue, serum and urine of patients with chromoblastomycosis, a chronic skin fibrosis. Eur. J. Clin. Invest. 1998. 28: 748–754. - PubMed

Publication types

MeSH terms