

Prevalence and Risk Factors of Hypertension in Urban Areas of Cameroon: A Nationwide Population-Based Cross-Sectional Study
- PMID: 26140673
- PMCID: PMC8031538
- DOI: 10.1111/jch.12604
Prevalence and Risk Factors of Hypertension in Urban Areas of Cameroon: A Nationwide Population-Based Cross-Sectional Study
Abstract
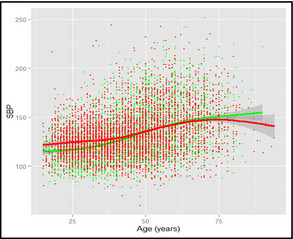
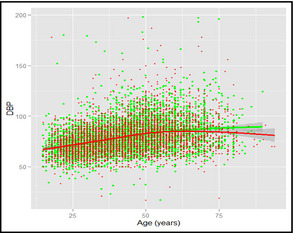
Accurate estimates of the prevalence rate of hypertension and determinants in Cameroon are crucial to inform efficient prevention and control policies. The authors carried out a cluster-specific cross-sectional survey in urban areas of the 10 regions of Cameroon to assess the prevalence and risk factors of hypertension in Cameroonian adults using the WHO STEPwise approach to Surveillance (STEPS). Sociodemographic data were collected and blood pressure and glycemia were measured using standardized methods. Participants were adults of both sexes aged 16 years or older. A total of 15,470 participants were surveyed. The age-standardized prevalence rate of hypertension was 29.7%. The awareness rate was 14.1%. Independent correlates of hypertension included higher age, male sex, obesity, hyperglycemia, and living in the Savannah zone. The prevalence of hypertension is high in urban areas of Cameroon, with very low awareness. Prevention and control strategies should emphasize on improvement and vulgarization of population opportunistic screening and education.
© 2015 Wiley Periodicals, Inc.
Figures
References
-
- Narayan KV, Ali MK, Koplan JP. Global non communicable diseases‐where worlds meet. N Engl J Med. 2010;363:1196–1198. - PubMed
-
- World Health Organization . A global brief on hypertension. WHO/DCO/WHD/2013.2. http://apps.who.int/iris/bitstream/10665/79059/1/WHO_DCO_WHD_2013.2_eng.pdf Accessed June 2, 2015.
Publication types
MeSH terms
Substances
LinkOut - more resources
Full Text Sources
Medical
