. 2015 Jul 4;16(1):209.
doi: 10.1186/s12859-015-0605-1.

Topological characterization of neuronal arbor morphology via sequence representation: II--global alignment

Affiliations

Topological characterization of neuronal arbor morphology via sequence representation: II--global alignment

Todd A Gillette et al. BMC Bioinformatics. .

Abstract

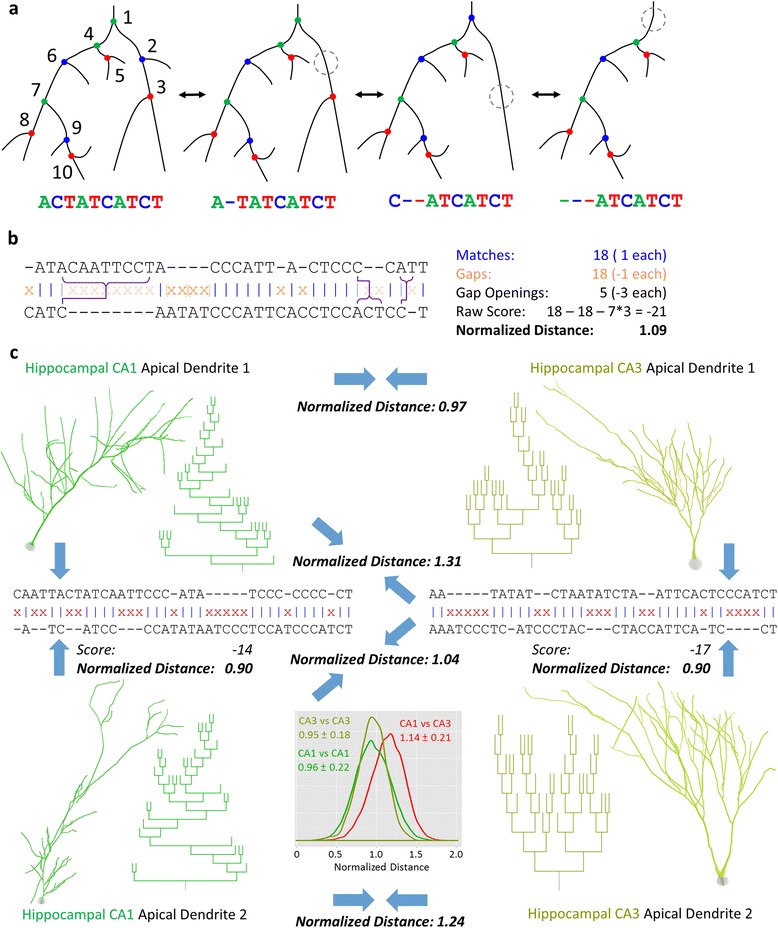
Background: The increasing abundance of neuromorphological data provides both the opportunity and the challenge to compare massive numbers of neurons from a wide diversity of sources efficiently and effectively. We implemented a modified global alignment algorithm representing axonal and dendritic bifurcations as strings of characters. Sequence alignment quantifies neuronal similarity by identifying branch-level correspondences between trees.

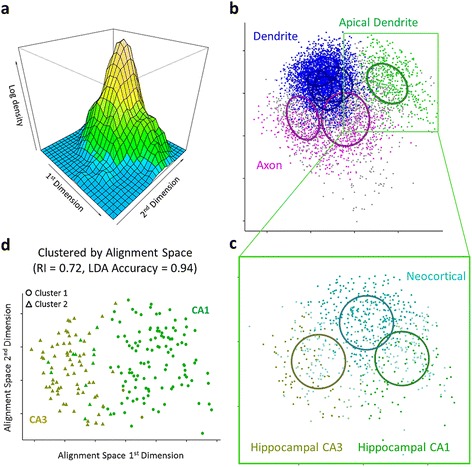
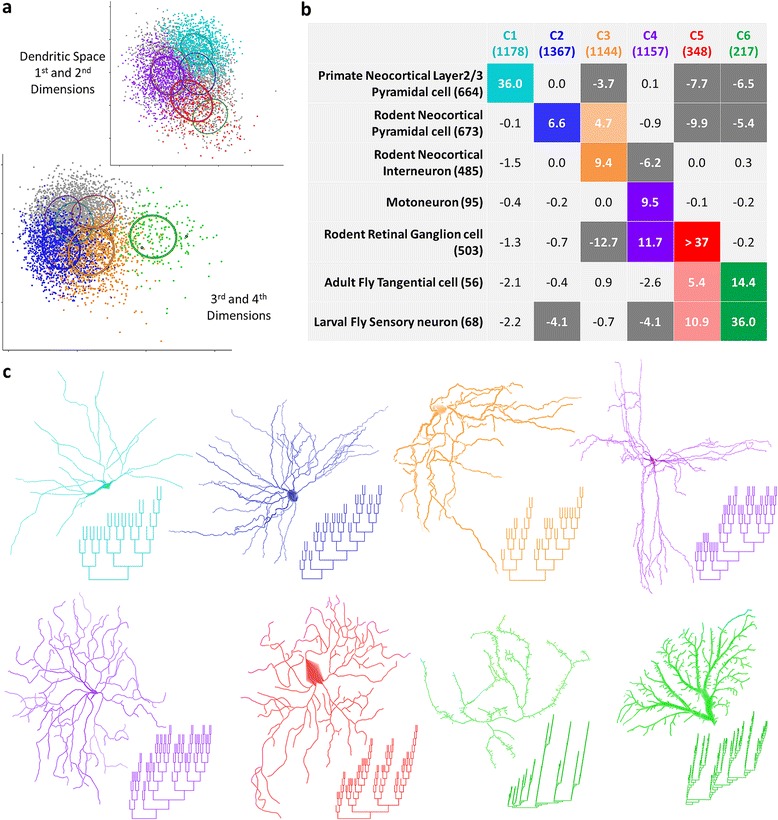
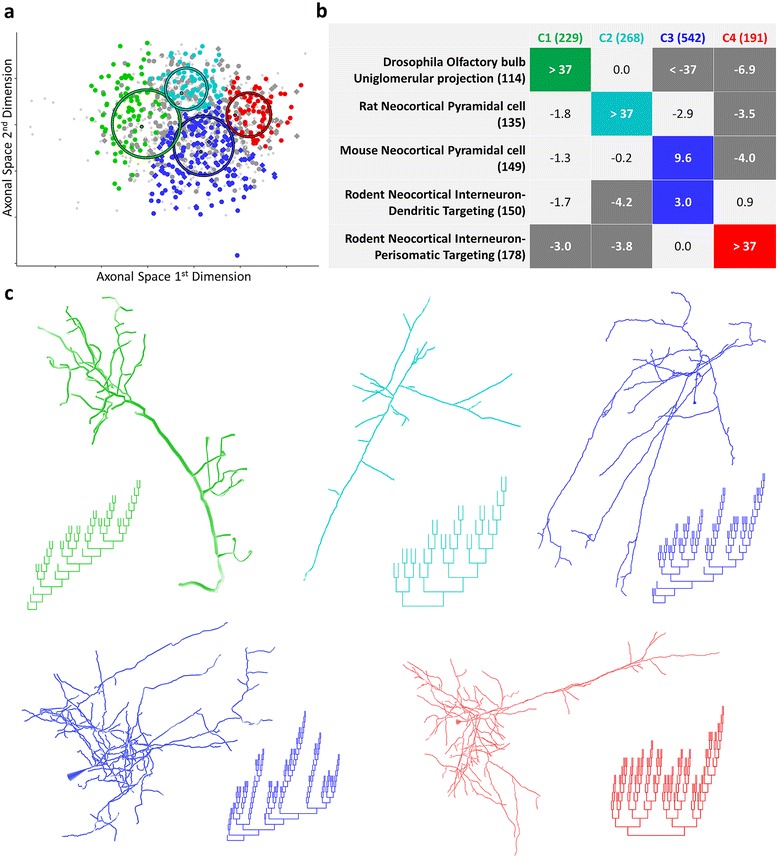
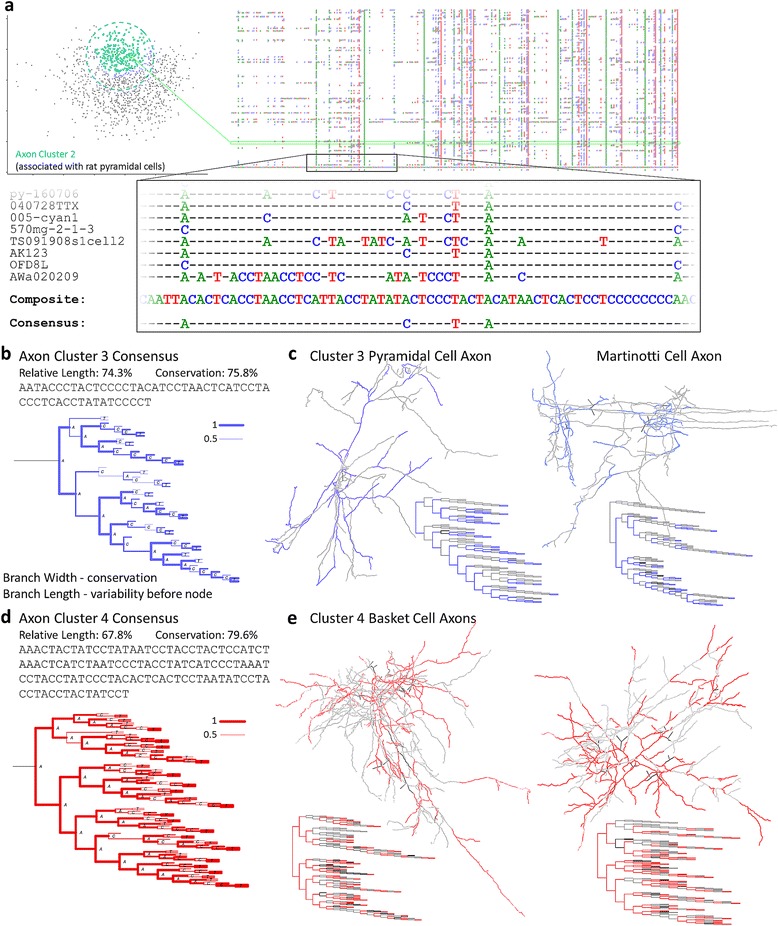
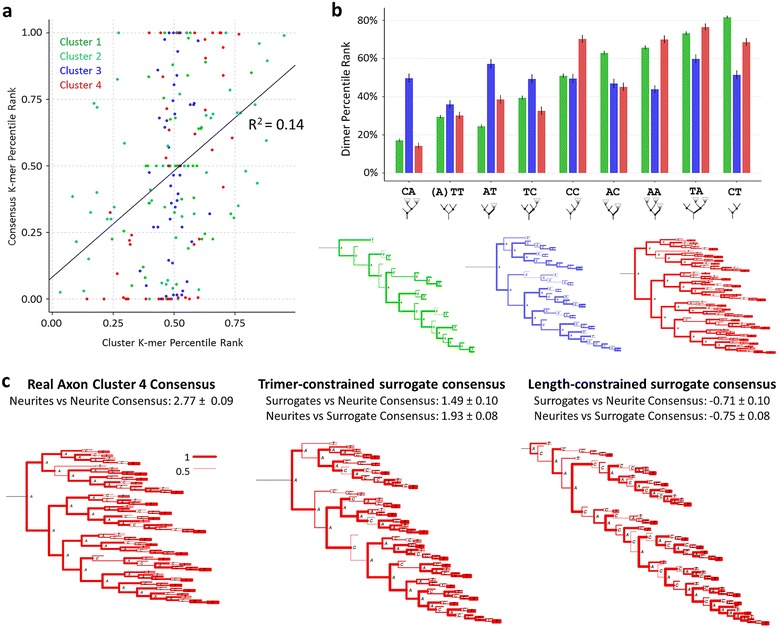
Results: The space generated from pairwise similarities is capable of classifying neuronal arbor types as well as, or better than, traditional topological metrics. Unsupervised cluster analysis produces groups that significantly correspond with known cell classes for axons, dendrites, and pyramidal apical dendrites. Furthermore, the distinguishing consensus topology generated by multiple sequence alignment of a group of neurons reveals their shared branching blueprint. Interestingly, the axons of dendritic-targeting interneurons in the rodent cortex associates with pyramidal axons but apart from the (more topologically symmetric) axons of perisomatic-targeting interneurons.

Conclusions: Global pairwise and multiple sequence alignment of neurite topologies enables detailed comparison of neurites and identification of conserved topological features in alignment-defined clusters. The methods presented also provide a framework for incorporation of additional branch-level morphological features. Moreover, comparison of multiple alignment with motif analysis shows that the two techniques provide complementary information respectively revealing global and local features.


Figures

Figure 1
Figure 1
Pairwise global sequence alignment. a. Changes in tree structure are reflected in sequence representation. When a side-branch is lost from a non-T node or a T-node with a C parent, a C node is removed from the sequence. When a branch is lost from a T node with an A parent, the T is removed and the parent A becomes a C. b. Two tree-derived sequences are aligned by matching characters and placing gaps when an alignment cannot be made. C nodes or entire subtrees are gapped, from an A to its associated T (orange brackets). The A at the front of a gap region can be matched to a C (purple connected bracket). Matches (blue |) count as 1 point, gaps (orange X) count as -1 point, and openings of a gap region count as -3 points. Alignment scores are normalized and converted into distance values. c. Sample apical dendrite morphologies of hippocampal CA1 and CA3 pyramidal cells (NMO_00588, 07558, 00219, 00213) [51-53] and their topology dendrograms illustrate alignments between neurites of the same sub-region along with normalized distances for all 6 pairs. Raw alignment scores are also provided for within-class alignments. Inset: Within- and between-group distributions of normalized distances (with mean ± standard deviation) indicate that the pyramidal apical dendrites are topologically more similar to apical dendrites of their own group than to those in the other group.
Figure 2
Figure 2
Alignment space and clustering. a. The log density plot of all neurite-derived sequences on the first two dimensions of alignment space suggests differentiable groups. b. Clustering of the alignment space reveals four clusters associated with dendrites (blue), two associated with axons (magenta), and one associated with apical dendrites (green); most neurites grouped with the cluster associated to their arbor types, but some classified with another cluster (gray). Ellipses reflect the covariance matrices of the cluster models. c. Sub-clustering of apical dendrites yields additional spherical clusters that associate with neocortex (cyan - top), hippocampal CA1 (green - right), and hippocampal CA3 (yellow - left). Apical dendrites improperly classified have lower color intensity. d. Unsupervised model-based clustering of the alignment space classifies CA1 and CA3 apical dendrites with an adjusted Rand Index of 0.72. A trained linear discriminant analysis achieves 94% accuracy.
Figure 3
Figure 3
Dendrite clusters. a. Clusters of (non-apical) dendrites are shown in two perspectives of alignment space. Each perspective highlights dendrites in three of the six clusters, with dendrites in the other three shown in gray. b. The association matrix of the clusters and seven groups defined by metadata combination of species, region, cell type, and age range. The number of dendrites in each group and cluster are shown in parentheses. Values reflect the natural log of the contingency matrix p-values, with absolute values above 3 being significant (p ≤ 0.05). Dark gray cells represent cases in which significantly fewer dendrites satisfy the cluster/group association than expected given the marginals. Positive values in colored cells represent cases in which more dendrites fall into the cell than expected. Darker colors signify that an example morphology and dendrogram is provided in c (NMO_05022, 09439, 00298, 00625, 05409, 06531, 07043, 06659) [54-61].
Figure 4
Figure 4
Axon clusters. a. Axons fall into four spherical clusters of varying sizes. Colored dots correspond to axons classified with the cluster associated with the matching metadata group. Diamonds represent rodent cortical dendritic-targeting interneurons. Circles are defined by the covariance matrix of their cluster model with a radius of one standard deviation. b. Association matrix for axon metadata groups and clusters. Colored and dark gray cells show significantly positive and negative associations, respectively, with the number of axons in each group and cluster in parentheses. c. Representative morphologies and dendrograms are shown for each significantly positive association (NMO_02574, 00315, 01209, 00424, 00424) [62-64].
Figure 5
Figure 5
Multiple sequence alignment and consensuses. a. Sequences of axonal cluster 2 (left) are aligned (right). A section of the alignment is magnified along with the composite and consensus (bottom). A single neurite in the cluster and its sequence in the MSA is highlighted (green). b, d. Consensuses of axon clusters 3 (b, blue) and 4(d, red) in sequence and dendrogram form, with relative length and average conservation statistics. Dendrogram branch width indicates conservation of the parent bifurcation (from 0.5 to 1). Branch length indicates variability preceding a bifurcation, calculated as the average proportion of a sequence falling between conserved bifurcations. c, e. Example morphologies and dendrograms of cluster 3 (c) and 4 (e) (NMO_02624, 00427, 07447, 00332 from [41,63,65]). Colored segments indicate an alignment with the consensus at the bifurcation. Black and gray segments indicate consensus bifurcations not found in the neurite and vice versa.
Figure 6
Figure 6
Global consensus and local motifs. a. Plot of the k-mer percentile ranks (normalized frequencies), for each dimer and trimer of every cluster, with the cluster’s consensus values on the y-axis and the cluster’s average sequence values on the x-axis. The small correlation indicates that consensuses only capture a small proportion (14% of the variance) of the local motif information about the cluster’s members. b. Dimer profile (top) and consensus dendrograms (bottom) for clusters 1, 3, and 4. The dimer profile is similar between clusters 1 and 4, while the consensuses differ dramatically. c. Consensus dendrograms of cluster 4 neurite sequences, trimer-constrained surrogates of the sequences, and length-constrained surrogates of the sequences. Average normalized alignment scores are provided given a set of sequences aligned to a single consensus. Dendrogram branch widths show parent bifurcation’s conservation.

Similar articles

Cited by

References

    1. Ascoli GA, Donohue DE, Halavi M. NeuroMorpho.Org: a central resource for neuronal morphologies. J Neurosci. 2007;27:9247–51. doi: 10.1523/JNEUROSCI.2055-07.2007. - DOI - PMC - PubMed
    1. Chiang A-S, Lin C-Y, Chuang C-C, Chang H-M, Hsieh C-H, Yeh C-W, et al. Three-dimensional reconstruction of brain-wide wiring networks in Drosophila at single-cell resolution. Curr Biol. 2011;21:1–11. doi: 10.1016/j.cub.2010.11.056. - DOI - PubMed
    1. Jenett A, Rubin GM, Ngo T-TB, Shepherd D, Murphy C, Dionne H, et al. A GAL4-driver line resource for Drosophila neurobiology. Cell Rep. 2012;2:991–1001. doi: 10.1016/j.celrep.2012.09.011. - DOI - PMC - PubMed
    1. Donohue DE, Ascoli GA. Automated reconstruction of neuronal morphology: an overview. Brain Res Rev. 2011;67:94–102. doi: 10.1016/j.brainresrev.2010.11.003. - DOI - PMC - PubMed
    1. Parekh R, Ascoli GA. Neuronal morphology goes digital: a research hub for cellular and system neuroscience. Neuron. 2013;77:1017–38. doi: 10.1016/j.neuron.2013.03.008. - DOI - PMC - PubMed

Publication types

LinkOut - more resources