. 2015 Nov;45(12):1771-80.
doi: 10.1007/s00247-015-3400-2. Epub 2015 Jul 4.

Patient-specific dose calculations for pediatric CT of the chest, abdomen and pelvis

Affiliations

Patient-specific dose calculations for pediatric CT of the chest, abdomen and pelvis

Susan D Kost et al. Pediatr Radiol. 2015 Nov.

Abstract

Background: Organ dose is essential for accurate estimates of patient dose from CT.

Objective: To determine organ doses from a broad range of pediatric patients undergoing diagnostic chest-abdomen-pelvis CT and investigate how these relate to patient size.

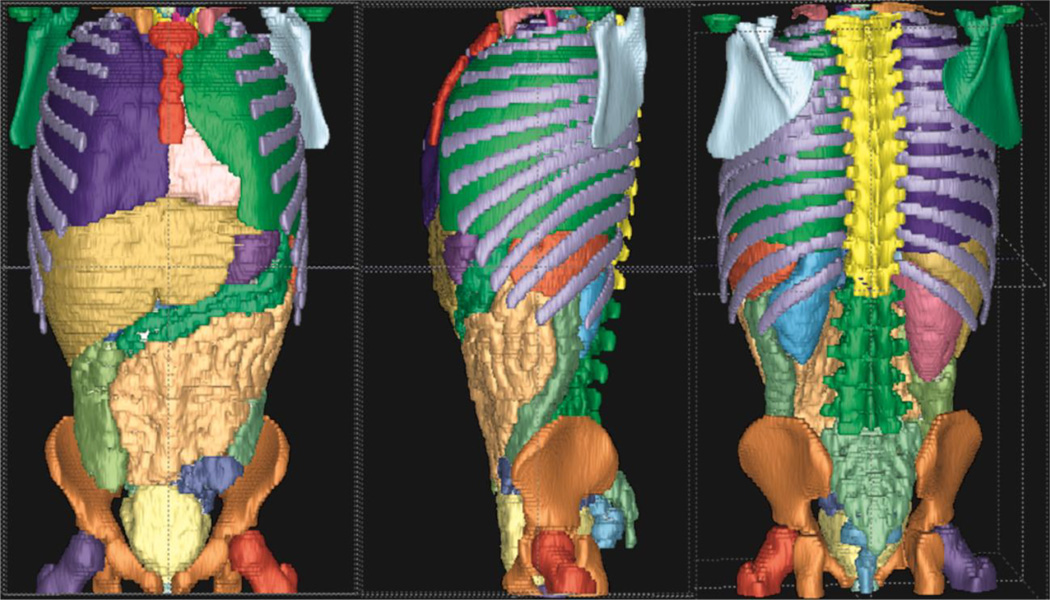
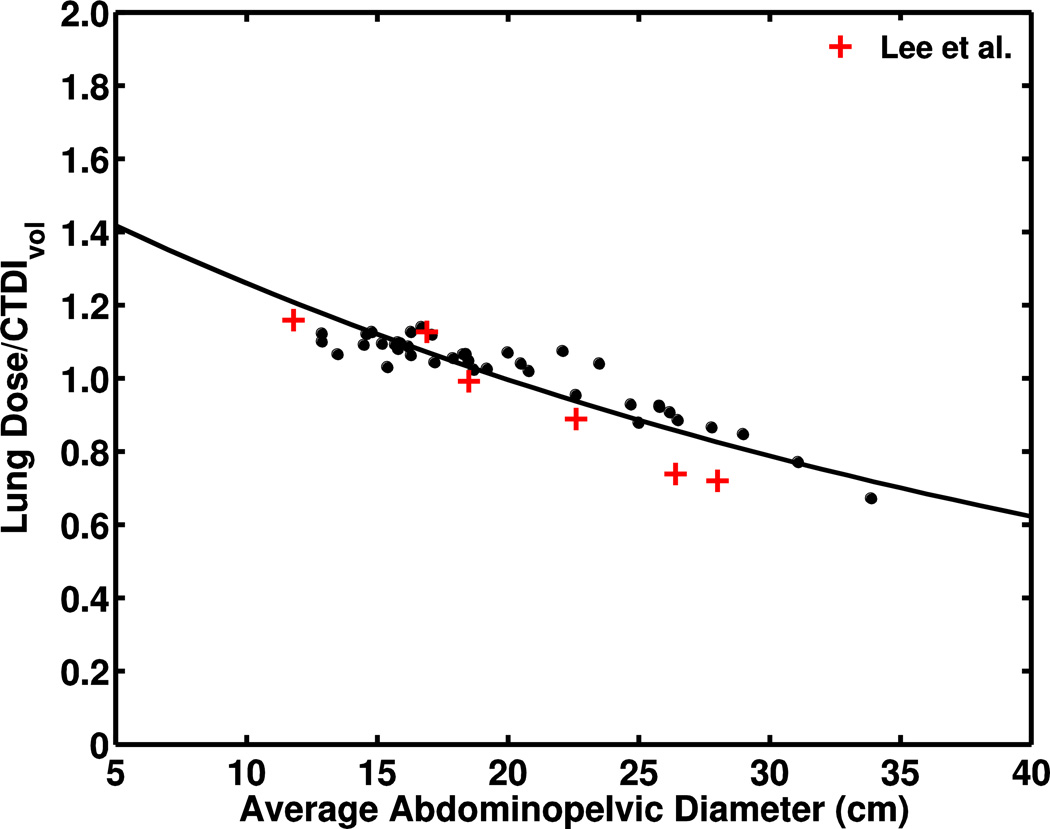
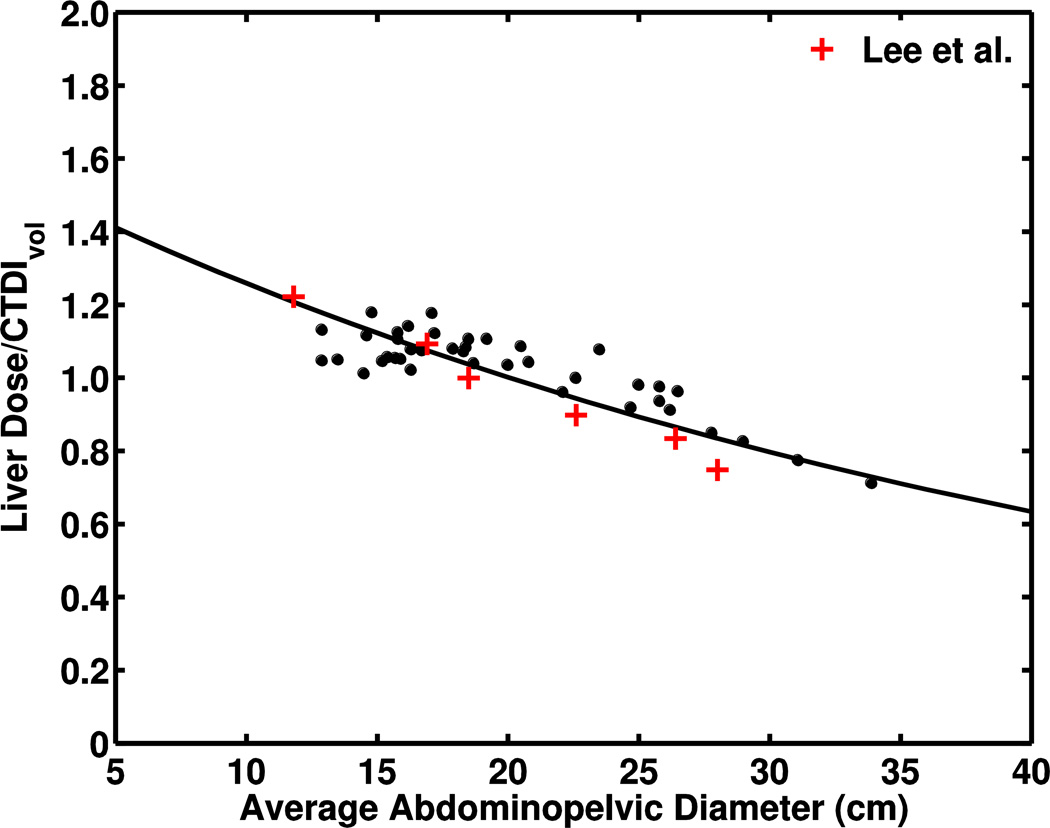
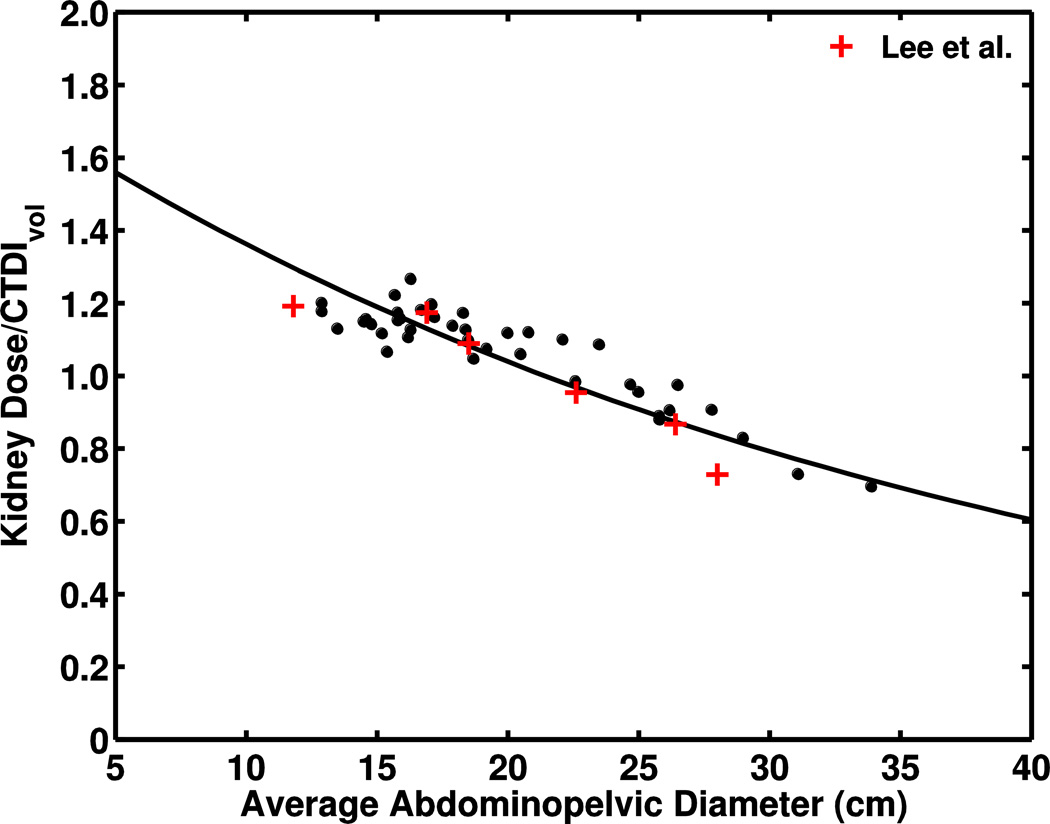
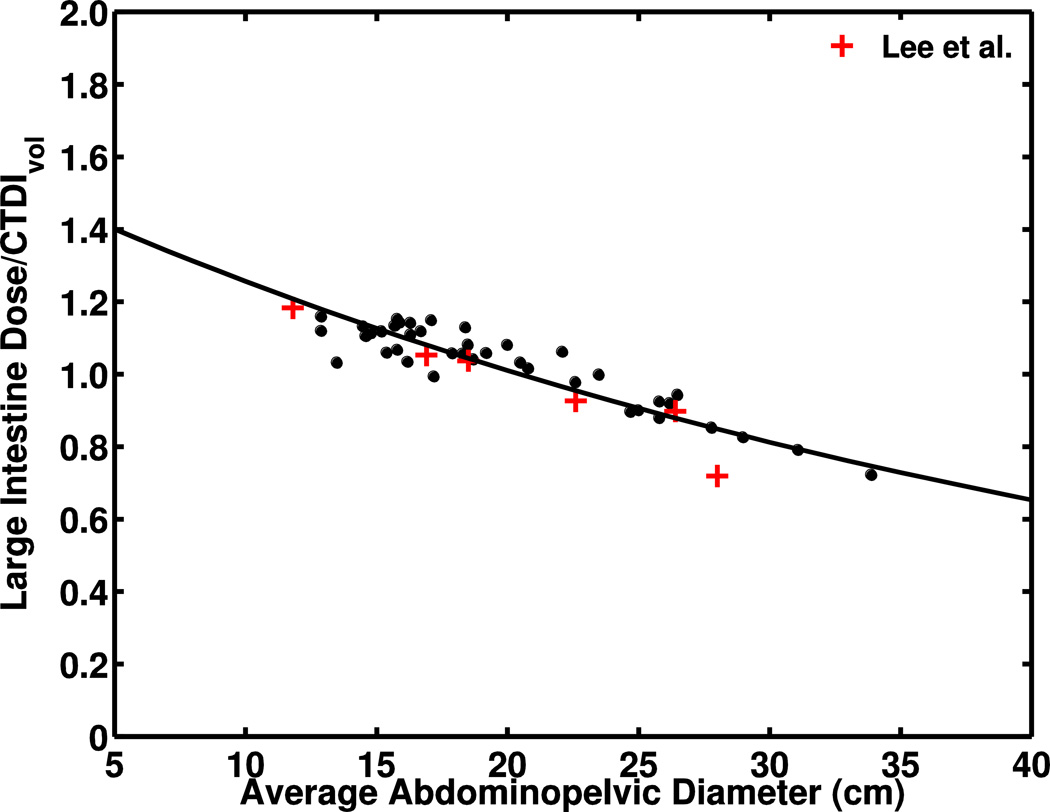
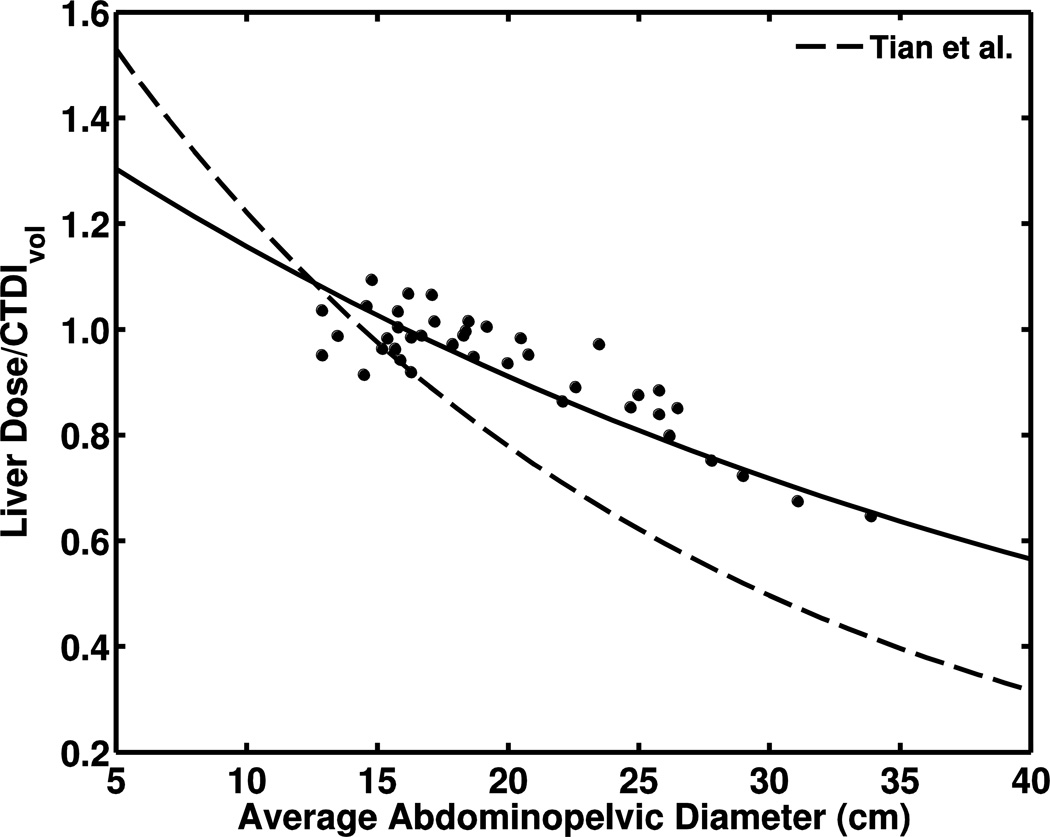
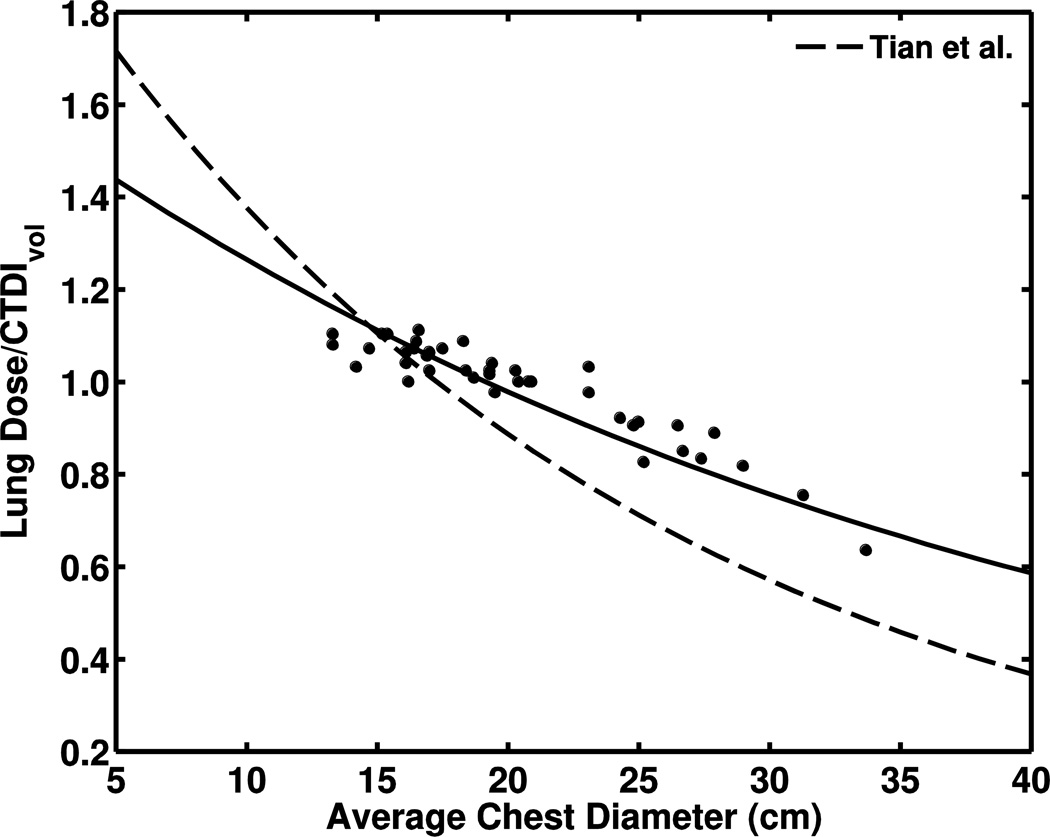
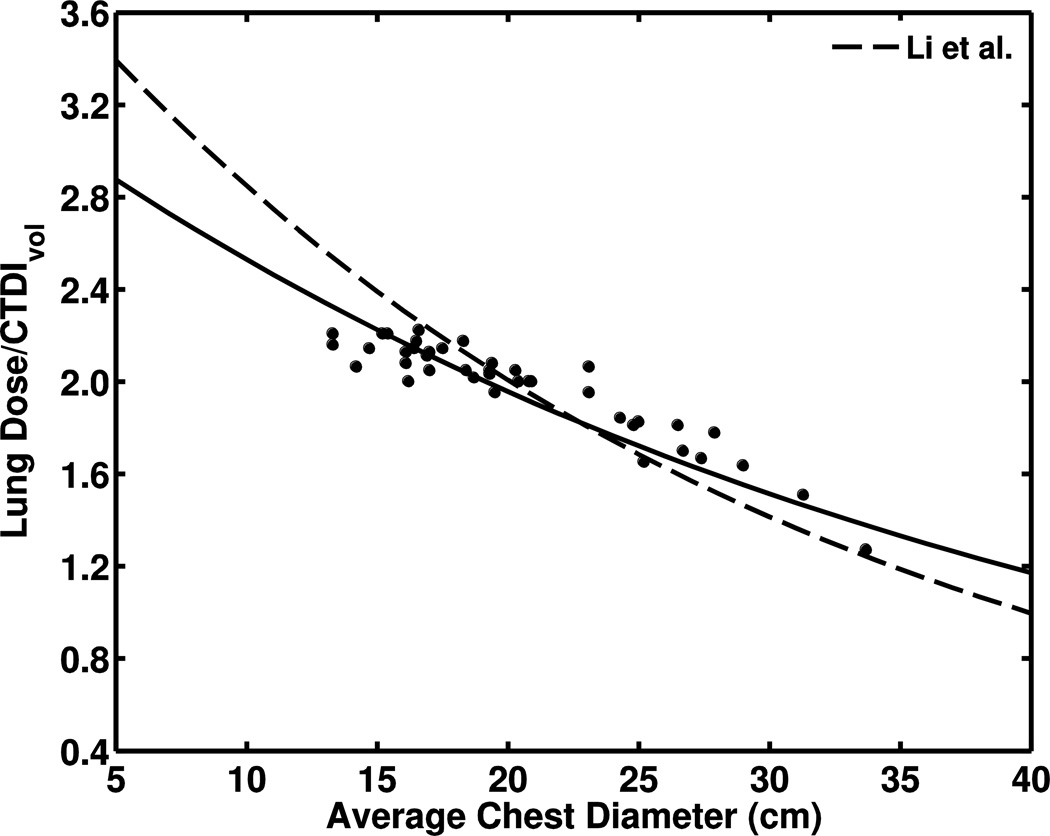
Materials and methods: We used a previously validated Monte Carlo simulation model of a Philips Brilliance 64 multi-detector CT scanner (Philips Healthcare, Best, The Netherlands) to calculate organ doses for 40 pediatric patients (M:F = 21:19; range 0.6-17 years). Organ volumes and positions were determined from the images using standard segmentation techniques. Non-linear regression was performed to determine the relationship between volume CT dose index (CTDIvol)-normalized organ doses and abdominopelvic diameter. We then compared results with values obtained from independent studies.

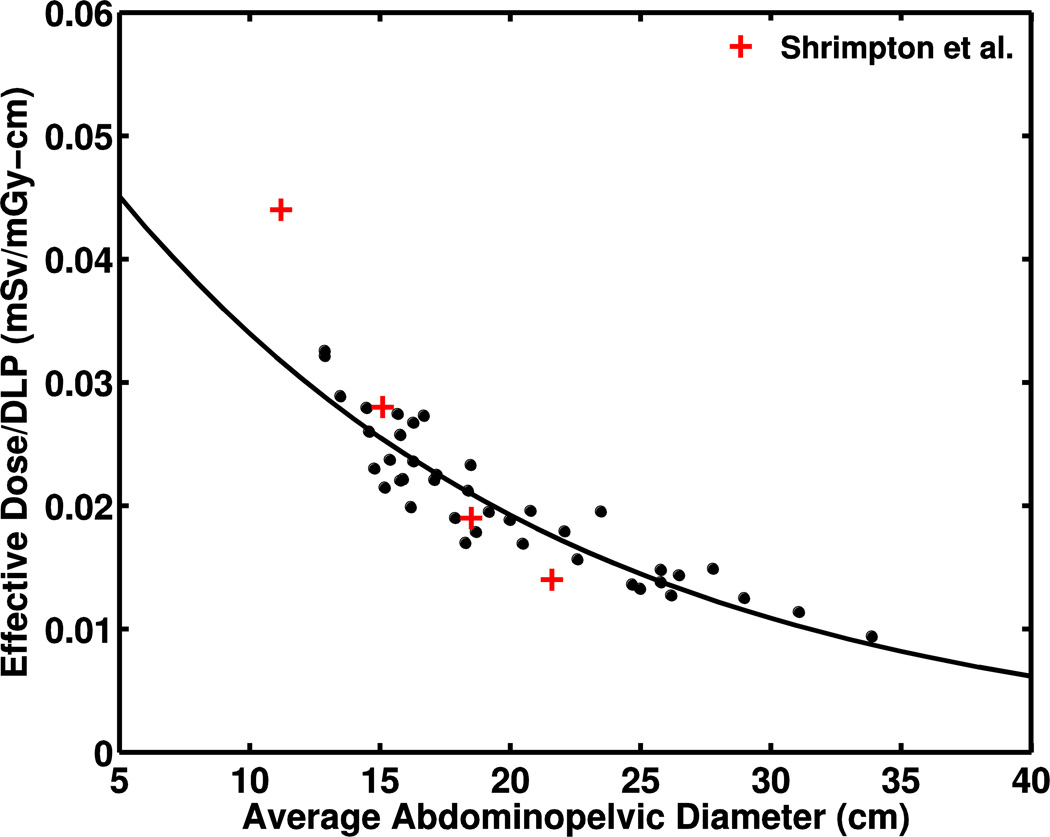
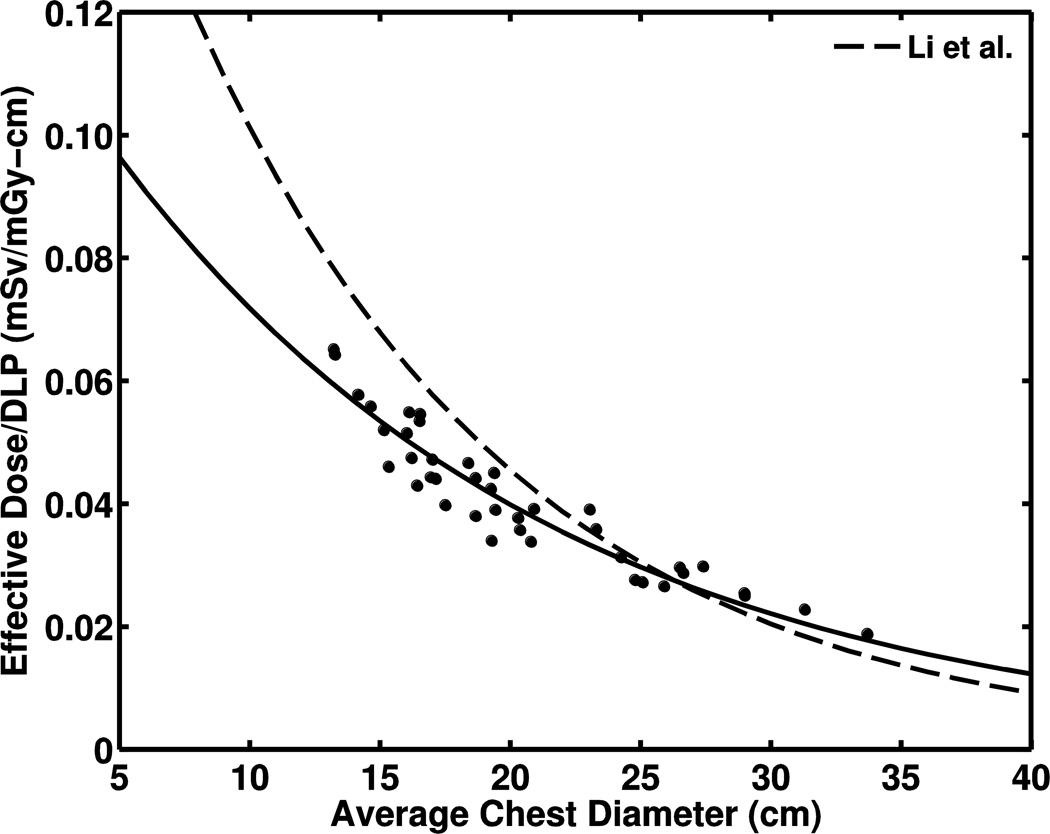
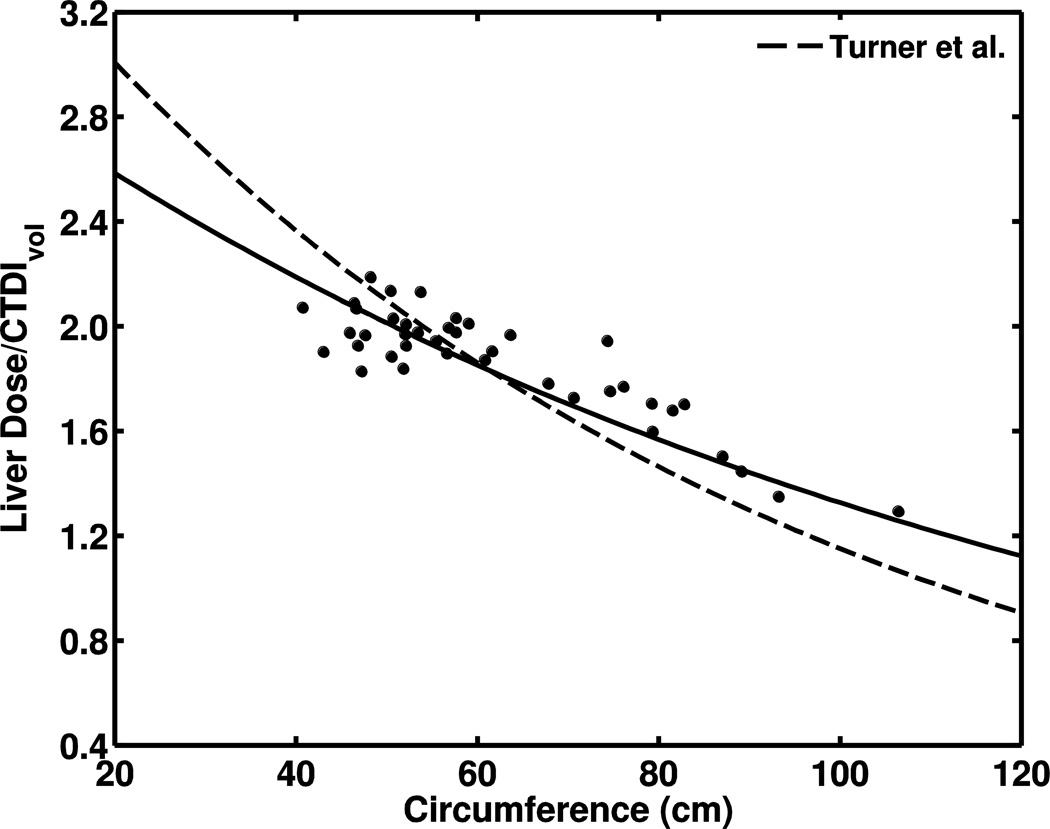
Results: We found that CTDIvol-normalized organ dose correlated strongly with exponentially decreasing abdominopelvic diameter (R(2) > 0.8 for most organs). A similar relationship was determined for effective dose when normalized by dose-length product (R(2) = 0.95). Our results agreed with previous studies within 12% using similar scan parameters (e.g., bowtie filter size, beam collimation); however results varied up to 25% when compared to studies using different bowtie filters.

Conclusion: Our study determined that organ doses can be estimated from measurements of patient size, namely body diameter, and CTDIvol prior to CT examination. This information provides an improved method for patient dose estimation.

Keywords: Children; Computed tomography; Effective dose; Monte Carlo; Organ dose; Patient size.


Conflict of interest statement

Conflicts of interest None

Figures

Fig. 1
Fig. 1
Segmentation of body images. Voxel-based organ map shows various views of a segmented pediatric CT data set of a 7-year-old boy. Maps are colored-coded based on the organ identification numbers used in the computer model
Fig. 2
Fig. 2
Chest–abdomen–pelvis CTDIvol-normalized organ doses as a function of average abdominopelvic diameter for four organs. Plots show the dependence of CTDIvol-normalized dose for (a) lungs, (b) liver, (c) kidneys and (d) large intestine on abdominopelvic diameter with comparison to data from Lee et al. [22], signified by (+) and derived from reference pediatric phantoms
Fig. 2
Fig. 2
Chest–abdomen–pelvis CTDIvol-normalized organ doses as a function of average abdominopelvic diameter for four organs. Plots show the dependence of CTDIvol-normalized dose for (a) lungs, (b) liver, (c) kidneys and (d) large intestine on abdominopelvic diameter with comparison to data from Lee et al. [22], signified by (+) and derived from reference pediatric phantoms
Fig. 3
Fig. 3
DLP-normalized effective dose to diameter. a Plot shows exponential fit of DLP-normalized effective dose to abdominopelvic diameter with comparison to k coefficients from Shrimpton et al. [15] for trunk examinations (Shrimpton data presented as +) of reference pediatric patients developed by Cristy and Eckerman [37] at age 0, 1 year, 5 years and 10 years. The average abdominopelvic diameters of the reference phantoms were determined from the geometric definitions of the trunk. b Plot shows exponential fit of DLP-normalized effective dose to chest diameter with comparison to data from Li et al.’s [25] protocol C for chest examination (120 kVp, large bowtie filter, pitch 1.375, 40-mm collimation) (dashed line). Data normalized to DLP from 32-cm-diameter phantom. DLP dose-length product
Fig. 3
Fig. 3
DLP-normalized effective dose to diameter. a Plot shows exponential fit of DLP-normalized effective dose to abdominopelvic diameter with comparison to k coefficients from Shrimpton et al. [15] for trunk examinations (Shrimpton data presented as +) of reference pediatric patients developed by Cristy and Eckerman [37] at age 0, 1 year, 5 years and 10 years. The average abdominopelvic diameters of the reference phantoms were determined from the geometric definitions of the trunk. b Plot shows exponential fit of DLP-normalized effective dose to chest diameter with comparison to data from Li et al.’s [25] protocol C for chest examination (120 kVp, large bowtie filter, pitch 1.375, 40-mm collimation) (dashed line). Data normalized to DLP from 32-cm-diameter phantom. DLP dose-length product
Fig. 4
Fig. 4
Comparison of liver-dose results. a Plot of CTDIvol-normalized liver-dose relationship with body circumference as compared to findings of Turner et al. [28] (dashed line) for abdominopelvic study (120 kVp, body bowtie filter, pitch 1.0 and collimation 28.8–40 mm). Data normalized to CTDIvol from 32-cm-diameter phantom. b Plot of exponential fit of CTDIvol-normalized liver dose to abdominopelvic diameter as compared to data from Tian et al. [24] (dashed line) for abdominopelvic study (120 kVp, small bowtie filter, pitch 1.375, 40-mm collimation)
Fig. 4
Fig. 4
Comparison of liver-dose results. a Plot of CTDIvol-normalized liver-dose relationship with body circumference as compared to findings of Turner et al. [28] (dashed line) for abdominopelvic study (120 kVp, body bowtie filter, pitch 1.0 and collimation 28.8–40 mm). Data normalized to CTDIvol from 32-cm-diameter phantom. b Plot of exponential fit of CTDIvol-normalized liver dose to abdominopelvic diameter as compared to data from Tian et al. [24] (dashed line) for abdominopelvic study (120 kVp, small bowtie filter, pitch 1.375, 40-mm collimation)
Fig. 5
Fig. 5
Comparison of lung-dose results. Plot of CTDIvol-normalized lung-dose relationship with chest diameter as compared with data from Tian et al. [24] (dashed line) for chest examination. b Plot of exponential fit of CTDIvol-normalized lung dose to chest diameter as compared to data from Li et al.’s [25] protocol c for chest examination (120 kVp, large bowtie filter, pitch 1.375, 40-mm collimation) (dashed line). Data normalized to dose-length product from 32-cm-diameter phantom
Fig. 5
Fig. 5
Comparison of lung-dose results. Plot of CTDIvol-normalized lung-dose relationship with chest diameter as compared with data from Tian et al. [24] (dashed line) for chest examination. b Plot of exponential fit of CTDIvol-normalized lung dose to chest diameter as compared to data from Li et al.’s [25] protocol c for chest examination (120 kVp, large bowtie filter, pitch 1.375, 40-mm collimation) (dashed line). Data normalized to dose-length product from 32-cm-diameter phantom

References

    1. National Council on Radiation Protection and Measurements. Ionizing radiation exposure of the population of the United States. NCRP Report No. 160. Bethesda, MD: National Council on Radiation Protection and Measurements; 2009.
    1. Paterson A, Frush D. Dose reduction in paediatric MDCT: general principles. Clin Radiol. 2007;62:507–517. - PubMed
    1. National Research Council. Health risks from exposure to low levels of ionising radiation: BEIR VII report. Washington, DC: 2006.
    1. Brenner DJ. Estimating cancer risks from pediatric CT: going from the qualitative to the quantitative. Pediatr Radiol. 2002;32:228–231. - PubMed
    1. Brenner DJ, Elliston CD, Hall EJ, Berdon WE. Estimated risks of radiation-induced fatal cancer from pediatric CT. AJR Am J Roentgenol. 2001;176:289–296. - PubMed

Publication types

LinkOut - more resources