. 2015 Jul 16;162(2):259-270.
doi: 10.1016/j.cell.2015.06.017. Epub 2015 Jul 2.

The Utilization of Extracellular Proteins as Nutrients Is Suppressed by mTORC1

Affiliations

The Utilization of Extracellular Proteins as Nutrients Is Suppressed by mTORC1

Wilhelm Palm et al. Cell. .

Abstract

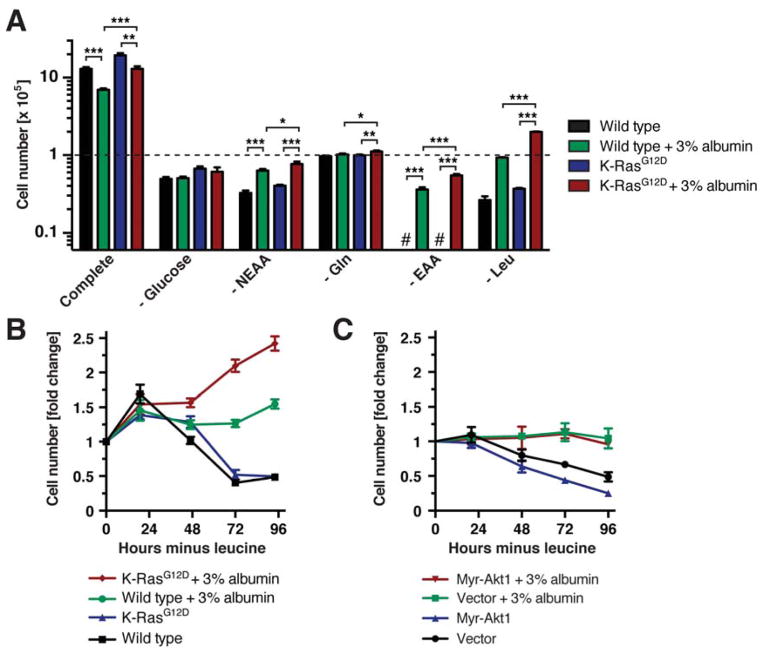
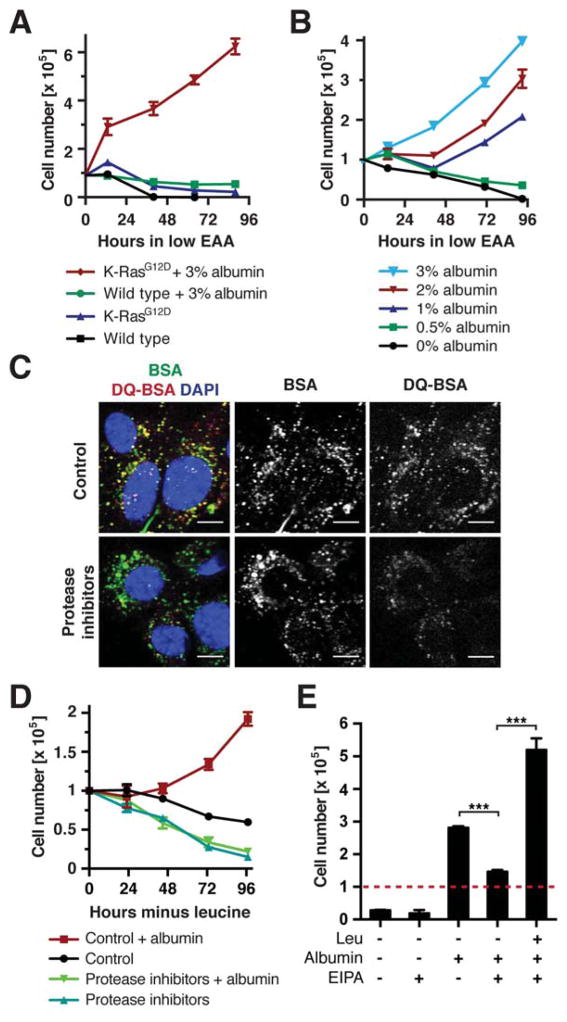
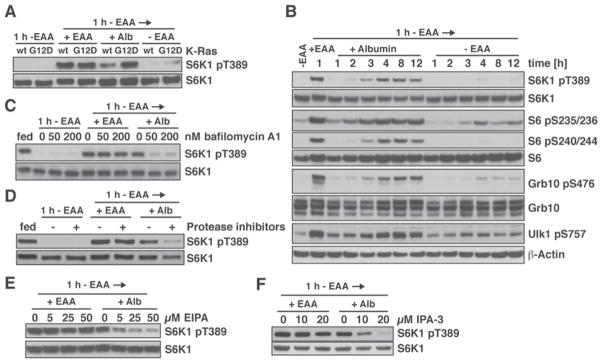
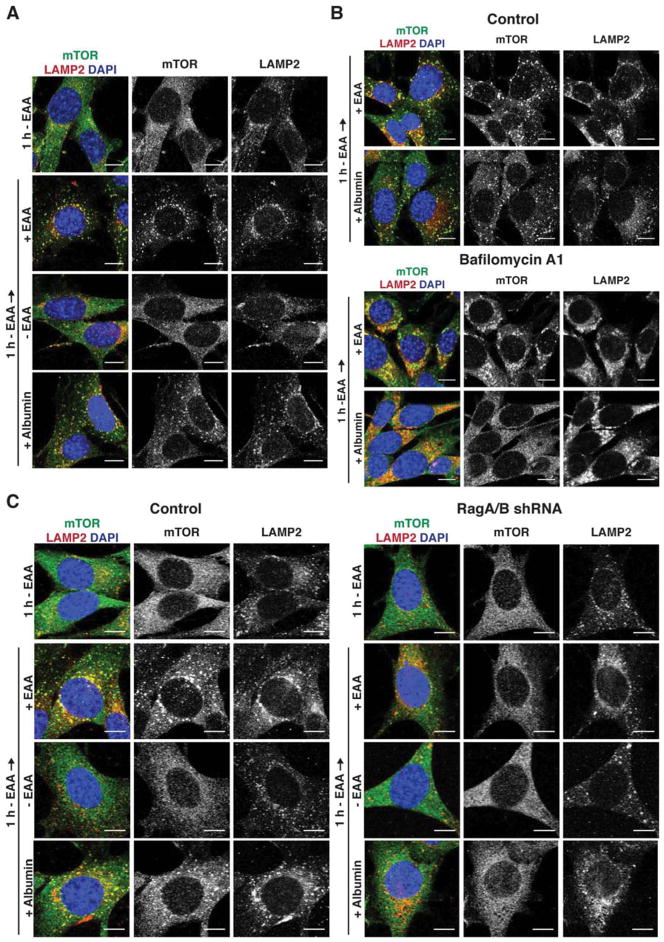
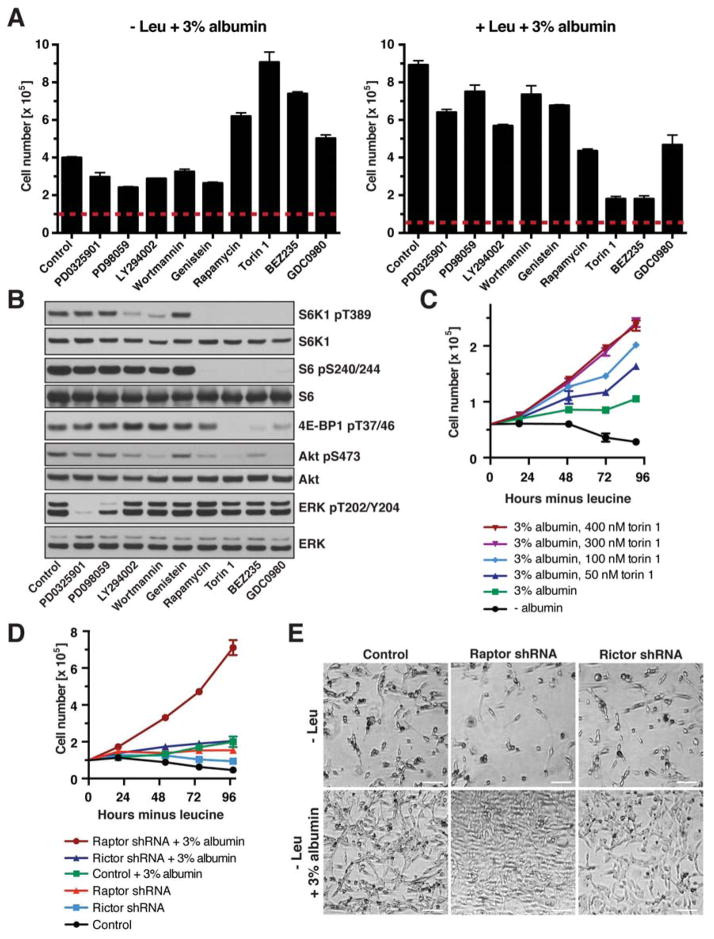
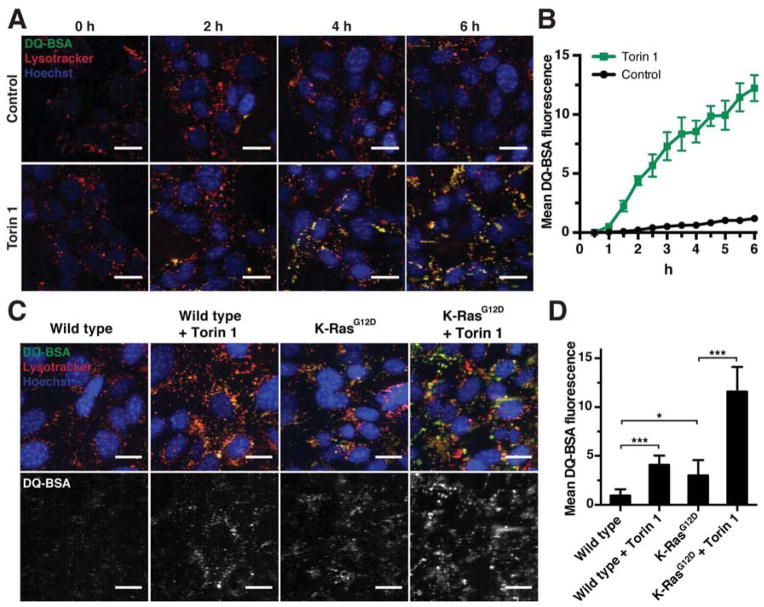
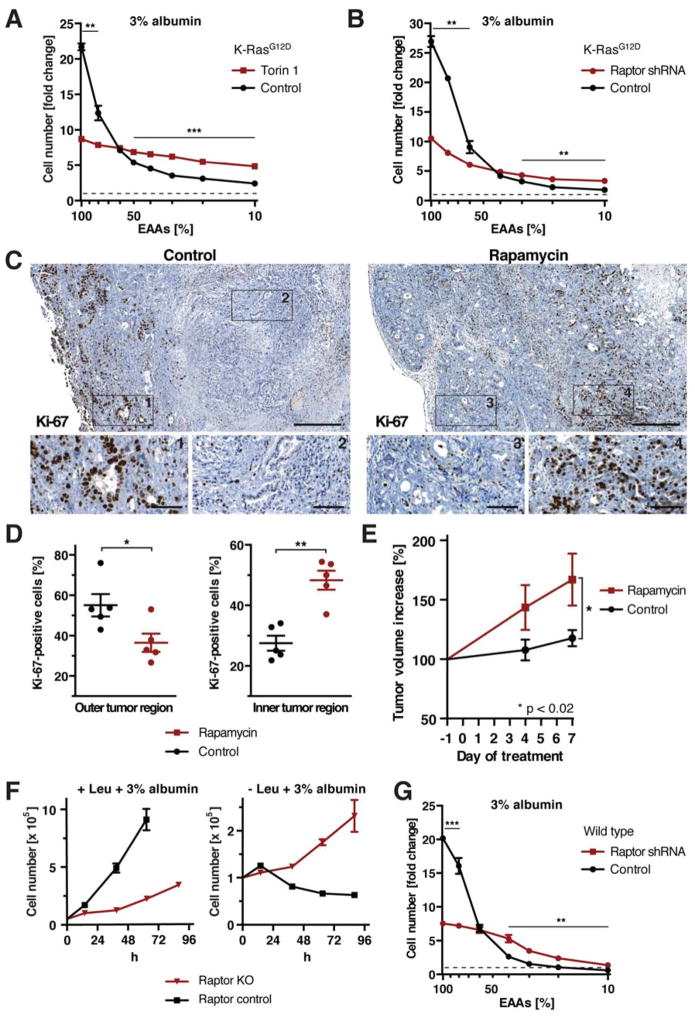
Despite being surrounded by diverse nutrients, mammalian cells preferentially metabolize glucose and free amino acids. Recently, Ras-induced macropinocytosis of extracellular proteins was shown to reduce a transformed cell's dependence on extracellular glutamine. Here, we demonstrate that protein macropinocytosis can also serve as an essential amino acid source. Lysosomal degradation of extracellular proteins can sustain cell survival and induce activation of mTORC1 but fails to elicit significant cell accumulation. Unlike its growth-promoting activity under amino-acid-replete conditions, we discovered that mTORC1 activation suppresses proliferation when cells rely on extracellular proteins as an amino acid source. Inhibiting mTORC1 results in increased catabolism of endocytosed proteins and enhances cell proliferation during nutrient-depleted conditions in vitro and within vascularly compromised tumors in vivo. Thus, by preventing nutritional consumption of extracellular proteins, mTORC1 couples growth to availability of free amino acids. These results may have important implications for the use of mTOR inhibitors as therapeutics.


Figures

Figure 1
Figure 1. Physiological Levels of Extracellular Proteins Provide Nutritional Benefits for Wild Type and K-Ras Mutant Cells
(A) Cell numbers of wild type and heterozygous K-RasG12D MEFs at day 3 of culture in medium ± 3% albumin lacking different nutrients as indicated [glucose, non-essential amino acids (NEAA), glutamine, essential amino acids (EAA), leucine]. The dashed line indicates starting cell numbers. # below detection limit. * p < 0.05, ** p < 0.01, *** p < 0.001. (B) Growth curve of wild type and K-RasG12D MEFs in leucine-free medium ± 3% albumin. (C) Growth curve of wild type MEFs expressing myristoylated Akt1 (myr- Akt1) in leucine-free medium ± 3% albumin. Data are represented as mean ± STDEV (n = 3). See also Fig. S1.
Figure 2
Figure 2. Macropinocytosis and Lysosomal Degradation of Extracellular Proteins Supports Growth of Ras Mutant Cells during EAA Starvation
(A) Growth curve of wild type and K-RasG12D MEFs in amino acid-deficient medium containing EAAs at 5% of the levels in complete medium ± 3% albumin. (B) Growth curve of K-RasG12D MEFs in amino aciddeficient medium containing 5% EAAs supplemented with indicated albumin concentrations. (C) Uptake and intracellular degradation of albumin in K-RasG12D MEFs, assessed by fluorescently labeled BSA and DQ-BSA. Protease inhibitors: 2 μM pepstatin A, 2 μM E-64, 10 μM leupeptin. Scale bars = 10 μm. (D) Growth curve of K-RasG12D MEFs in leucine-free medium ± 3% albumin and protease inhibitors as in (C). (E) Cell numbers of K-RasG12D MEFs at day 3 of culture in leucine-free medium ± 3% albumin and 25 μM EIPA. The dashed line indicates starting cell numbers. *** p < 0.001. Data are represented as mean ± STDEV (n = 3). See also Fig. S2.
Figure 3
Figure 3. Lysosomal Degradation of Internalized Proteins Activates the mTORC1 Pathway
(A) Comparison of mTORC1 activation in wild type and K-RasG12D MEFs, analyzed by Western Blotting (WB). MEFs were starved of EAAs for 1 h, then placed in medium containing EAAs or 3% albumin, or in fresh EAA-free medium for 4 h. (B) Time course of mTORC1 activation in K-RasG12D MEFs by stimulation with 3% albumin after 1 h EAA starvation, analyzed by WB. (C)(F) Effects of inhibiting lysosomal function or macropinocytosis on albumin-dependent mTORC1 activation, analyzed by WB. K-RasG12D MEFs were starved of EAAs for 1 h, then placed in medium containing EAAs or 3% albumin, or in fresh EAA-free medium for 3 h. (C) bafilomycin A1, (D) lysosomal protease inhibitors (10 μM pepstatin A, 20 μM E-64), (E) EIPA (Na+/H+ exchange inhibitor) or (F) IPA-3 (PAK1 inhibitor) were added at the onset of starvation. See also Fig. S3.
Figure 4
Figure 4. Lysosomal Degradation of Internalized Proteins Induces Lysosomal Recruitment of mTOR
(A) Lysosomal recruitment of mTOR by extracellular proteins or EAAs, analyzed by immunofluorescence against mTOR and the lysosomal marker LAMP2. K-RasG12D MEFs were starved of EAAs for 1 h, then placed in medium containing EAAs or 3% albumin, or in fresh EAA-free medium for 2 h. (B) Consequences of inhibiting lysosomal proteolysis on lysosomal recruitment of mTOR by extracellular proteins in K-RasG12D MEFs treated and analyzed as in (A). 200 nM bafilomycin A1 was added at the onset of EAA starvation. (C) Consequences of RagA/B knockdown on lysosomal recruitment of mTOR in K-RasG12D MEFs treated and analyzed as in (A). Scale bars = 10 μm. See also Fig. S4.
Figure 5
Figure 5. mTORC1 Signaling Is a Negative Regulator of Extracellular Protein-Dependent Growth
(A) Cell numbers of K-RasG12D MEFs at day 3 of culture in leucine-containing or leucine-free medium + 3% albumin and following inhibitors: MEK1/2 (1 μM PD0325901, 50 μM PD98059), PI3-kinase (25 μM LY294002, 2 μM wortmannin), tyrosine kinases (50 μM genistein), mTOR (50 nM rapamycin, 250 nM torin 1), mTOR/PI3-kinase (0.5 μM BEZ235, 0.5 μM GDC0980). Dashed lines indicate starting cell numbers. (B) mTOR, PI3-kinase and MAP kinase pathway activity in K-RasG12D MEFs cultured for 1 day in leucine-free medium + 3% albumin, analyzed by WB. Inhibitors were as in (A) (C) Growth curve of K-RasG12D MEFs in leucine-free medium ± 3% albumin and indicated concentrations of torin 1. (D) Growth curve of K-RasG12D MEFs expressing shRNA against Raptor, Rictor or control in leucine-free medium ± 3% albumin. (E) Bright field images of K-RasG12D MEFs expressing shRNA against Raptor, Rictor or control at day 4 of culture in leucine-free medium ± 3% albumin. Scale bars = 50 μm. Data are represented as mean ± STDEV (n = 3). See also Fig. S5.
Figure 6
Figure 6. mTORC1 Suppresses Lysosomal Degradation of Internalized Proteins
(A) Time-course of lysosomal DQ-BSA degradation in K-RasG12D MEFs in the presence or absence of 250 nM torin 1. (B) Quantification of DQ-BSA fluorescence of cells shown in (A). (C) Lysosomal degradation of DQ-BSA in wild type and K-RasG12D MEFs after 6 h DQ-BSA uptake in the presence or absence of 250 nM torin 1. (D) Quantification of DQ-BSA fluorescence of cells shown in (C). Data are represented as mean ± STDEV (n ≥ 5 fields of view with > 20 cells each). * p < 0.05, *** p < 0.001. Scale bars = 20 μm. See also Fig. S6.
Figure 7
Figure 7. mTORC1 Signaling Has Opposing Effects on Cell Proliferation in Nutrient-Rich and Nutrient-Depleted Conditions
(A), (B) Cell numbers of K-RasG12D MEFs (A) ±250 nM torin 1, (B) expressing Raptor or control shRNA, at day 3 of culture in medium containing 3% albumin and indicated amounts of EAAs. (C) Proliferation of pancreatic tumor cells in control and rapamycin-treated KPC mice, analyzed by immunohistochemistry against Ki-67. Scale bars = 400 μm; scale bars in blow-ups = 50 μm. (D) Quantification of Ki-67-positive tumor cells in outer and inner tumor regions as shown in (C). (E) Volume increase of pancreatic tumors in control and rapamycin-treated KPC mice, quantified by 3d high-resolution ultrasound. (F) Growth curve of Raptor KO MEFs in leucine-containing or free medium + 3% albumin. (G) Cell numbers of wild type MEFs expressing Raptor or control shRNA at day 3 of culture in medium containing 3% albumin and indicated amounts of EAAs. Data in (A), (B), (F), (G) are represented as mean ± STDEV (n = 3). Dashed lines indicate starting cell number. Data in (D), (E) are represented as mean ± SEM (n = 5). * p < 0.05, ** p < 0.01, *** p < 0.001. See also Fig. S7.

Comment in

  • mTORC1 maintains metabolic balance.
    Cheong H, Klionsky DJ. Cheong H, et al. Cell Res. 2015 Oct;25(10):1085-6. doi: 10.1038/cr.2015.107. Epub 2015 Sep 11. Cell Res. 2015. PMID: 26358187 Free PMC article.

References

    1. Amyere M, Mettlen M, Van Der Smissen P, Platek A, Payrastre B, Veithen A, Courtoy PJ. Origin, originality, functions, subversions and molecular signalling of macropinocytosis. International journal of medical microbiology : IJMM. 2002;291:487–494. - PubMed
    1. Bar-Sagi D, Feramisco JR. Induction of membrane ruffling and fluid-phase pinocytosis in quiescent fibroblasts by ras proteins. Science (New York, NY) 1986;233:1061–1068. - PubMed
    1. Cairns RA, Harris IS, Mak TW. Regulation of cancer cell metabolism. Nature reviews Cancer. 2011;11:85–95. - PubMed
    1. Commisso C, Davidson SM, Soydaner-Azeloglu RG, Parker SJ, Kamphorst JJ, Hackett S, Grabocka E, Nofal M, Drebin JA, Thompson CB, et al. Macropinocytosis of protein is an amino acid supply route in Ras-transformed cells. Nature. 2013;497:633–637. - PMC - PubMed
    1. Cybulski N, Zinzalla V, Hall MN. Inducible raptor and rictor knockout mouse embryonic fibroblasts. Methods in molecular biology (Clifton, NJ) 2012;821:267–278. - PubMed

Publication types