. 2015 Jul 6:6:7668.
doi: 10.1038/ncomms8668.

Aneuploidy generates proteotoxic stress and DNA damage concurrently with p53-mediated post-mitotic apoptosis in SAC-impaired cells

Affiliations

Aneuploidy generates proteotoxic stress and DNA damage concurrently with p53-mediated post-mitotic apoptosis in SAC-impaired cells

Akihiro Ohashi et al. Nat Commun. .

Abstract

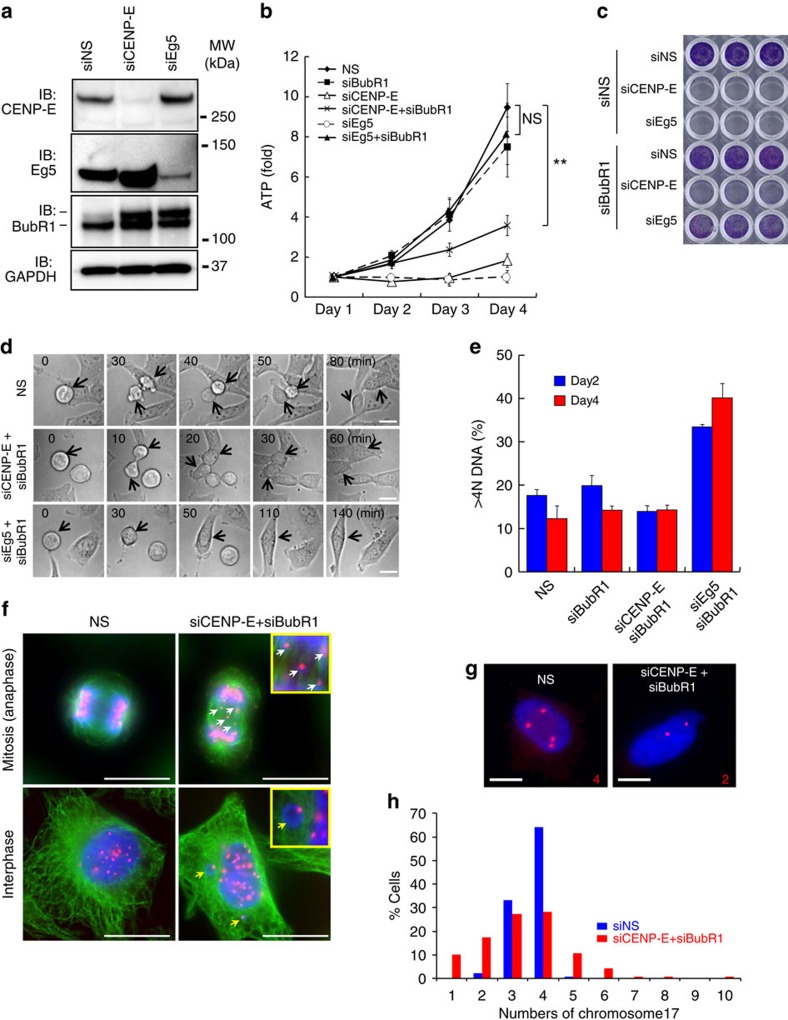
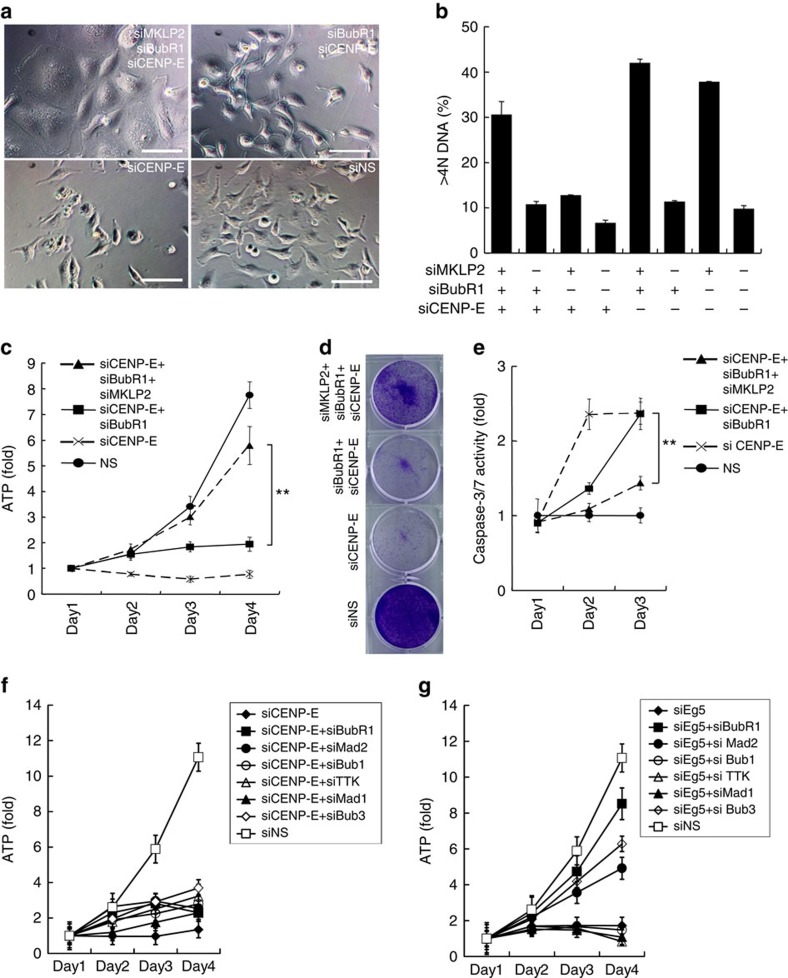
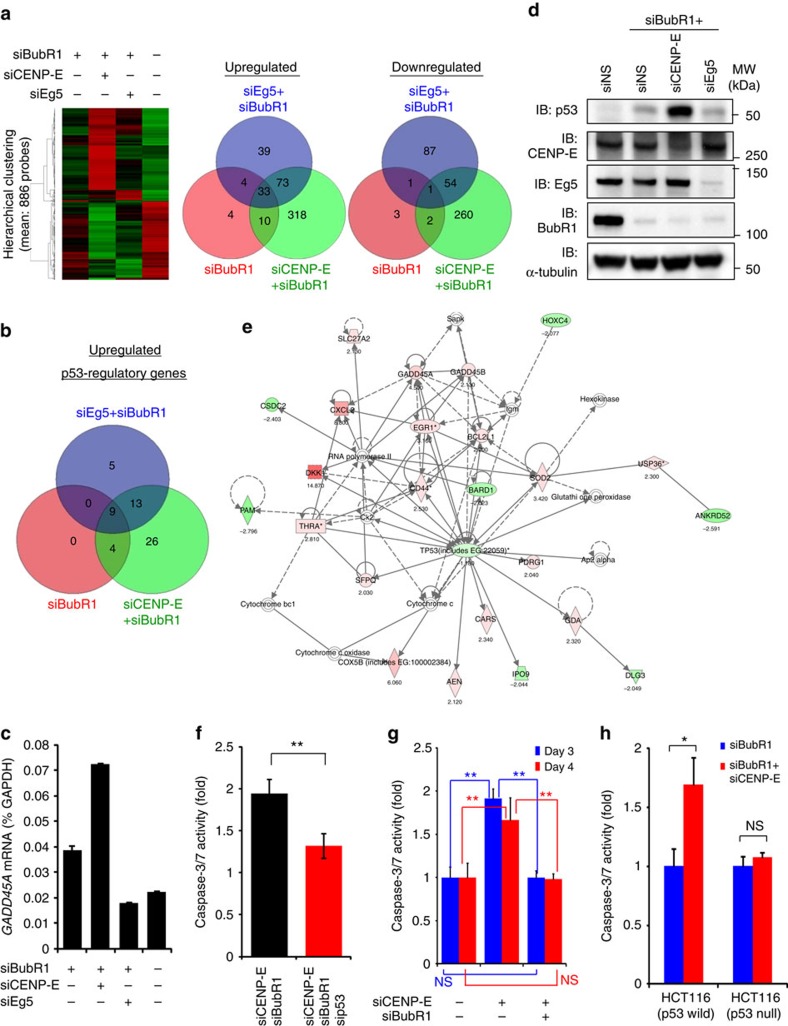
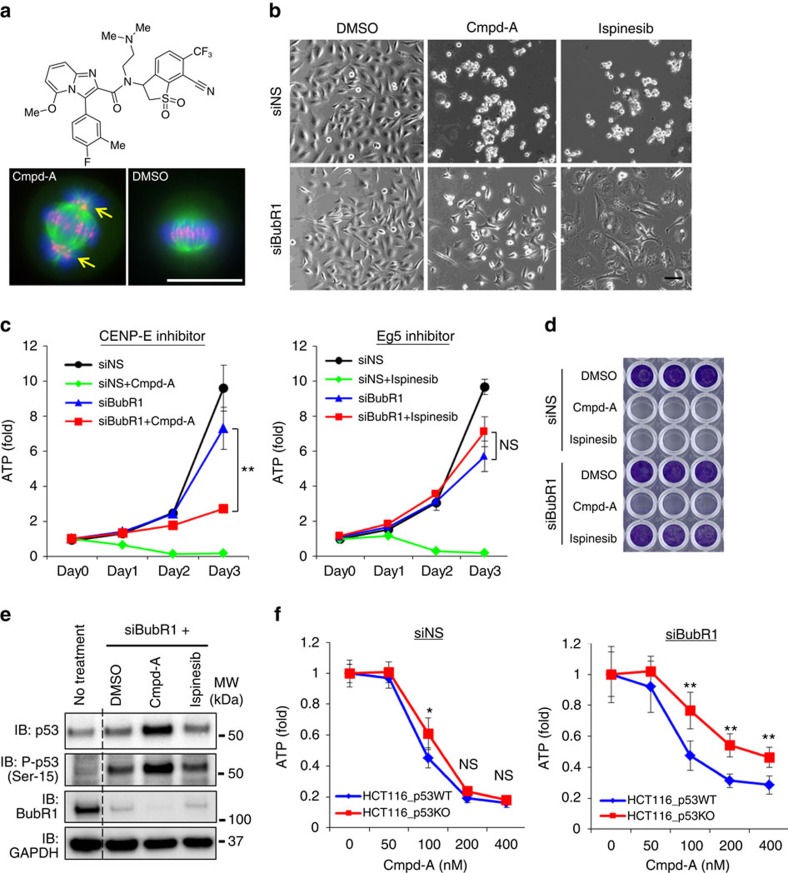
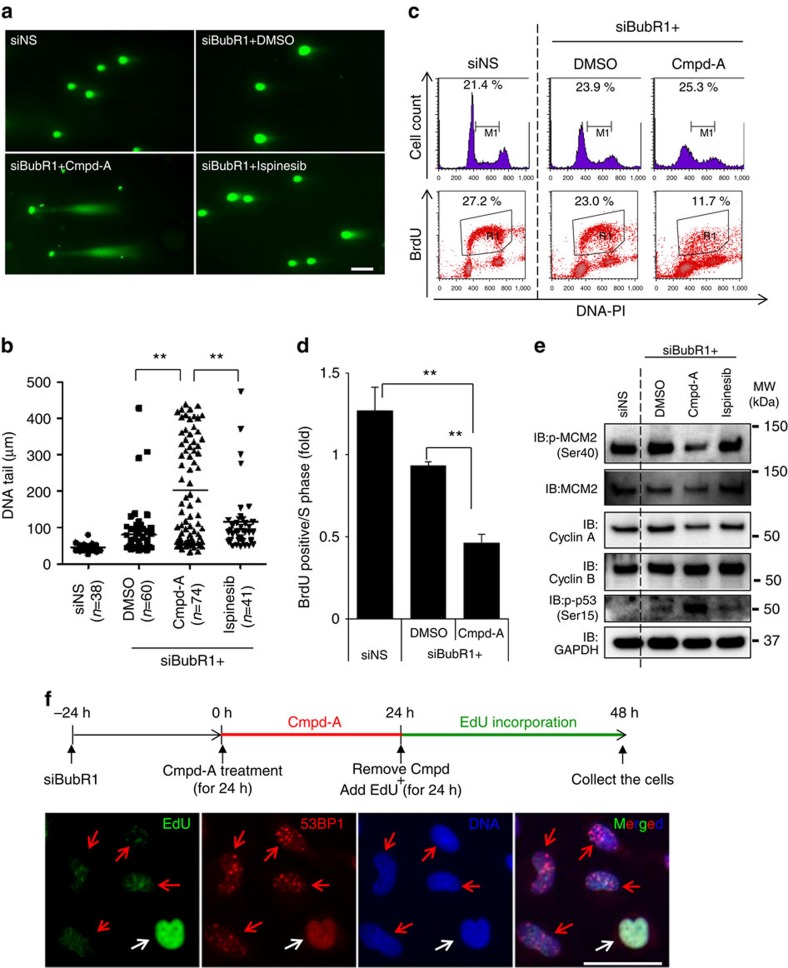
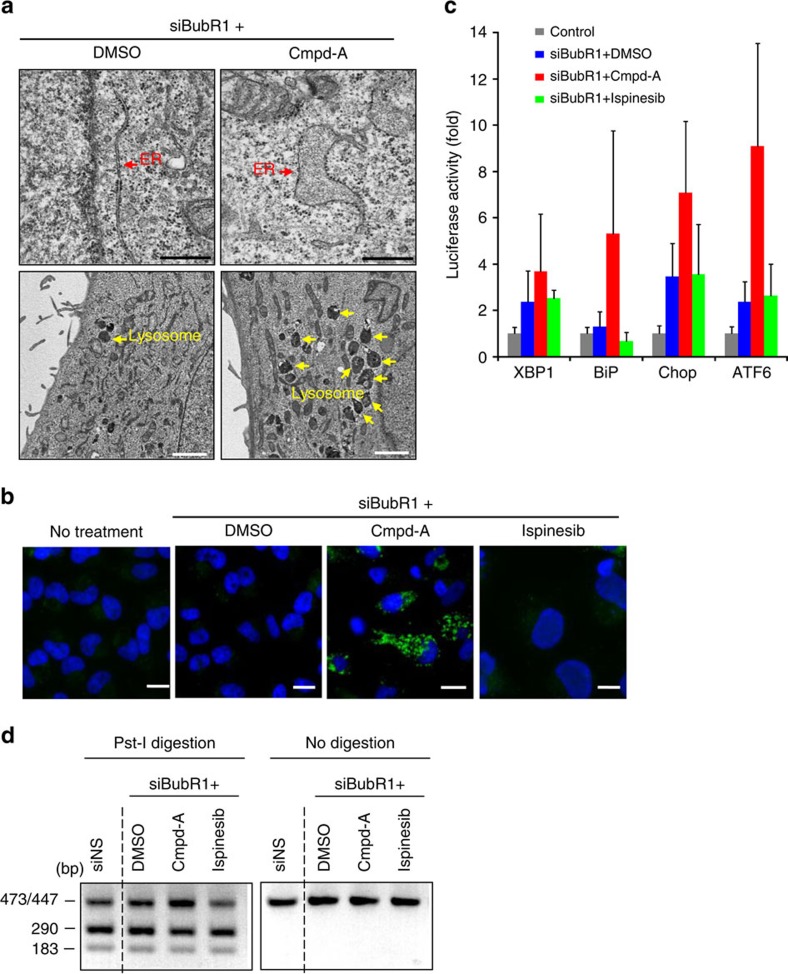
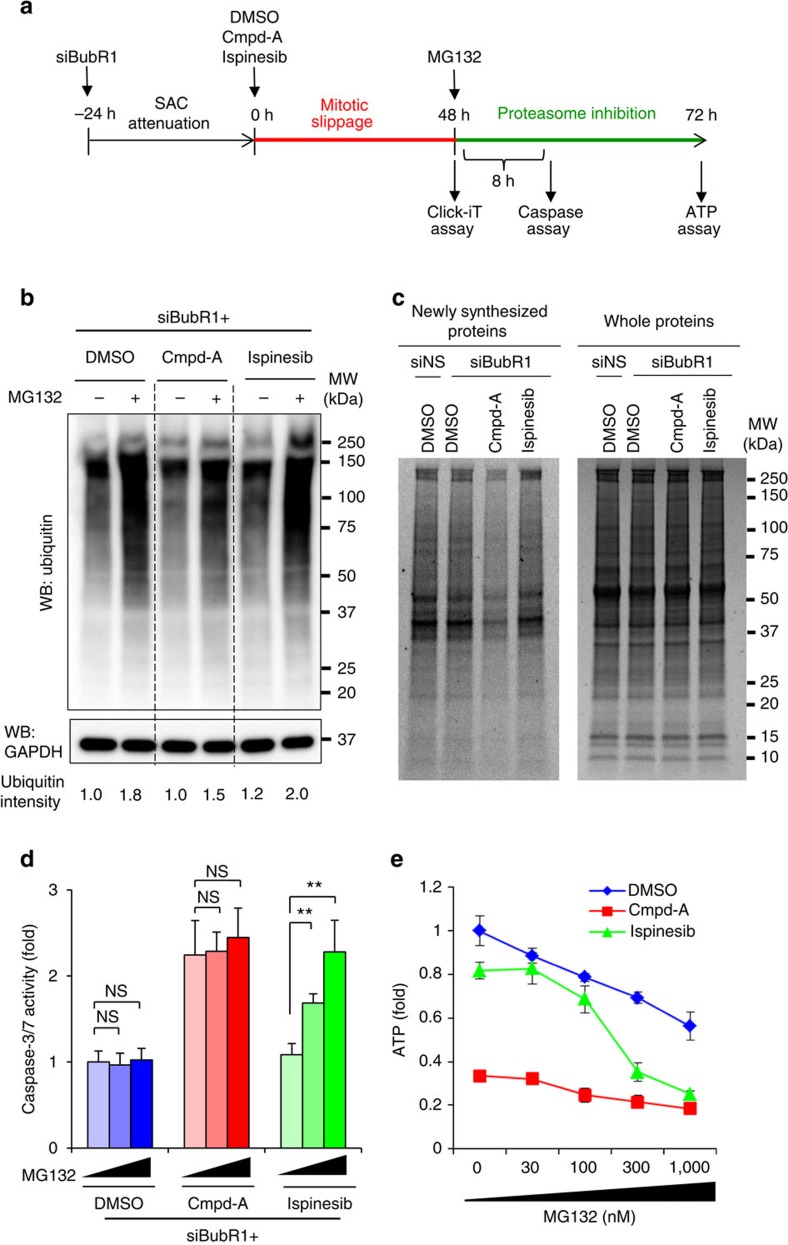
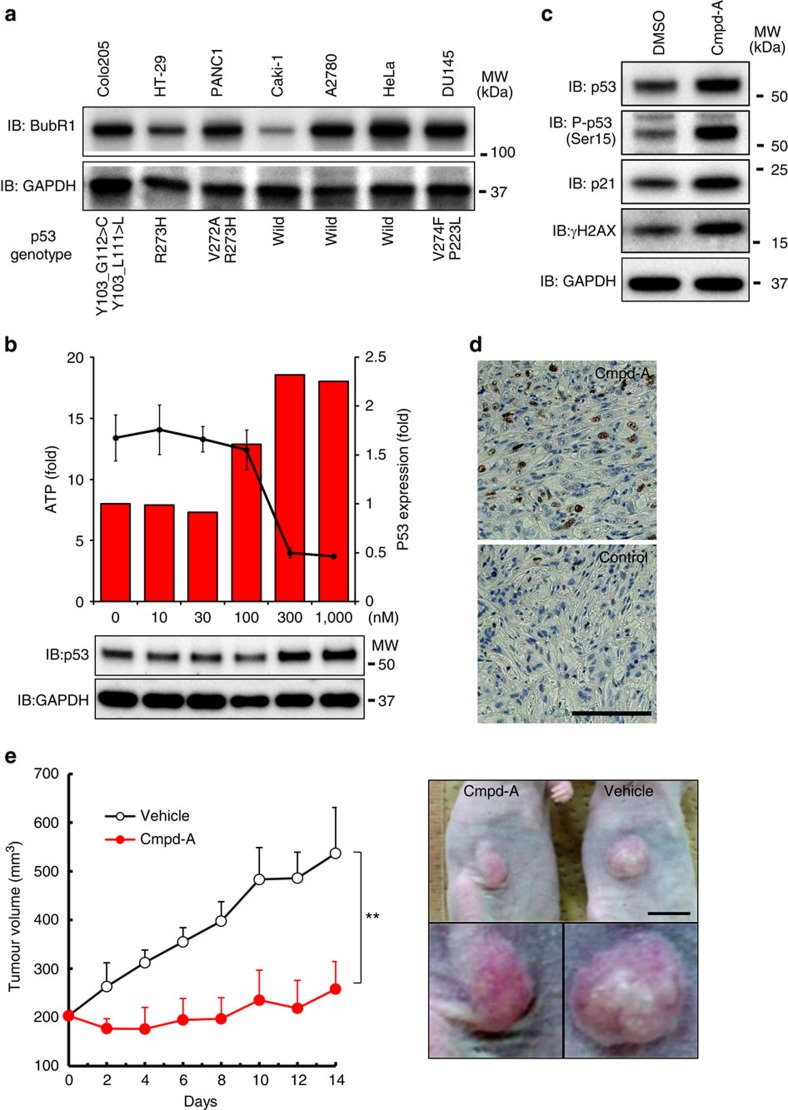
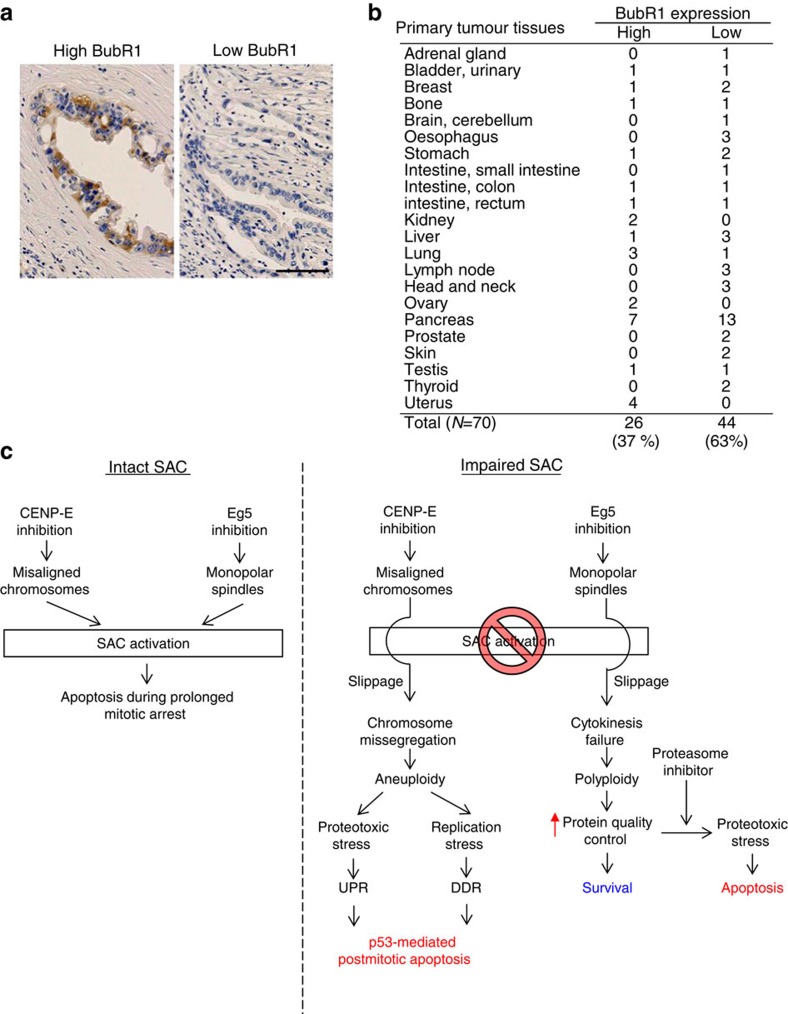
The molecular mechanism responsible that determines cell fate after mitotic slippage is unclear. Here we investigate the post-mitotic effects of different mitotic aberrations--misaligned chromosomes produced by CENP-E inhibition and monopolar spindles resulting from Eg5 inhibition. Eg5 inhibition in cells with an impaired spindle assembly checkpoint (SAC) induces polyploidy through cytokinesis failure without a strong anti-proliferative effect. In contrast, CENP-E inhibition causes p53-mediated post-mitotic apoptosis triggered by chromosome missegregation. Pharmacological studies reveal that aneuploidy caused by the CENP-E inhibitor, Compound-A, in SAC-attenuated cells causes substantial proteotoxic stress and DNA damage. Polyploidy caused by the Eg5 inhibitor does not produce this effect. Furthermore, p53-mediated post-mitotic apoptosis is accompanied by aneuploidy-associated DNA damage response and unfolded protein response activation. Because Compound-A causes p53 accumulation and antitumour activity in an SAC-impaired xenograft model, CENP-E inhibitors could be potential anticancer drugs effective against SAC-impaired tumours.


Figures

Figure 1
Figure 1. Post-mitotic growth inhibition and chromosome missegregation caused by siCENP-E and siBubR1.
(a) Immunoblotting of BubR1 in HeLa cells transfected with siCENP-E and siEg5. The upper band in the BubR1 rectangle represents phosphorylated BubR1. (b) Anti-proliferative effects of siCENP-E in siBubR1-transfected HeLa cells. Cells transfected with the indicated siRNA were collected on days 1–4 after transfection. Relative ATP levels were calculated based on luminescence in comparison with the day-1 luminescence value (control). The line plots represent mean±s.d. (n=3). ATP levels on day 4 were statistically analysed using Student's t-test for comparison between siCENP-E+siBubR1- and siNS-transfected cells or between siEg5+siBubR1- and siNS-transfected cells. Differences were considered significant at P≤0.05 (*) and P≤0.01 (**). (c) Representative images of crystal violet staining in HeLa cells transfected with the indicated siRNAs. Cells were collected on day 3 after transfection for crystal violet staining. (d) Time-lapse microscopy of HeLa cells transfected with siNS (upper row), siCENP-E+siBubR1 (middle row) or siEg5+siBubR1 (lower row). Time point t=0 indicates the onset of mitosis. Arrows indicate cells undergoing mitosis. White bars indicate 20 μm. (e) Quantification of the >4N DNA population was determined by FACS analysis on days 2 and 4 after siRNA transfection. Data are presented as mean±s.d. (n=3). (f) Micronuclei and lagging chromosomes in siCENP-E- and siBubR1-transfected HeLa cells. Green, red and blue signals indicate α-tubulin, CENP-B and DAPI, respectively. White and yellow arrows denote the micronuclei and lagging chromosomes, respectively. White bars indicate 20 μm. (g,h) Fluorescence in situ hybridization (FISH) analysis using centromeric probes. FISH analysis using centromeric probes for Chr-17 was performed 48 h after siRNA transfection (red, Chr-17 centromeres; blue, DNA). Representative FISH images of cells transfected with siNS or siCENP-E+siBubR1 (g). White bars indicate 10 μm. The graph shows quantitative FISH analysis (blue, siNS-transfected cells (n=139); red, siCENP-E+siBubR1-transfected cells (n=139); h).
Figure 2
Figure 2. Failure of cytokinesis restores cell viability in siCENP-E+siBubR1-transfected cells.
(a) Phase-contrast microscopy images of CENP-E, BubR1 and MKLP2 triple-knockdown cells. Images were acquired 3 days after siRNA transfection. White bars indicate 100 μm. (b) The >4N DNA population was quantified by FACS analysis 48 h after siRNA transfection. Data are presented as mean±s.d. (n=3). (c) Proliferative effect of siMKLP2 in siCENP-E+siBubR1-transfected HeLa cells. The cells were transfected with the indicated siRNAs. Cell growth was evaluated as indicated in Fig. 1b. The line plots represent mean±s.d. (n=3). ATP levels on day 4 were statistically analysed using Student's t-test for comparisons between siCENP-E+siBubR1+siMKLP2- and siCENP-E+siBubR1-transfected cells. Differences were considered significant at P≤0.05 (*) and P≤0.01 (**). (d) Representative images of crystal violet staining in HeLa cells transfected with the indicated siRNAs. Cells were collected on day 3 after transfection. (e) Apoptotic effect of siMKLP2 in siCENP-E+siBubR1-transfected HeLa cells. Relative caspase-3/7 activities were calculated based on the luminescence in comparison with the day-1 luminescence value (control). The line plots represent mean±s.d. (n=3). Caspase-3/7 activities on day 3 were statistically analysed using Student's t-test for comparison between siCENP-E+siBubR1+siMKLP2- and siCENP-E+siBubR1-transfected cells. Differences were considered significant at P≤0.05 (*) and P≤0.01 (**). (f,g) Proliferative effect of the knockdown of SAC-associated genes in siCENP-E- or siEg5-transfected HeLa cells. The cells were transfected with siCENP-E (e) or siEg5 (f) in combination with the indicated siRNAs. Cell growth was evaluated as indicated in Fig. 1b. The line plots represent mean±s.d. (n=3).
Figure 3
Figure 3. Comprehensive gene expression analysis in siCENP-E+siBubR1-transfected cells.
(a) Microarray analysis of the transcriptome of HeLa cells transfected with the indicated siRNAs. (Left) Hierarchical cluster analysis of 886 transcript expression profiles. Each row represents a single transcript. Red and green: relatively high and low expression, respectively. (Right) Venn diagrams. ‘Upregulated' and ‘Downregulated': >2-fold increase and >2-fold decrease, respectively, in the expression of the indicated transcripts compared with siNS-transfected cells. (b) Venn diagram-related to p53 pathways. ‘Upregulated': >2-fold increase in the levels of 343 p53-regulated transcripts compared with siNS-transfected cells. (c) Quantitative RT–PCR analysis of GAD45A in HeLa cells 72 h after transfection. GAD45A expression ratios were quantified using GAPDH expression. Data are presented as mean±s.d. (n=3). (d) Protein expression of p53 in siCENP-E+siBubR1-transfected cells on day 3 after transfection. (e) Pathway analysis. The network was generated by Ingenuity Pathway Analysis (Ingenuity Systems, http://www.ingenuity.com) using p53 and 434 upregulated and 317 downregulated genes in siCENP-E+siBubR1-transfected cells. (f) Effect of p53 on caspase-3/7 activity in siCENP-E+siBubR1-transfected cells. Black and red bars: siCENP-E+siBubR1-transfected and siCENP-E+siBubR1+sip53-transfected cells, respectively. Cells were collected on day 3 after transfection. Caspase-3/7 activities were evaluated as indicated in Fig. 2e. Data are presented as mean±s.d. (n=3). Student's t-test was used to compare siCENP-E+siBubR1+sip53- and siCENP-E+siBubR1-transfected cells. Differences were considered significant at P≤0.05 (*) and P≤0.01 (**). (g) Effect of p53 on caspase-3/7 activity in siCENP-E+siBubR1-transfected SK-BR3 cells. Cells were collected on days 3 (blue) and 4 (red) after transfection. Caspase-3/7 activities were evaluated as indicated in Fig. 2e. Data are presented as mean±s.d. (n=3). Statistical analysis was performed using Student's t-test. Differences were considered significant at P≤0.05 (*) and P≤0.01 (**). (h) Caspase-3/7 activation by siCENP-E+siBubR1 in p53-wild-type and p53-knockout HCT116 cells on day 3 after transfection. Caspase-3/7 activities were evaluated as indicated in Fig. 2e. Data are presented as mean±s.d. (n=3). Statistical analysis was performed using Student's t-test. Differences were considered significant at P≤0.05 (*) and P≤0.01 (**).
Figure 4
Figure 4. Pharmacological inhibition of CENP-E causes p53-associated suppression of proliferation in SAC-impaired cells but not in SAC-intact cells.
(a) Chemical structure of Cmpd-A (Upper) and misaligned chromosomes in HeLa cells with Cmpd-A treatment (Lower). Green, red and blue signals indicate α-tubulin, CENP-B and DAPI, respectively. Yellow arrows denote the misaligned chromosomes. White bars indicate 20 μm. (b) Phase-contrast microscopy images of siNS- and siBubR1-transfected cells treated with DMSO, Cmpd-A and ispinesib. Twenty-four hours after siRNA treatment, the cells were treated with DMSO, Cmpd-A (200 nM) or ispinesib (10 nM). Images were acquired 48 h after drug treatment. The black bar indicates 100 μm. (c) Anti-proliferative effect of Cmpd-A and ispinesib in siBubR1-transfected HeLa cells. Twenty-four hours after siRNA treatment, the cells were treated with DMSO, Cmpd-A (200 nM) or ispinesib (10 nM) (day 0). Cell growth was evaluated as indicated in Fig. 1b. The line plots represent mean±s.d. (n=3). ATP levels on day 3 were statistically analysed using Student's t-test for comparison between siBubR1+Cmpd-A- and siBubR1-transfected cells and between siBubR1+ispinesib- and siBubR1-transfected cells. Differences were considered significant at P≤0.05 (*) and P≤0.01 (**). (d) Representative images of crystal violet staining in siNS- and siBubR1-transfected cells treated with DMSO, Cmpd-A and ispinesib. Twenty-four hours after siRNA treatment, the cells were treated with DMSO, Cmpd-A (200 nM) or ispinesib (10 nM). Cells were collected 5 days after drug treatment for crystal violet staining. (e) Immunoblotting of p53 and phospho-p53 in siBubR1-transfected HeLa cells treated with Cmpd-A and ispinesib. Cells were collected 48 h after drug treatment. (f) Anti-proliferative effect of Cmpd-A with or without siBubR1 in p53-wild-type and p53-knockout HCT116 cells. Twenty-four hours after siRNA treatment, the cells were treated with Cmpd-A at the indicated concentrations. Cells were collected on day 3 after drug treatment for the ATP assay. Relative ATP levels were calculated based on luminescence in comparison with the luminescence value for 0 nM treatment. The line plots represent mean±s.d. (n=3). Statistical analysis was performed using Student's t-test. Differences were considered significant at P≤0.05 (*) and P≤0.01 (**).
Figure 5
Figure 5. CENP-E inhibition causes replication stress-mediated DSBs under SAC-impaired conditions.
(a) Representative images of the neutral comet assay in siBubR1+Cmpd-A-treated cells. Twenty-four hours after siRNA treatment, the cells were treated with DMSO, Cmpd-A (200 nM) or ispinesib (10 nM) for 72 h. The white bar indicates 100 μm. (b) Quantification of DNA tails in the neutral comet assay. The length of DNA tails in microscopy images was quantified by AxioVision. Statistical analysis was performed using Student's t-test. Differences were considered significant at P≤0.01 (**). (c) Cell cycle analysis in siBubR1+Cmpd-A-treated cells. Twenty-four hours after siRNA treatment, the cells were treated with DMSO, Cmpd-A (200 nM) or ispinesib (10 nM) for 72 h. BrdU was incorporated into the drug-treated cells for 15 min, and then the cells were collected for FACS analysis. Representative data are shown. (d) Replication activity in the S phase in siBubR1+Cmpd-A-treated cells. BrdU-positive cells (R1) were normalized to the S phase cells (M1). Data are presented as mean±s.d. (n=3).Statistical analysis was performed using Student's t-test. Differences were considered significant at P≤0.05 (*) and P≤0.01 (**). (e) Immunoblotting of replication-regulating and G2 phase proteins in siBubR1+Cmpd-A-treated cells. Cells were collected 72 h after drug treatment. (f) Correlation between 53BP1 foci formation and EdU incorporation. Schematics of the experiments are shown (above the panels). Red and white arrows indicate 53BP1 foci-positive and 53BP1 foci-negative cells, respectively. The white bar indicates 50 μm.
Figure 6
Figure 6. Aneuploidy-associated proteotoxic stress is accompanied by p53 accumulation after mitotic slippage.
(a) Electron microscopy images of the ER (upper panels, red arrows) and lysosome (lower panels, yellow arrows) in siBubR1+Cmpd-A-treated HeLa cells. Twenty-four hours after siRNA treatment, the cells were treated with Cmpd-A (200 nM) or DMSO for 48 h. Black and white bars indicate 500 nm and 2 μm, respectively. (b) Immunofluorescence of LC3B in siBubR1+DMSO-, siBubR1+Cmpd-A- and siBubR1+ispinesib-treated HeLa cells. White bars indicate 20 μm. (c) Transcriptional reporter activities of XBP1, BiP, Chop and ATF6 in siBubR1+Cmpd-A-treated HeLa cells. Transfection with siRNA was performed 24 h before drug treatment, and the cells were treated with DMSO, Cmpd-A (200 nM) or ispinesib (10 nM) for 72 h. Relative luciferase activities were calculated based on the luminescence values in comparison with siNS-transfected cells. Data are presented as mean±s.d. (n=3). (d) XBP1 splicing assay. cDNA was treated with (left) or without (right) Pst-I. The undigested upper band (473/447 bp) and the digested lower bands (290 and 183 bp) represent spliced and unspliced XBP1, respectively.
Figure 7
Figure 7. siBubR1+Cmpd-A aneuploid cells decrease global protein translation to reduce the response to the proteasome inhibitor MG132.
(a) Schematics of the MG132 treatment experiments. (b) Global protein ubiquitination by MG132 in siBubR1+DMSO-, siBubR1+Cmpd-A- and siBubR1+ispinesib-treated HeLa cells. (c) Newly synthesized protein in siBubR1+DMSO-, siBubR1+Cmpd-A- and siBubR1+ispinesib-treated HeLa cells. Left and right gels show newly synthesized proteins detected by the Click-iT assay (Life Technologies) and all proteins detected by CBB staining as a loading control, respectively. (d) Effect of MG132 on caspase-3/7 activity in siBubR1+DMSO-, siBubR1+Cmpd-A- and siBubR1+ispinesib-treated HeLa cells. Blue, red and green bars indicate siBubR1+DMSO-, siBubR1+Cmpd-A- and siBubR1+ispinesib-treated HeLa cells, respectively. Relative caspase-3/7 activities were calculated in comparison with the activities in siBubR1+DMSO-treated cells. Statistical analysis was performed using Student's t-test. Differences were considered significant at P≤0.05 (*) and P≤0.01 (**). (e). Effect of MG132 on cell proliferation in siBubR1+DMSO-, siBubR1+Cmpd-A- and siBubR1+ispinesib-treated HeLa cells. Blue, red and green lines indicate siBubR1+DMSO-, siBubR1+Cmpd-A- and siBubR1+ispinesib-treated HeLa cells, respectively. Relative ATP levels were calculated in comparison with those in siBubR1+DMSO-treated cells. Relative ATP levels were calculated based on luminescence in comparison with the luminescence value for 0-nM treatment. The line plots represent mean±s.d. (n=3).
Figure 8
Figure 8. Cmpd-A increases tumour resistance in SAC-impaired Caki-1 cells in vitro and in vivo.
(a) BubR1 downregulation in SAC-impaired Caki-1 cells. The COSMIC database was used for p53 genotyping of each cell line. (b) Anti-proliferative activity of Cmpd-A (black line) and p53 accumulation (red bars) in Caki-1. p53 levels were quantified using immunoblotting results. The line plots represent mean±s.d. (n=3). (c) p53 accumulation and DSBs in Caki-1 cells after Cmpd-A treatment. Cells were collected 48 h after treatment. (d) IHC of p53 in Caki-1 xenografts. Mice were administered 100 mg kg−1 Cmpd-A twice (0 and 8 h). The tumours were collected 24 h after the first administration. The white bar indicates 100 μm. (e) The antitumour efficacy of Cmpd-A in the Caki-1 xenograft models (right). The line plots represent mean±s.d. (n=5). The representative xenografts on day 8 after administration are shown (left). The black bar indicates 1 cm.
Figure 9
Figure 9. IHC of BubR1 in primary tumour tissues.
(a) IHC of BubR1 in primary pancreatic tumours. The representative images of high (left panel) and low expression (right panel) of BubR1 are shown. The black bar indicates 100 μm. (b) Summary of IHC of BubR1 in 70 different tumour tissues. The tissue microarrays were purchased from BioChain Institute Inc. (c) Schematics of aneuploidy-mediated apoptosis after mitotic slippage.

References

    1. Musacchio A. & Salmon E. D. The spindle-assembly checkpoint in space and time. Nat. Rev. Mol. Cell Biol. 8, 379–393 (2007). - PubMed
    1. Wassmann K. & Benezra R. Mitotic checkpoints: from yeast to cancer. Curr. Opin. Genet. Dev. 11, 83–90 (2001). - PubMed
    1. Cleveland D. W., Mao Y. & Sullivan K. F. Centromeres and kinetochores: from epigenetics to mitotic checkpoint signaling. Cell 112, 407–421 (2003). - PubMed
    1. Kulukian A., Han J. S. & Cleveland D. W. Unattached kinetochores catalyze production of an anaphase inhibitor that requires a Mad2 template to prime Cdc20 for BubR1 binding. Dev. Cell 16, 105–117 (2009). - PMC - PubMed
    1. Topham C. H. & Taylor S. S. Mitosis and apoptosis: how is the balance set? Curr. Opin. Cell Biol. 25, 780–785 (2013). - PubMed

Publication types

MeSH terms

Associated data