Let me Google that for you: a time series analysis of seasonality in internet search trends for terms related to foot and ankle pain
- PMID: 26146521
- PMCID: PMC4490673
- DOI: 10.1186/s13047-015-0074-9
Let me Google that for you: a time series analysis of seasonality in internet search trends for terms related to foot and ankle pain
Abstract
Background: The analysis of internet search traffic may present the opportunity to gain insights into general trends and patterns in information seeking behaviour related to medical conditions at a population level. For prevalent and widespread problems such as foot and ankle pain, this information has the potential to improve our understanding of seasonality and trends within these conditions and their treatments, and may act as a useful proxy for their true incidence/prevalence characteristics. This study aimed to explore seasonal effects, general trends and relative popularity of internet search terms related to foot and ankle pain over the past decade.
Methods: We used the Google Trends tool to obtain relative search engine traffic for terms relating to foot and ankle pain and common treatments from Google search and affiliated pages for major northern and southern hemisphere English speaking nations. Analysis of overall trends and seasonality including summer/winter differences was carried out on these terms.
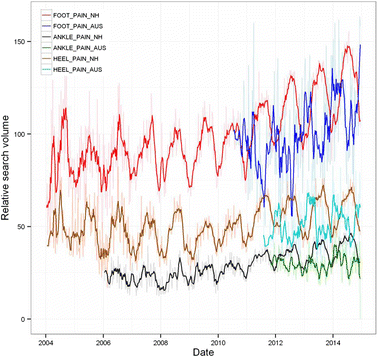
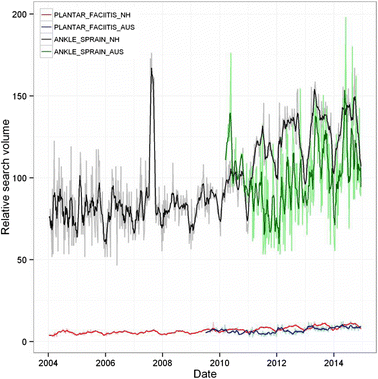
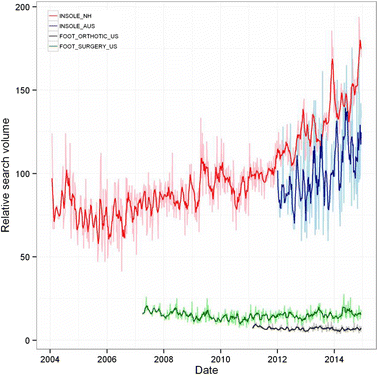
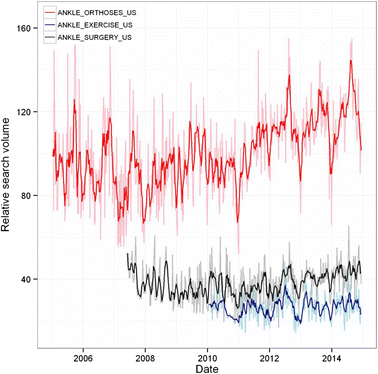
Results: Searches relating to general foot pain were on average 3.4 times more common than those relating to ankle pain, and twice as common as searches relating to heel pain. Distinct seasonal effects were seen in the northern hemisphere, with large increases in search volumes in the summer months compared to winter for foot (p = 0.004, 95 % CI [22.2-32.1]), ankle (p = 0.0078, 95 % CI [20.9-35.5]), and heel pain (p = 0.004, 95 % CI [29.1-45.6]). These seasonal effects were reflected by data from Australia, with the exception of ankle pain. Annual seasonal effects for treatment options were limited to terms related to foot surgery and ankle orthoses (p = 0.031, 95 % CI [3.5-20.9]; p = 0.004, 95 % CI [7.6-25.2] respectively), again increasing in the summer months.
Conclusions: A number of general trends and annual seasonal effects were found in time series internet search data for terms relating to foot and ankle pain. This data may provide insights into these conditions at population levels.
Keywords: Foot pain; Google Trends; ankle pain; ankle sprain; foot orthotics; insoles; plantar faciitis.
Figures


References
-
- Rupp I, Boshuizen HC, Dinant HJ, Jacobi CE, van den Bos GAM: Disability and health-related quality of life among patients with rheumatoid arthritis: association with radiographic joint damage, disease activity, pain, and depressive symptoms. Scand J Rheumatol. 2006;35:175–81. - PubMed
-
- Hawley DJ, Wolfe F, Lue FA, Moldofsky H. Seasonal symptom severity in patients with rheumatic diseases: a study of 1,424 patients. J Rheumatol. 2001;28:1900–1909. - PubMed
-
- O’Connell SE, Griffiths PL, Clemes SA: Seasonal variation in physical activity, sedentary behaviour and sleep in a sample of UK adults. Ann Hum Biol. 2014;41:1–8. - PubMed
LinkOut - more resources
Full Text Sources
Other Literature Sources
Miscellaneous

