

Growth-dependent bacterial susceptibility to ribosome-targeting antibiotics
- PMID: 26146675
- PMCID: PMC4380930
- DOI: 10.15252/msb.20145949
Growth-dependent bacterial susceptibility to ribosome-targeting antibiotics
Abstract
Bacterial growth environment strongly influences the efficacy of antibiotic treatment, with slow growth often being associated with decreased susceptibility. Yet in many cases, the connection between antibiotic susceptibility and pathogen physiology remains unclear. We show that for ribosome-targeting antibiotics acting on Escherichia coli, a complex interplay exists between physiology and antibiotic action; for some antibiotics within this class, faster growth indeed increases susceptibility, but for other antibiotics, the opposite is true. Remarkably, these observations can be explained by a simple mathematical model that combines drug transport and binding with physiological constraints. Our model reveals that growth-dependent susceptibility is controlled by a single parameter characterizing the ‘reversibility’ of ribosome-targeting antibiotic transport and binding. This parameter provides a spectrum classification of antibiotic growth-dependent efficacy that appears to correspond at its extremes to existing binary classification schemes. In these limits, the model predicts universal, parameter-free limiting forms for growth inhibition curves. The model also leads to nontrivial predictions for the drug susceptibility of a translation mutant strain of E. coli, which we verify experimentally. Drug action and bacterial metabolism are mechanistically complex; nevertheless, this study illustrates how coarse-grained models can be used to integrate pathogen physiology into drug design and treatment strategies.
Figures
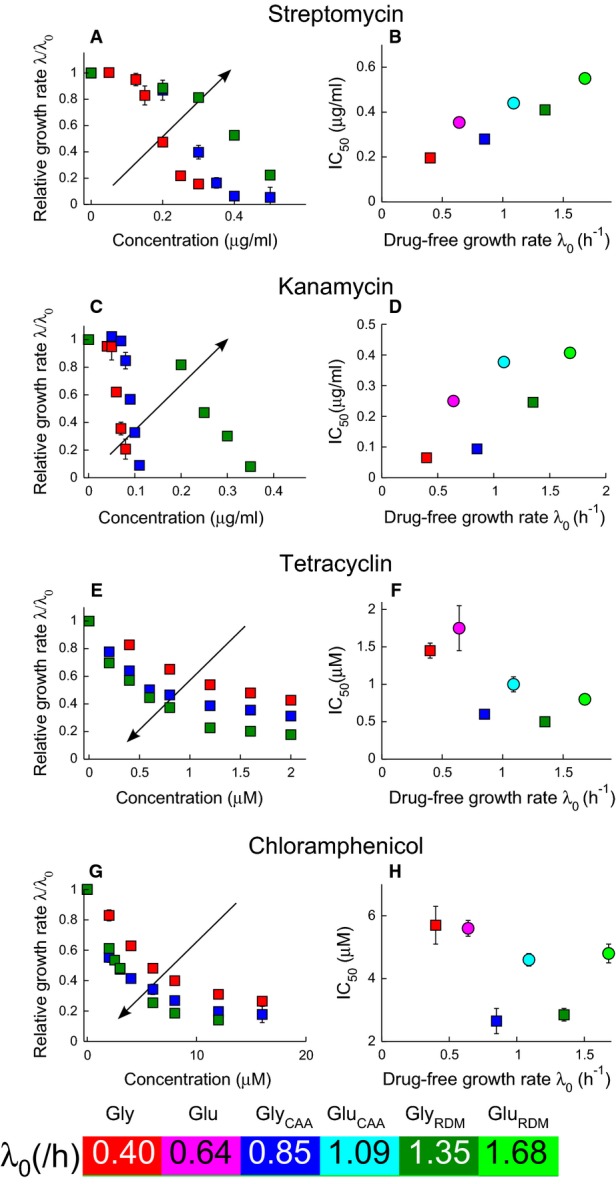
A-H Irreversibly binding antibiotics streptomycin (A and B) and kanamycin (C and D), and reversibly binding antibiotics tetracycline (E and F) and chloramphenicol (G and H). The left panels show the growth rate λ of E. coli MG1655 relative to the drug-free growth rate λ0, as a function of the antibiotic concentration. Growth inhibition data are shown for media with glycerol as the carbon source. The arrows indicate increasing drug-free growth rate λ0. The right panels show the half-inhibition concentration IC50 as a function of the drug-free growth rate λ0. Carbon sources are denoted by symbol: glucose (circles) and glycerol (squares), and error bars denote the standard deviation among repeated measurements (Supplementary Tables S2 and S3). Media are variants of Neidhardt's MOPS buffered medium (Neidhardt et al, 1974); see Materials and Methods for details. Where error bars are not visible, they are smaller than the symbols. Both sample growth curves and growth inhibition data are provided in the Supplementary Information.
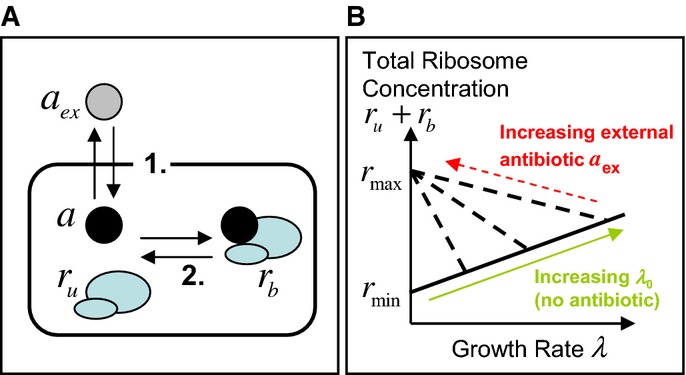
The model is focused on three state variables: the intracellular concentration of antibiotic a, the concentration ru of ribosomes unbound by antibiotic and the concentration rb of antibiotic-bound ribosomes. Two mechanisms drive the dynamics: 1. Transport across the cell membrane and 2. Binding of ribosomes and antibiotic.
Constraints arising from empirical relations between ribosome content and growth rate. Scott et al (2010) measured total ribosome content as a function of growth rate. When growth rate is varied by nutrient composition, in the absence of antibiotics, ribosome content ru correlates positively with growth rate λ, increasing linearly from a minimum concentration of inactive ribosomes rmin (solid line). When growth rate is decreased by imposing translational inhibition, total ribosome content rtot = ru + rb increases, reaching a maximum rmax as growth rate decreases to zero (dashed lines). Note that Scott et al measured ribosome mass fraction; here, we translate these to concentrations (see Supplementary Information, Supplementary Fig S1).
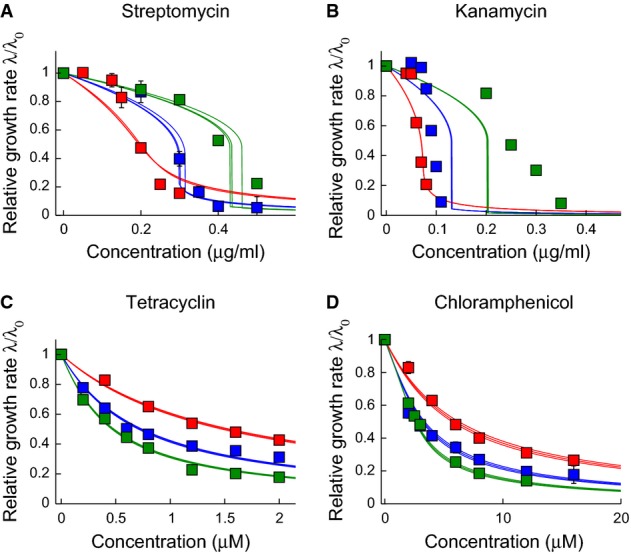
A-D The parameters
 and
and  are obtained by numerical fitting of the solution of the cubic equation 7, to our experimental growth inhibition curves. Data sets for different drug-free growth rates (i.e. the different curves in each panel) were fitted simultaneously with the same values of
  and
and  , but separate fits were obtained for glycerol-based and glucose-based media. Here, we show the resulting fits for glycerol-based media (symbols as in Fig1). For each fit, the bold line shows the best fit to the data, while the narrow lines represent 95% confidence intervals on the value of the parameter
  . To obtain these intervals (as well as the error bars on the fits for
  and
and  ), we performed fits on 1000 randomized data sets generated by sampling within the experimental error ranges on the measured growth inhibition data. The parameters obtained by our fitting procedure are as follows: streptomycin and glycerol:
  h−1,
h−1,  µg ml−1; streptomycin and glucose:
  h−1,
h−1,  µg ml−1; kanamycin and glycerol:
  h−1,
h−1,  µg ml−1; kanamycin and glucose:
  h−1,
h−1,  µg ml−1; tetracycline and glycerol:
  h−1,
h−1,  µM; tetracycline and glucose:
  h−1,
h−1,  µM; chloramphenicol and glycerol:
  h−1,
h−1,  µM; chloramphenicol and glucose:
  h−1,
h−1,  µM. These values of
  and
and  are compared to literature data in Supplementary Table S4. Similar results are obtained if we instead fit our data directly to the predicted universal relation for IC50(λ0) (equation 10); see Supplementary Information and Supplementary Fig S4. Where error bars are not visible, they are smaller than the symbol size.
 and
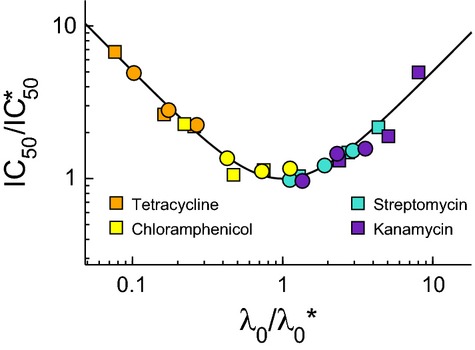
and  , obtained by fitting our growth inhibition data (Fig3 and Supplementary Fig S3). The black line shows the model prediction for the universal curve, equation 10.
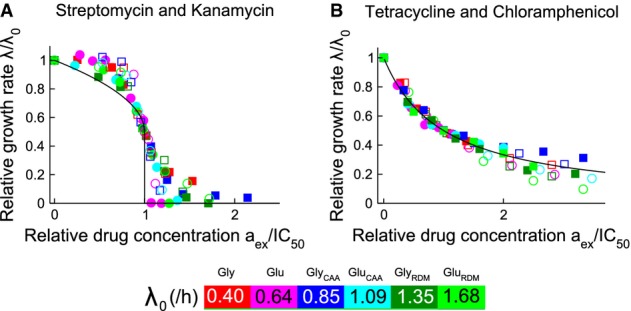
Data for the bactericidal antibiotics streptomycin (closed symbols) and kanamycin (open symbols) collapse onto
 (black line)
Data for the bacteriostatic antibiotics tetracycline (closed symbols) and chloramphenicol (open symbols) collapse onto λ/λ0 = 1/[1+aex/IC50] (black line).
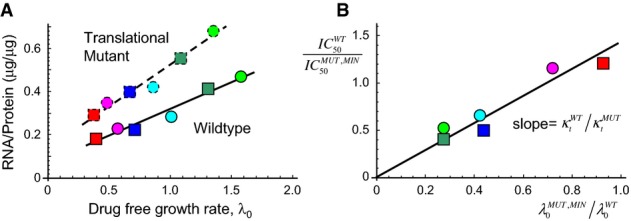
The mutant shows a reduced translational capacity compared to the wild-type strain. Translational capacity is given as the inverse slope of a plot of the RNA/protein ratio versus drug-free growth rate λ0 (Scott et al, 2010). The data for the mutant are from this study (dashed line); wild-type data are taken from Scott et al (2010) (solid line). The ratio of slopes (WT/MUT) gives the ratio of translational capacity
 (Supplementary Table S5). The coloured symbols indicate different growth media, as in Fig1.
Growth-dependent susceptibility to tetracycline for the translation mutant. The model predicts that for a reversible drug such as tetracycline, IC50 =
 , so that
  (since both
  and
and  are proportional to
  ). The symbols show
  measured on all 6 growth media, divided by the
  measured on glucose minimal or glycerol minimal medium as appropriate, and the drug-free growth rate of the wild-type
  similarly rescaled with respect to the drug-free growth rate of the mutant in the corresponding minimal medium
  . The data collapse onto a straight line with gradient (1/0.65), as indicated by the solid black line. It is important to note that the solid line is not a line-of-best-fit, but rather comes from taking the ratio of the slopes in panel A.
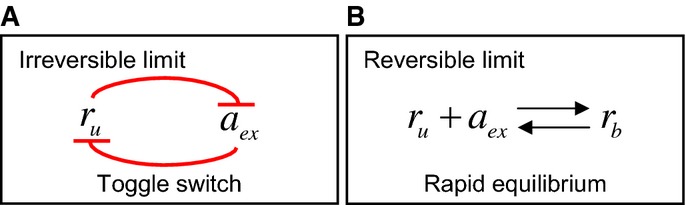
In the limit that either transport or binding is irreversible (as is the case for streptomycin and kanamycin), the system exhibits a ‘toggle-switch’ topology, leading to a steep inhibition curve (equation 11).
In the limit of fully equilibrated transport and binding (as is the case for tetracycline and chloramphenicol), the model predicts more gradual inhibition (equation 12).
References
-
- Bennett PM, Maaloe O. The effects of fusidic acid on growth, ribosome synthesis and RNA metabolism in Escherichia coli. J Mol Biol. 1974;90:541–561. - PubMed
-
- Benthin S, Nielsen J, Villadsen J. A simple and reliable method for the determination of cellular RNA-content. Biotechnol Tech. 1991;5:39–42.
-
- Berens C. 2001. Tetracyclines and RNA. In Schroeder R (ed.) RNA-Binding Antibiotics. Landes Bioscience.
Publication types
MeSH terms
Substances
LinkOut - more resources
Full Text Sources
Other Literature Sources
Medical
