. 2015 Aug;16(8):819-828.
doi: 10.1038/ni.3215. Epub 2015 Jun 29.

Inflammation-induced formation of fat-associated lymphoid clusters

Affiliations

Inflammation-induced formation of fat-associated lymphoid clusters

Cécile Bénézech et al. Nat Immunol. 2015 Aug.

Abstract

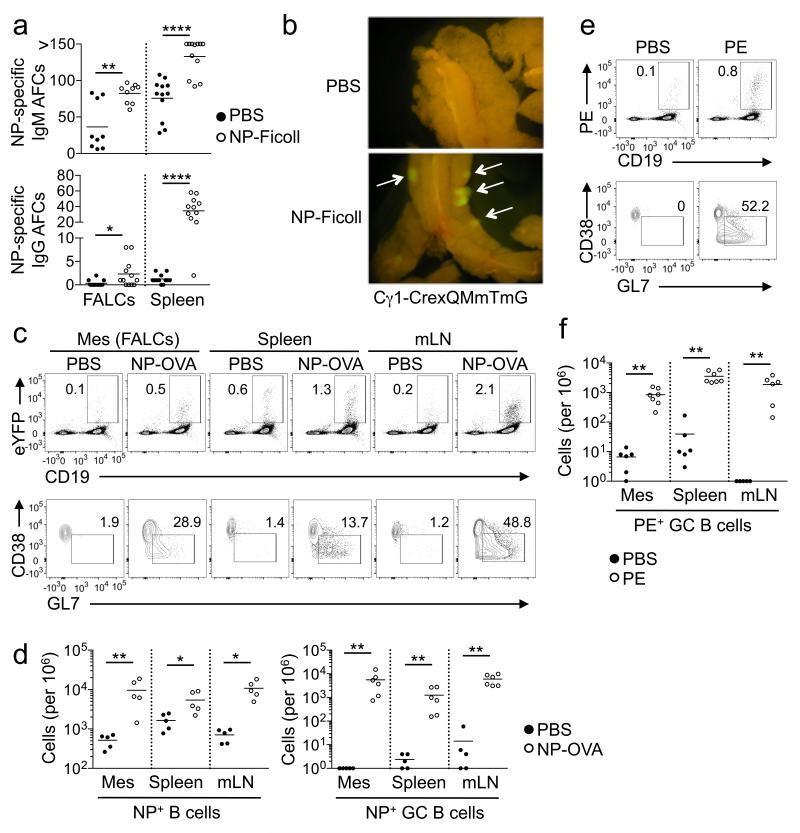
Fat-associated lymphoid clusters (FALCs) are a type of lymphoid tissue associated with visceral fat. Here we found that the distribution of FALCs was heterogeneous, with the pericardium containing large numbers of these clusters. FALCs contributed to the retention of B-1 cells in the peritoneal cavity through high expression of the chemokine CXCL13, and they supported B cell proliferation and germinal center differentiation during peritoneal immunological challenges. FALC formation was induced by inflammation, which triggered the recruitment of myeloid cells that expressed tumor-necrosis factor (TNF) necessary for signaling via the TNF receptors in stromal cells. Natural killer T cells (NKT cells) restricted by the antigen-presenting molecule CD1d were likewise required for the inducible formation of FALCs. Thus, FALCs supported and coordinated the activation of innate B cells and T cells during serosal immune responses.


Figures

Figure 1
Figure 1. Distribution of FALCs in VAT
(a) Whole mount immunofluorescence staining of the mesenteries allowing visualization of CD45+ FALCs (green). (b) Density of hematopoietic clusters (number of clusters/g adipose tissue) in the main fat deposits of the peritoneal (omental (n=8 mice), gonadal (n=7) and mesenteric (n=6) adipose tissues) and pleural cavities (mediastinal (n=13) and pericardial (n=8) adipose tissues) and in the subcutaneous fat (n=7). Data points and mean shown. Data pooled from two independent experiments. (c) Whole mount immunofluorescence staining showing a mesenteric FALC with CD11b+ myeloid cells (blue), CD45+ hematopoietic cells (green), IgM+ B cells (red), and CD4+ T cells (white). Picture representative of clusters from multiple independent experiments. (d) Whole mount immunofluorescence staining showing a mesenteric FALC with CD45+ hematopoietic cells (green), CD31+ blood endothelial cells (red) and Lyve-1+ cells (blue). Scale bar 50 μm. Picture representative of 8 clusters from 4 mice in two independent experiments (e) Enumeration of the mesenteric clusters of newborns and animals aged between 1 and 32 weeks (n=5, 5, 5, 5, 7, 18, 7, 7 mice per group). Data representative of three independent experiments. Data points and mean shown.
Figure 2
Figure 2. CXCL13 expression by FALC stromal cells is necessary for B cell recruitment
(a) Real-time PCR analysis of the indicated mRNA in LNs, mesenteric FALCs and adjacent fat (n=5, 4, 5). Mann-Whitney nonparametric two-tailed test between FALCs and fat Cxcl13 p=0.0159, Tnf p=0.0286, Ccl21 p=0.1143, Ltb p=0.0079, Ccl19 p=0.2857, Il7 p=0.0286. (b-c) Numbers of mesenteric clusters in WT, Plt/plt, Ccr7−/−, and Cxcr5−/− mice (n=7, 6, 6, 6 mice per group), (b) and whole mount immunofluorescence staining showing FALCs with CD11b+ myeloid cells (blue), CD45+ hematopoietic cells (green), IgM+ B cells (red), and CD4+ T cells (white) (c) in the indicated mouse strains. Picture representative of 8 clusters from 4 mice from at least 2 independent experiments. (d) Whole-mount immunofluorescence staining showing mesenteric FALCs in the indicated mouse strains with CD45+ hematopoietic cells (green), and CXCL13+ stromal cells (red). Picture representative of 8 clusters from 4 mice from 2 independent experiments. Scale bar 50 μm. *p < 0.05, **p < 0.01 and NS not significant.
Figure 3
Figure 3. B cell activation and differentiation in FALCs upon peritoneal immune challenge
(a) Quantification of NP-specific IgM and IgG antibody-forming cells (AFC) using ELISPOT assays with cells from isolated FALCs and spleens after NP-Ficoll IP immunization of QMxB6 mice. Data correspond to PBS and NP-Ficoll treated mice (n=12,12) pooled from 2 independent experiments using 2.5 × 10⁵ cells per well (n=9 FALCs and 12 spleen). Each symbol represents an individual mouse. Mann-Whitney nonparametric two-tailed test between PBS and NP-Ficoll immunized mice, FALCs IgM p=0.0037, spleen IgM p<0.0001, FALCs IgG p=0.0275 and spleen IgG p<0.0001. (b) Whole-mount immunofluorescence staining of the mesenteries of Cγ1-CrexQMmTmG mice that were immunized with either PBS (all cells red) or NP-Ficoll that results in the generation of IgG1+-switched B cells (green) in FALC. Cγ1-CrexQMmTmG carry one copy of the Cre recombinase in the constant region of the Cγ1 Igh gene, one copy of the NP-specific Igh from QM mice and the membrane Tomato membrane Green (mTmG) reporter. NP immunization induced B cell activation and Ig class switching with the concomitant expression of Cre recombinase that resulted in the membrane reporter switch from IgM (red) to IgG (green). Arrows indicate the presence of B cells that have undergone switching (green). (c-d) Peritoneal lavage cells from QM/QM EYFP+/− mice were transferred by intravenous (IV) injection into C57BL/6J mice 24 h before immunization with Alum-precipitated NP-OVA. (c) Flow cytometric analysis of cells isolated from the mesenteries, spleen and mLN of PBS and NP-OVA-immunized mice showing the percentage of EYFP+CD19+ NP-specific B cells in live CD45+ gate (top) and percentage of CD38GL7+ GC B cells in EYFP+CD19+ NP-specific B cells gate (bottom). (d) Quantification of the cell number of NP-specific B cells (left) and NP-specific GC B cells (right). Data correspond to PBS and NP-OVA treated mice (n=5, 6) pooled from 2 independent experiments. Each symbol represents an individual mouse. Mann-Whitney nonparametric two-tailed test between PBS and NP-OVA treated mice, number of NP+ B cells/1.106 cells in the mesenteries p= 0.0079, spleen p=0.0317, mLN p=0.0079, and number of NP+ GC B cells/1.106 cells in the mesenteries p=0.0043, spleen p=0.0043, mLN p=0.0043. (e-f) C57BL/6J mice were immunized IP with Alum precipitated-PE. (e) Flow cytometric analysis of the mesenteries of naïve and PE immunized mice showing percentages of PE+CD19+ B cells in live CD45+ gate (upper row), and CD38GL7+ GC B cells in PE+CD19+ gate (lower row). (h) Quantification of the cell number of PE+ GC B cells. Data correspond to PBS and PE/Alum immunized mice (n=6, 7) pooled from 2 independent experiments. Mann-Whitney nonparametric two-tailed test between PBS and PE/Alum immunized mice, number of PE+ GC B cells/1.106 cells in the mesenteries p= 0.0043, spleen p=0.0012, mLN p=0.0012 (h). *p < 0.05, **p < 0.01, ***p< 0.001 and ****p <0.0001.
Figure 4
Figure 4. Factors controlling the development of FALCs
(a) Number of mesenteric clusters in the indicated knockout mouse strains. Data correspond to WT, Ltbr−/−, Lta−/−, Rorc−/−, Rag2−/−, Rag2−/−IL2rg−/−, germ-free (GF), Tnfrsf1a−/−Tnfrsf1b−/− and Tnf+/ΔARE mice pooled from at least 2 independent experiments (n=19, 13, 8, 7, 10, 7, 9, 9, 9 mice per group). Mann-Whitney nonparametric two-tailed test between WT and Rag2−/−IL2rg−/− p< 0.0001, WT and GF p<0.0001, WT and Tnfrsf1a−/− Tnfrsf1b−/− p=0.0002, WT and Tnf+/ΔARE p< 0.0001. (b) Whole mount immunofluorescence staining showing FALCs with CD11b+ myeloid cells (blue), CD45+ hematopoietic cells (green), IgM+ B cells (red), and CD4+ T cells (white) in the indicated mouse strains. Picture representative of 8 clusters from 4 mice from at least 2 independent experiments. (c-e) Microphotographs of the mesenteries of WT mice (c), number of clusters (d) and whole mount immunofluorescence staining as in b (e) after PBS or zymosan injection (n=8, 9). Data pooled from 2 independent experiments. Picture representative of 8 clusters from 4 mice from 2 independent experiments. Mann-Whitney nonparametric two-tailed test p<0.0001. Scale bar 50 μm. *p<0.001 and ** p <0.0001.
Figure 5
Figure 5. TNF is required for FALC formation upon inflammation
(a) Number of clusters found in the mesenteries of Tnfrsf1a−/−Tnfrsf1b−/− mice and whole mount immunofluorescence staining showing FALCs with CD11b+ myeloid cells (blue), CD45+ hematopoietic cells (green), IgM+ B cells (red), and CD4+ T cells (white) 72 h after PBS or zymosan injection. Data pooled from 2 independent experiments (n=6, 6). Mann-Whitney nonparametric two-tailed test p=0.2424. Picture representative of 8 clusters from 4 mice from 2 independent experiments. (b) Number of clusters present in the mesenteries of WT and Tnfrsf1a−/−Tnfrsf1b−/− mice reconstituted with WT bone marrow and whole mount immunofluorescence staining as in a after PBS or zymosan injection. Data correspond to WT BM into WT mice (n=5, 5) and WT BM into Tnfrsf1a−/−Tnfrsf1b−/−mice (n=6, 6) per group pooled from 2 independent experiments. Mann-Whitney nonparametric two-tailed test, WT BM into WT mice p=0.0079, and WT BM into Tnfrsf1a−/−Tnfrsf1b−/− mice p=0.1688. Picture representative of 8 clusters from 4 mice from 2 independent experiments. (c) Enumeration of clusters in the mesenteries of the indicated mutant mouse strains and whole-mount immunofluorescence as in a after PBS or zymosan injection. Data correspond to WT mice (n=7, 7), T-Tnf−/− (n=6, 8), B-Tnf−/− (n=4, 6) and M-Tnf−/− (n=8, 13) mice in the control and treated group pooled from 2 independent experiments. Mann-Whitney nonparametric two-tailed test WT p=0.0006, T-Tnf−/− p=0.0007, B-Tnf−/− p=0.0048 and M-Tnf−/− p=0.2156. Picture representative of 8 clusters from 4 mice from 2 independent experiment. Scale bar 50 μm. Each symbol represents an individual mouse. (d) Flow cytometric analysis showing TNF intracellular staining 2 h post zymosan injection in mesenteric eosinophils (gated as CD45+CD11b+SSChighSiglec-F+), neutrophils (gated as CD45+CD11b+Siglec-FLy6-Ghigh), macrophages (gated as CD45+CD11b+Siglec-FF4/80+) and monocytes (gated as CD45+CD11b+Siglec-FF4/80Ly6-chigh). Quantification of the percentages of TNF+ cells after zymosan in myeloid subsets is shown in bar chart. Data correspond to WT mice in the control and treated group (n=8, 8) pooled from 2 independent experiments. Mann-Whitney nonparametric two-tailed test, eosinophils p=0.1593, neutrophils p=0.3935, macrophages p=0.0002 and monocytes p=0.0002. *p < 0.01, **p< 0.001
Figure 6
Figure 6. CD1d restricted NKT cells are required for FALC formation
(a,b) Number of mesenteric clusters in the indicated mouse strains (a) and whole mount immunofluorescence staining showing FALCs with CD11b+ myeloid cells (blue), CD45+ hematopoietic cells (green), IgM+ B cells (red), and CD4+ T cells (white) 72 hours after PBS or Zymosan injection (b). Data correspond to Rag2−/− (n=6, 6), Ighm−/− (n=5, 5), Tg(CD3E)26Cpt (n=5, 5), Tcrd−/− (n=4, 6) and Cd1d−/− (n=5, 6) mice in the control and treated group pooled from 2 independent experiments. Mann-Whitney nonparametric two-tailed test, Rag2−/− p=0.5693, Ighm−/− p=0.0025, Tg(CD3E)26Cpt p=0.7857, Tcrd−/− p=0.0095 and Cd1d−/− p=0.5065. Picture representative of 8 clusters from 4 mice from 2 independent experiments. Scale bar 50 μm. *p <0.01, NS not significant.
Figure 7
Figure 7. iNKT cell activation induces FALC formation
(a) Flow cytometry of the mesenteries, spleen and mLN showing the percentage of CD3ε+ CD1d-α-GalCer tetramer+ iNKT cells in the lymphocyte gate. Data are representative of 3 independent experiments (b) Whole mount immunofluorescence staining showing CFSE-loaded iNKT cells (green) in mesenteric FALCs with CD11b+ myeloid cells (blue) and IgM+ B cells (red) 24 h after transfer. Data representative of 8 clusters from 4 mice in 2 independent experiments. (c,d) Numbers of mesenteric clusters and whole mount immunofluorescence staining showing FALCs with CD11b+ myeloid cells (blue), CD45+ hematopoietic cells (green), IgM+ B cells (red), and CD4+ T cells (white) 72 h after vehicle or α-GalCer injection. Data correspond to WT mice in the control and treated group (n=6, 9) pooled from 2 independent experiments (c) and Tnfrsf1a−/−Tnfrsf1b−/− mice in the control and treated group (n=9, 7) pooled from 3 independent experiments. Picture representative of 8 clusters from 4 mice from at least 2 independent experiments (d). Mann-Whitney nonparametric two-tailed test, WT p=0.0004 and Tnfrsf1a−/−Tnfrsf1b−/− p=0.2831. (e) Numbers of mesenteric clusters and whole mount immunofluorescence staining showing FALCs with CD11b+ myeloid cells (blue) and CD45+ hematopoietic cells (green) 72 h after PBS or zymosan injection in Rag2−/− mice (n=4, 5) and Rag2−/− mice transferred with high purity sorted CD3high T cells or CD3ε+ CD1d-α-GalCer tetramer+ iNKT cells (n=6, 5). Data pooled from 4 independent experiments. Mann-Whitney nonparametric two-tailed test p=0.0043. Picture representative of 8 clusters from 4 mice from 4 independent experiments. (f) Numbers of mesenteric clusters in Tcra-Jα18−/− mice and whole mount immunofluorescence as in c 72 h after PBS or zymosan injection (n=7, 6). Data correspond pooled from 2 independent experiments. Mann-Whitney nonparametric two-tailed test p=0.0012. Picture representative of 8 clusters from 4 mice from 2 independent experiments. Scale bar 50 μm. *p < 0.01, **p< 0.001 and NS not significant.
Figure 8
Figure 8. Formation of FALCs is dependant on IL-4Rα signaling
(a,b) Numbers of mesenteric clusters in the indicated mouse strains (a) and whole mount immunofluorescence staining showing FALCs with CD11b+ myeloid cells (blue), CD45+ hematopoietic cells (green), IgM+ B cells (red), and CD4+ T cells (white) 72 hours after PBS or Zymosan injection. Data correspond to WT (n=7, 6), Il4ra−/− (n=5, 5), Il4−/− (n=5, 6), and Il13−/− mice (n=4, 6) in the control and treated group pooled from 2 independent experiments. Mann-Whitney nonparametric two-tailed test, WT p=0.0012, Il4ra−/− p=0.8016, Il4−/− p=0.0043, and Il13−/− mice p=0.0095. Picture representative of 8 clusters from 4 mice from 2 independent experiments. Scale bar 50 μm. (c) Numbers of mesenteric clusters in Il13−/− mice and Il13−/− mice transferred with high purity sorted CD1d-α-GalCer tetramer+ iNKT cells or CD3high T cells 72 h after PBS or zymosan injection. Data correspond to Il13−/− control injected with PBS (n=7), injected with zymosan (n=6), received CD3hi T cells and was injected with zymosan (n=6) and received iNKT cells and was injected with zymosan (n=6) pooled from 2 independent experiments. Mann-Whitney nonparametric two-tailed test p=0.3625. (d) Numbers of mesenteric clusters in C57BL/6J and Il4ra−/− mice 72 h after PBS or zymosan injection. Data correspond to WT control (n=9) and treated (n=5) and Il4ra−/− control (n=7) and treated (n=5) pooled from 2 independent experiments. Mann-Whitney nonparametric two-tailed test, WT p=0.001 and Il4ra−/− p=0.2159. *p < 0.01, **p< 0.001 and NS not significant.

Comment in

References

    1. Silverman GJ, Gronwall C, Vas J, Chen Y. Natural autoantibodies to apoptotic cell membranes regulate fundamental innate immune functions and suppress inflammation. Discov Med. 2009;8:151–156. - PubMed
    1. Alugupalli KR, et al. B1b lymphocytes confer T cell-independent long-lasting immunity. Immunity. 2004;21:379–390. - PubMed
    1. Ochsenbein AF, et al. Control of early viral and bacterial distribution and disease by natural antibodies. Science. 1999;286:2156–2159. - PubMed
    1. Baumgarth N, et al. B-1 and B-2 cell-derived immunoglobulin M antibodies are nonredundant components of the protective response to influenza virus infection. J Exp Med. 2000;192:271–280. - PMC - PubMed
    1. Haas KM, Poe JC, Steeber DA, Tedder TF. B-1a and B-1b cells exhibit distinct developmental requirements and have unique functional roles in innate and adaptive immunity to S. pneumoniae. Immunity. 2005;23:7–18. - PubMed

Publication types

MeSH terms

Substances